❌

Normal view

Crypto May Be Better Off Without CLARITY Act, Says Bitwise CIO: ‘Too Big to Crush’

1 October 2026 at 22:04

Crypto may have benefited from the failure of the US CLARITY Act, according to Bitwise Chief Investment Officer Matt Hougan.

The CLARITY Act failed to get the 60 votes needed to move forward in the US Senate after years of negotiations. But instead of hurting the crypto market, its failure was followed by a strong rally across several digital assets.

Unexpected Wins in Washington

Both Bitcoin and Ethereum rose about 11% after the vote. Some other tokens posted much bigger gains. NEAR jumped 125%, Uniswap rose 49%, and Avalanche gained 44%, according to Hougan. The reaction may seem surprising because the crypto industry had strongly supported the bill. Hougan said the industry wanted the legal certainty that CLARITY promised. But added that the final version also included several compromises that could have created new restrictions for crypto companies.

One major area is stablecoins. The exec explained that the proposed legislation would have restricted platforms from paying customers interest or rewards on stablecoin balances. With the bill now stalled, existing stablecoin rules remain in place. Hougan said this could benefit companies such as Coinbase, which use stablecoin rewards to attract users.

CLARITY would have created a national licensing system for spot crypto exchanges. It also could have placed limits on the way exchanges combine trading and brokerage services. With the bill gone, established exchanges such as Coinbase and Kraken avoid those changes for now.

Instead of waiting for new legislation and lengthy studies, the SEC recently allowed certain tokenized US stocks to trade through blockchain-based systems under temporary rules, which, according to Hougan, could give tokenization companies a chance to test the technology in real markets sooner.

Revenue-generating tokens are another area that has benefited from clearer regulatory guidance. Several tokens, including NEAR and Uniswap, have gained strongly while using protocol revenue for token buybacks. The SEC has also clarified that, once a blockchain network is functional, announcing a buyback program does not by itself turn a token into a security.

There is still a major risk as regulation can change when a new administration takes office. A future SEC or CFTC leadership could take a tougher approach to crypto. Despite this, Hougan expects “crypto to be too big to crush.”

Progress Under Existing Rules

Michael Saylor, co-founder and former CEO of Strategy, also sees the failure differently. He recently argued that crypto may be better served by working with supportive regulators at the SEC, CFTC, Treasury, and banking agencies than accepting the restrictions included in the bill’s final version.

Saylor believes the sector should use the next few years to build compliant crypto products under existing rules instead of rushing to accept a compromise simply to get legislation passed. His focus is on products that can lower costs, expand access, and give users more control over their money.

The post Crypto May Be Better Off Without CLARITY Act, Says Bitwise CIO: ‘Too Big to Crush’ appeared first on CryptoPotato.

Why Bitcoin Is Starting Q4 on Stronger Footing Than Traditional Markets

1 October 2026 at 19:35

Bitcoin outperformed stocks and gold in September as it entered the fourth quarter on a high note, according to Santiment. The world’s largest crypto asset gained around 8% during the month. In comparison, the S&P 500 saw little movement, while gold fell by more than 6%.

Several altcoins also recovered as investor interest returned to the market.

What Changed in September?

Fresh capital inflows supported Bitcoin’s rally. US-listed spot BTC exchange-traded funds (ETFs) attracted billions of dollars in September, including several large inflow days toward the end of the month. Meanwhile, Strategy added another 1,665 BTC to its holdings, which was indicative of continued corporate accumulation. Strive also expanded its corporate Bitcoin holdings by purchasing 1,107 for $94.5 million.

Improving economic conditions also helped the market. US inflation data for August came in below expectations, easing pressure on Treasury yields as well as reducing concerns about another Federal Reserve rate hike. While stock markets showed a limited response, cryptocurrencies recorded stronger gains following months of weak sentiment and heavy short positions.

Santiment found that crypto markets are entering Q4 with several potential growth drivers.

“Continued ETF demand, corporate accumulation, improving regulatory clarity, and renewed altcoin participation give traders reasons to stay optimistic.”

But while higher yields and crowded leverage can still create sharp pullbacks, the analytics firm stated that “crypto currently has catalysts that traditional assets simply haven’t matched.”

What’s Next?

Bitcoin is stuck just below $86,000, and Crypto Patel thinks this level could decide where the asset heads next. If BTC breaks above this level and holds, a move toward $100,000 could be back on the table. If it fails, however, traders will be watching $82,886, $80,300, and $76,400 for support. BIT Research’s latest report, meanwhile, has put a much bigger number on Bitcoin’s current cycle. The firm said that the bear market has likely ended and predicted an upside range of $185,000 to $215,000.

Whale wallets are also stacking up. In fact, wallets holding 10 to 10,000 BTC added 41,025 coins in just 10 days, pushing their total holdings to 13.64 million.

Bitcoin’s longer-term setup is still looking healthy as the MVRV Z-Score remained above its 365-day moving average. That level has historically acted as support during broader rallies. It doesn’t mean BTC is guaranteed to keep climbing, though. Short-term pullbacks can still hit, and they could be sharp.

For now, the bigger thing to watch is whether the Z-Score can hold above that average. If it does, CryptoQuant’s analysis states that the broader valuation trend remains supportive of further upside. A sustained break below the 365-day average would be a different story and could signal that the longer-term structure is starting to weaken.

The post Why Bitcoin Is Starting Q4 on Stronger Footing Than Traditional Markets appeared first on CryptoPotato.

Altcoin Trading Volume Hits 4x Bitcoin as One Trader Says He’s Out

1 October 2026 at 18:23

The altcoin market is showing signs of overheating, as spot trading volume is now four times higher than that of Bitcoin. The sharp rise in activity has also pushed leverage higher across the market.

This has prompted one trader to take profits and reduce exposure to altcoins.

Bitcoin Over Altcoins?

Doctor Profit said ONDO was sold with a 73% profit, while HBAR was closed with a smaller gain. XRP remains on watch, with a possible entry planned at a better price. The trader said there is no interest in buying altcoins while market conditions remain this hot. He also called altcoins a “great distraction and liquidity grab” and went on to add,

“This is why I’m out of Alts!”

Instead, the trader is betting on a Bitcoin correction, reiterating his previous stance. A short position was opened at $86,200, and additional short orders were placed between $86,500 and $89,500.

While he remains bullish overall, Doctor Profit had previously pointed to a potential pullback toward $79,000, near the 50-week moving average, before the broader uptrend continues. The analyst had flagged bearish signals across RSI, MACD/PPO, and MFI, while ADX showed weaker trend strength.

Warning Signs Emerge

A few days earlier, Darkfost also identified a few warning signs. According to the analyst, Total2, which tracks the altcoin market cap including Ethereum, absorbed more than $371 billion in inflows since June 2026. This is a 45% increase in just a few months.

The shift is also visible across Binance, where 87% of listed altcoins are trading above their 200-day moving average. That is a major change from August, when 80% were still below the crucial trend level. Darkfost explained that the move is indicative of a growing euphoria around altcoins, something that has historically been difficult to sustain for long.

Another signal is the rise in altcoin deposits to exchanges. Weekly deposit transactions have climbed above 22,700 on Binance and 8,300 on Coinbase, with another 32,000 or so across other platforms. The numbers are still below the levels seen early in the previous bull cycle. However, Darkfost also pointed to a developing bearish divergence on Total2’s RSI, which suggests that the altcoin momentum could be starting to cool after the recent surge.

The post Altcoin Trading Volume Hits 4x Bitcoin as One Trader Says He’s Out appeared first on CryptoPotato.

Robinhood Stock Prediction After September US Jobs Report

1 October 2026 at 17:30

Robinhood Stock traded near $113.24 on October 1 as investors assessed unemployment claims and softer inflation.  Bitcoin price stood around $83,975, while Ethereum (ETH) traded near $2,700 and XRP price hovered at $1.49. The economic combination could support risk appetite, although stronger employment also complicates expectations for lower interest rates. Ad Ad U.S. Initial Jobless

The post Robinhood Stock Prediction After September US Jobs Report appeared first on CoinGape.

Bitcoin Price Analysis: Is BTC’s Consolidation the Calm Before the Storm?

1 October 2026 at 16:35

Bitcoin is consolidating around $83.5K after bouncing from the mid-$70K area. The charts show a constructive higher-timeframe structure, but BTC is now facing a significant resistance cluster while short-term momentum has cooled. At the same time, the Apparent Demand Growth metric on CryptoQuant has recently leaned negative, suggesting that the demand backdrop has not yet confirmed another sustained leg higher.

Bitcoin Price Analysis: The Daily Chart

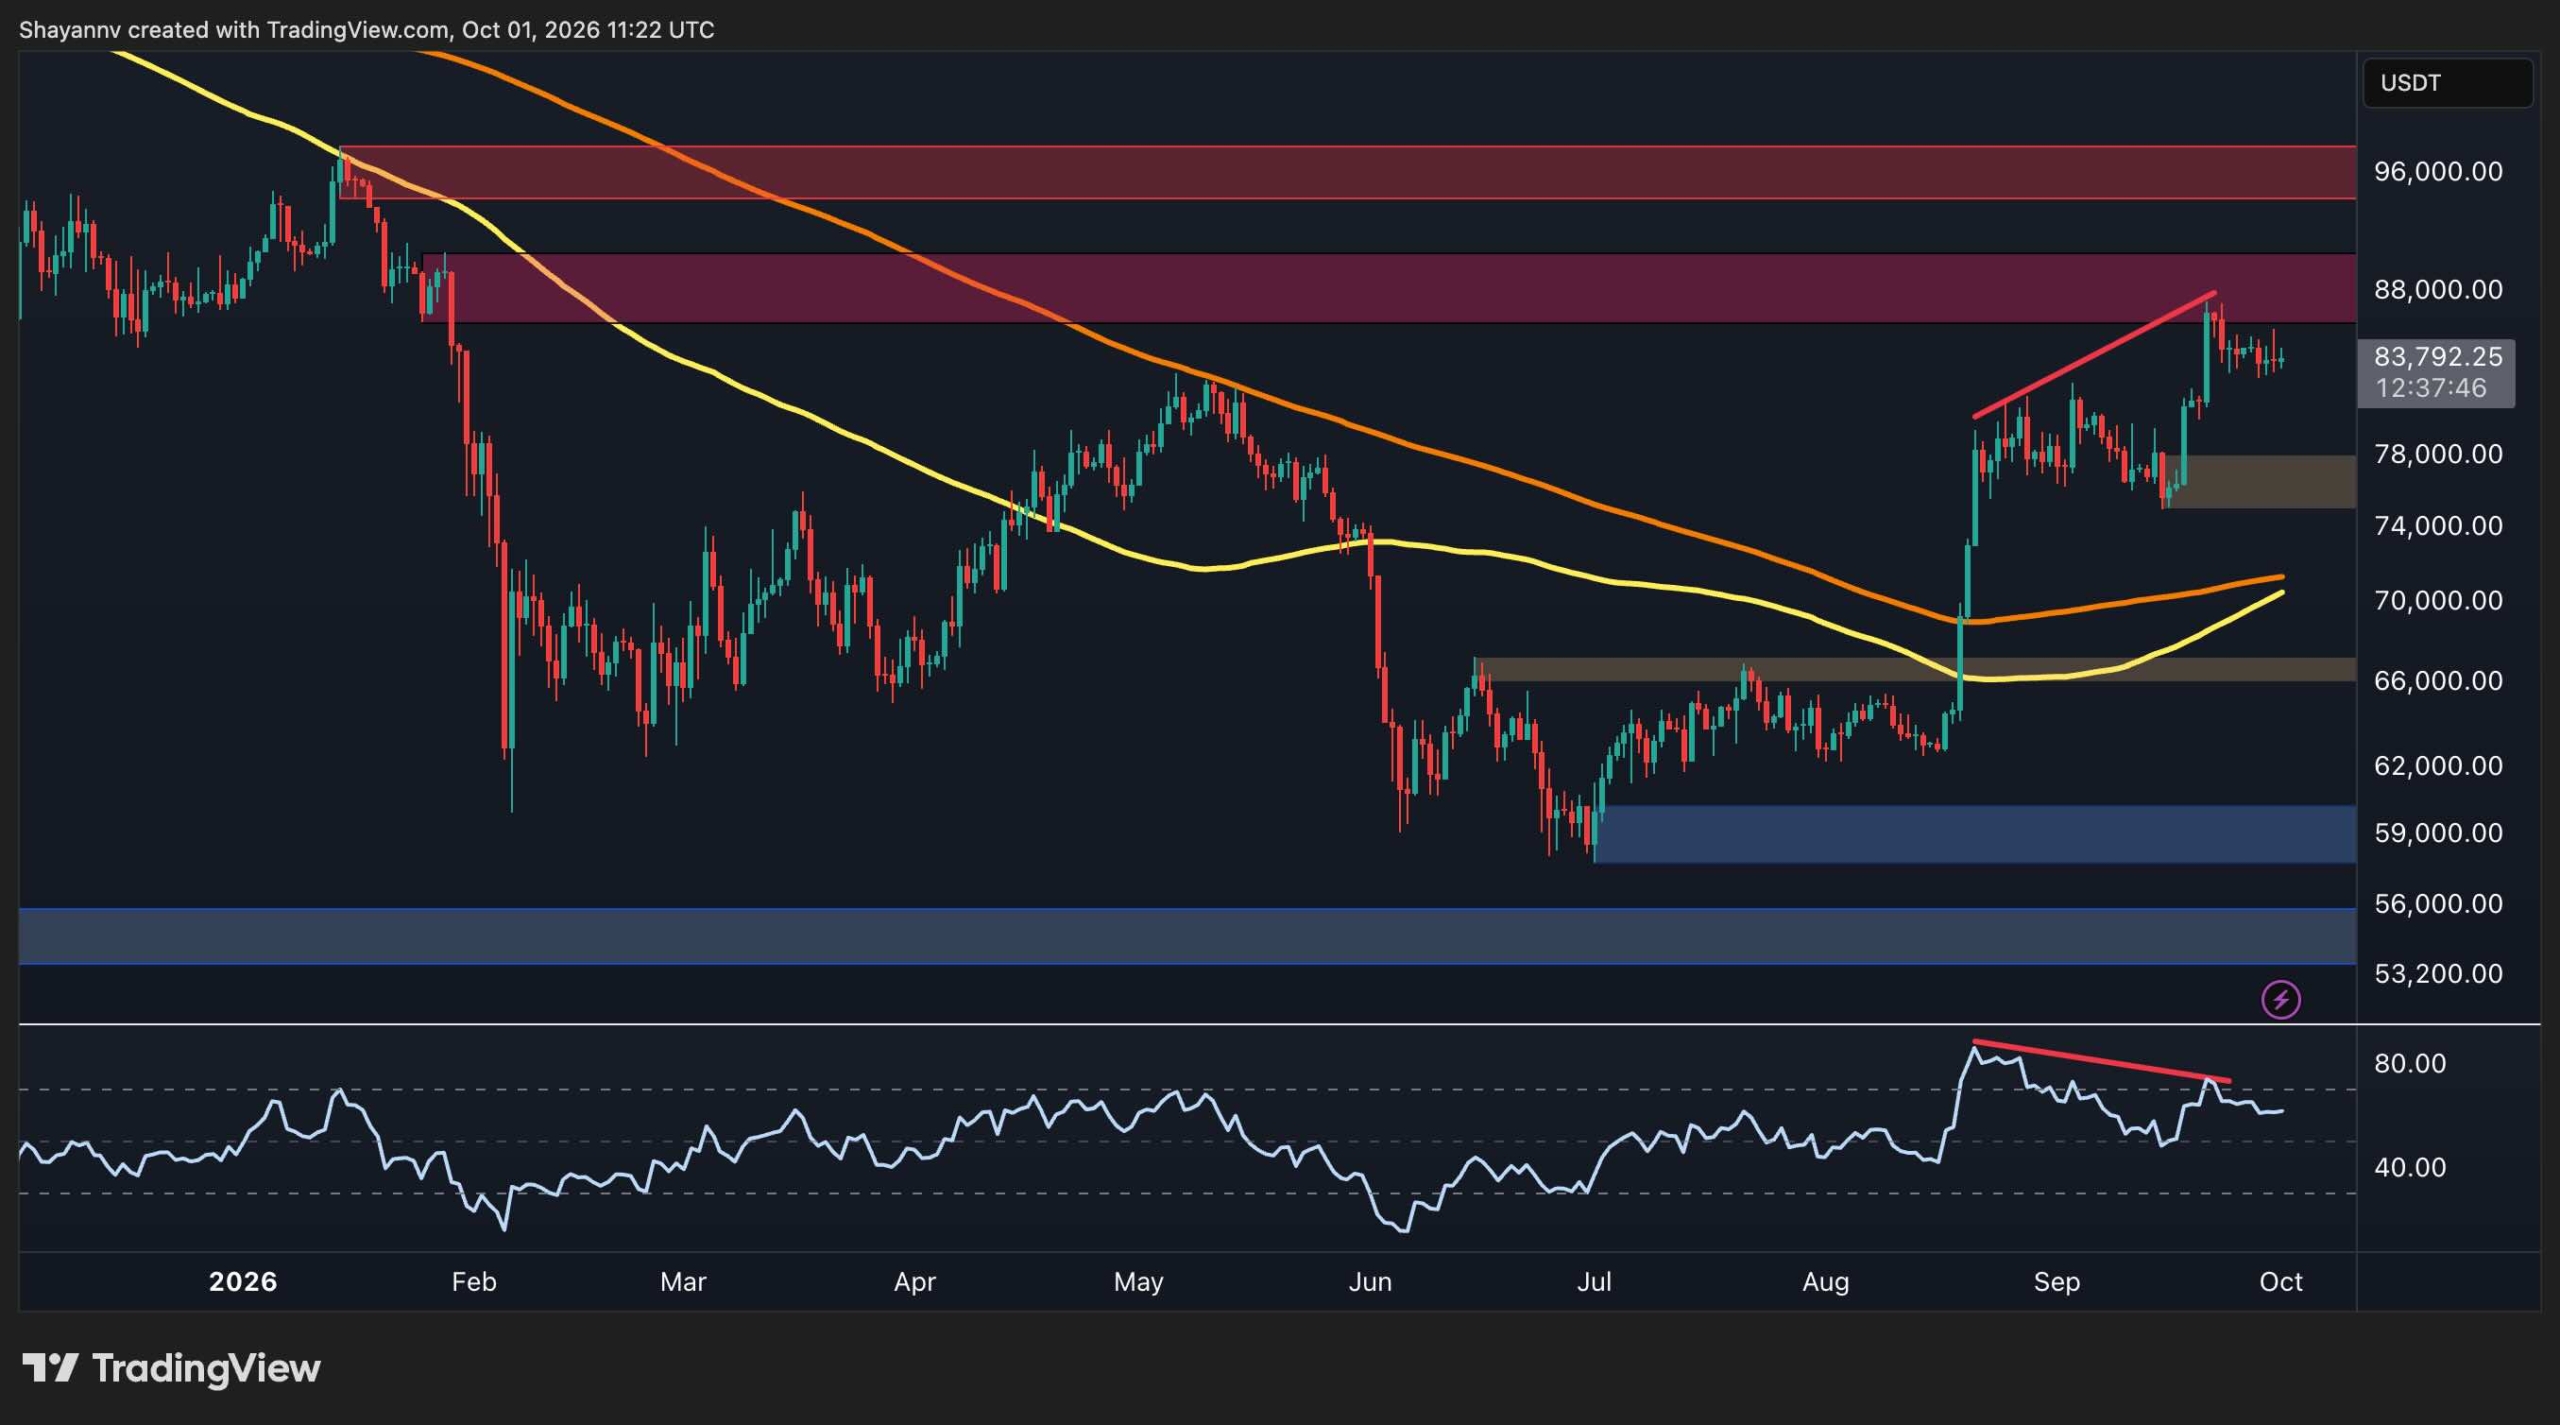
Bitcoin’s daily chart shows a substantial recovery from the $76K region. BTC first reclaimed the $66K area and then accelerated above the $70K and $78K levels, eventually reaching the $88K resistance zone. This area previously acted as a rejection zone, and the latest rally stalled just below it. A valid move above $88K would therefore represent an important structural development, potentially opening the way toward the higher resistance zone around $96K shown on the chart.

On the downside, the first notable support is around $76K, where the latest rally originated. The chart also highlights a deeper support zone around the $66K area, which remains the most important structural level located at the top of the previous consolidation range.

The 100-day and 200-day moving averages have also improved considerably. BTC has reclaimed both after spending much of the earlier part of the year below them. The 100-day moving average is now turning upward aggressively toward the 200-day average, which is pointing to a potential bullish crossover in the coming weeks. Still, BTC needs to clear the $88K resistance area to demonstrate stronger continuation.

The daily RSI has also recovered from its earlier weakness but is no longer near its recent highs. A bearish divergence is visible between the latest price advance and the RSI, with price making a higher high while momentum failed to establish a comparable high. This does not necessarily signal an immediate reversal, but it indicates that upside momentum has become less convincing while the price is stalling just below a major resistance zone.

BTC/USDT 4-Hour Chart

The 4-hour chart provides a clearer picture of the consolidation visible on the daily chart. After surging from roughly $75K to above $86K, Bitcoin entered a sideways-to-slightly bearish formation bounded by two descending yellow trendlines.

BTC is currently trading near $83.8K, roughly in the middle of this short-term range. The upper trendline is approaching the $85K area, while the lower boundary is currently around $82K.

This creates a relatively well-defined short-term structure. A breakout above the descending upper trendline, followed by a move through the $88K resistance zone, would signal that buyers are attempting to resume the preceding advance.

Conversely, a breakdown below the lower trendline could expose the $81K bullish order block. A loss of this zone would weaken the current bullish structure and could bring the broader $76K demand area back into focus.

In the near term, BTC therefore appears to be coiling beneath resistance. The key technical question is whether the current consolidation resolves through the upper trendline and the $88K level, or whether sellers force a deeper retracement toward $80K.

On-Chain Analysis

The Apparent Demand Growth chart on CryptoQuant provides a less supportive signal than the recent price action. The metric measures the net change in Bitcoin supply that has remained inactive for more than one year, adjusted for newly issued coins. Positive readings indicate that apparent demand is absorbing more BTC than the amount of supply entering the market through issuance, while negative readings indicate the opposite.

Historically, the chart shows periods of sustained positive Apparent Demand Growth coinciding with strong advances in Bitcoin’s price. Conversely, prolonged negative readings have appeared during periods when price struggled to establish durable upside momentum. Sharp reversals from deeply negative readings have also preceded recoveries.

The most recent portion of the chart shows that Apparent Demand Growth has been relatively unstable, with repeated negative readings and intermittent positive spikes. More recently, the metric has leaned toward negative territory even as Bitcoin recovered toward the mid-$80K range.

This creates an important divergence between price and the underlying demand signal. Bitcoin has managed to recover significantly from its summer lows, but the Apparent Demand Growth data shown here does not yet display the sustained positive expansion that accompanied some of the market’s stronger historical advances.

As a result, the on-chain data suggests that the latest price recovery has not yet been accompanied by a decisive improvement in apparent demand. If the metric turns persistently positive while BTC holds above $80K and challenges the $88K zone, that would provide stronger confirmation for the continuation scenario. However, if negative readings persist while price fails to break $88K, the current consolidation could remain vulnerable to a deeper correction, which could soon materialize if things fail to change for the better.


The post Bitcoin Price Analysis: Is BTC’s Consolidation the Calm Before the Storm? appeared first on CryptoPotato.

Bitcoin Chart Echoes Cycle That Delivered 400% Gains: Analyst

1 October 2026 at 15:31

Bitcoin analyst Frank Cappelleri says the OG cryptocurrency’s chart resembles the setup that preceded a 400% rally last cycle.

According to the CappThesis founder, the same technical base could support another leg higher.

Chart Mirrors the 2022 to 2023 Recovery

Speaking on CNBC, Cappelleri compared Bitcoin’s current structure with the period spanning 2022 and 2023, when BTC suffered a decline of about 70%.

He pointed to a chart of Bitcoin’s roughly 54% decline this cycle and set it beside the 70% drop mentioned above. “This also looks like a bullish pattern to me,” he said. That earlier slide ended in a large breakout, and he argued that BTC can move up hard once momentum takes hold.

“Bitcoin can really rally,” the analyst said. “It’s a 400% gain.”

However, he was careful not to project the same return this time. “Not calling for that,” Cappelleri stated, adding that he was instead looking for “a very similar foundation” that could eventually take Bitcoin back to new highs.

Cappelleri also pointed to BTC’s historical response to technical signals, saying, “Bitcoin really does well with technicals,” and arguing that its past price behavior makes those signals difficult to ignore.

BTC was valued at about $84,000 at the time of writing. The cryptocurrency experienced an increase of just over 1% in the last 24 hours and has remained more or less stable during the week. In addition, it has appreciated by about 10% in 14 days and 7% in 30 days but is 27% lower than where it was around the same time last year. Meanwhile, the asset’s third-quarter gain came to about 42%, its best Q3 since 2017.

Other Market Signals Point to a Contested Setup

As CryptoPotato reported yesterday, larger Bitcoin holders have been adding to their balances while smaller wallets have remained relatively unchanged. According to Santiment, wallets holding between 10 and 10,000 BTC added 41,025 BTC over 10 days, taking their combined balance to 13.64 million BTC, with such scenarios in the past often leading to stronger market conditions.

BIT Research has also argued that the bear market ended after Bitcoin held above $62,900 in late July. Its analysis puts the True Market Mean, an estimate of the average holder cost, at around $76,900, thus taking away another source of selling pressure. The firm outlined a bullish scenario of $185,000 to $215,000, while acknowledging that the timing and path remain uncertain.

But other analysis is less straightforward, such as from Ali Martinez, who noted that BTC had fallen after each of the four previous US midterm elections, with declines ranging from 27% to 72%, adding another source of uncertainty as November approaches.

The post Bitcoin Chart Echoes Cycle That Delivered 400% Gains: Analyst appeared first on CryptoPotato.

Bitcoin Price Prediction for This Month: Uptober or Downtober

1 October 2026 at 13:30

The Bitcoin price prediction for October 2026 faces a demand test as BTC trades near $83,536 on October 1. Bitcoin climbed 0.60% in 24 hours, but still is down 0.80% for the past week.  Bitcoin and Ethereum closed the third quarter with their highest monthly closes of 2026. Bitcoin price added $25,800, gaining 44%, while

The post Bitcoin Price Prediction for This Month: Uptober or Downtober appeared first on CoinGape.

Historical Trap Ahead? This Early November Event Could Derail Bitcoin’s Rally

1 October 2026 at 12:52

The primary cryptocurrency has been in a clear uptrend since July, rising 42% over the past three months. Many analysts have flipped bullish, believing the bear market is over and projecting a pump toward a new all-time high during the next cycle.

However, the US midterms in November may divert BTC from its potential bullish path and trigger a substantial correction. Here’s why.

BTC Dump?

The 2026 US midterm elections will take place on November 3, halfway through the president’s term, when voters elect all House members and about one-third of the Senate. This matters because they can change which party controls Congress, affecting Donald Trump’s ability to pass laws and shape national policy.

According to popular analyst Ali Martinez, the voting may negatively impact BTC, citing historical data. He noted that after the 2010, 2014, 2018, and 2022 elections, the cryptocurrency’s price fell 72%, 65%, 52%, and 27%, respectively.

“That does not prove elections caused the declines, but the pattern is worth watching ahead of November 3, 2026,” he said.

Martinez said the fourth-quarter data tells a similar story. He reminded that BTC pumped almost 400% in Q4 2010, but posted losses of 16.7% in Q4 2014, 42.16% in Q4 2018, and 14.75% in Q2022.

“As Q4 begins, seasonality suggests investors should be prepared for volatility,” the analyst warned.

Last but not least, Martinez paid special attention to Bitcoin’s short-term holder cost basis near $73,000, which could become the key support zone if the upcoming post-midterm pattern repeats.

Just a Speed Bump on the Road Higher?

Several X users who commented on the post asked Martinez whether this is a bearish signal, asking whether they should sell their positions. The analyst advised them to take some profits in late October, expecting the price to jump to $100K then, and then potentially buy again at $73,000 after the midterm elections.

Martinez is hardly the only one anticipating next month to be green. Historically, October has been among the most positive months for BTC, earning it the nickname “Uptober.” The asset has ended in the green in 10 of the past 13 Octobers, and it remains to be seen whether that trend will continue this year.

BTC Monthly Returns
BTC Monthly Returns, Source: CoinGlass


The post Historical Trap Ahead? This Early November Event Could Derail Bitcoin’s Rally appeared first on CryptoPotato.

Bitcoin Enters Its Most Bullish Month After Massive Q3: Uptober or Redtober Next?

1 October 2026 at 11:45

Although BTC is still in the red on a YTD basis, the past three months showed a significant improvement in its overall state, with September closing well in the green as well.

The focus has now shifted to October, which has been BTC’s greenest month since data has been tracked on CoinGlass. The question is: will history repeat, or will last year’s edition reign again?

3 In a Row

The primary cryptocurrency bottomed on July 1 at under $58,000 and rebounded in the following month to close with a 7.36% increase. Although the first half of August was quite sluggish, the second was spectacular as BTC exploded above $75,000 and ended the month with a 25% surge – the most since October 2023.

It entered September at around $77,000 before it quickly skyrocketed to $82,000. The bears were quick to reemerge at this point and didn’t allow it to continue further. Just the opposite; BTC slipped by several grand and slumped to $75,000 in the middle of the month as the CLARITY Act failed in the US Senate and the Fed hiked interest rates.

To the surprise of many, given the aforementioned negative developments, the cryptocurrency bounced off immediately and reclaimed the $80,000 line by the end of that particular week. It hasn’t traded below that level ever since. Moreover, it flew to $87,000 on September 22 and 23, but it was stopped. Despite losing some ground by the end of September, it still closed with a 6.33% pump, making it the third consecutive green month and fifth for the year.

Bitcoin Monthly Returns. Source: CoinGlass

Uptober or Redtober Next?

Ever since CoinGlass started tracking BTC’s performance in 2013, October has been the asset’s greenest month. 10 out of the past 13 editions have brought gains, and only three were in the red. When we add the three-month streak bitcoin has been on since July, the expectations for the next 30 days have increased considerably.

Moreover, many analysts have determined that BTC has reclaimed key resistance levels, which now means that the bull market is on, even though CryptoQuant warned yesterday that it might have slowed down.

Speaking to CryptoPotato, Lacie Zhang, Research Analyst at Bitget Wallet, said yesterday that “October has a strong historical track record for bitcoin,” but “seasonality alone is not an investment thesis.” After all, recall that BTC reached its latest ATH precisely last October before it crumbled in the notorious massacre that left over $19 billion in liquidations in 24 hours and went on a months-long red streak.

“Bitcoin’s median October return has historically been around 11%–14%. ETF inflows, declining exchange balances and corporate buying support the bullish case, while high interest rates, oil prices and renewed inflation pressure remain the main headwinds,” Zhang added.

The researcher outlined the base-case range for the month of $78,000-$95,000, but noted that if BTC holds the key $82,000 support and flips $87,500 into one, then $95,000 should be the next major target. On the other hand, a decisive break below $80,000 would “invalidate the seasonal bullish setup.”

The post Bitcoin Enters Its Most Bullish Month After Massive Q3: Uptober or Redtober Next? appeared first on CryptoPotato.

Bitcoin Bull Market Shows Signs of Cooling: CryptoQuant

30 September 2026 at 23:29

Bitcoin (BTC) remains in a bull market after closing above its 365-day moving average last week, but recent on-chain data suggests momentum is slowing. CryptoQuant said in a recent research note that several indicators now point to higher selling pressure and weaker demand.

Despite these concerns, CryptoQuant’s Bitcoin Bull Score Index remains at 90, showing that most tracked indicators still support a bullish structure. BTC recently reached about $87,400, its highest level in eight months, before pulling back toward the low $83,000 range.

Profit-Taking Picks Up

One concern comes from short-term holders, whose unrealized profit margin has risen to 33%. The analytics firm said this is the highest level since December 2024 and that similar levels have preceded profit-taking.

That profit-taking is already showing up in realized gains, with Bitcoin holders cashing out about 25,700 BTC in profit on September 22. It was the largest single-day realized profit figure recorded in 2026, adding to evidence that some holders are selling after the recent price gains.

Selling signals are also appearing beyond Bitcoin, particularly in the altcoin market. Seven-day cumulative altcoin exchange inflows reached 76,000 transactions involving about 51,000 depositors, the highest levels recorded since October 17, 2025.

At the same time, demand is weakening in both the spot and futures markets. Apparent spot demand fell by roughly 170,000 BTC over the past 30 days. Speculative futures demand growth also slowed, dropping from about 164,000 BTC on September 14 to roughly 16,000 BTC more recently.

Key Support Levels Remain

Despite these signals, Bitcoin remains above several important on-chain support levels. CryptoQuant identified the 365-day moving average near $80,000 and the 200-day moving average around $71,000. The firm also identified the trader-realized price near $67,000 as a key level to watch.

According to the analytics firm, a decline toward these levels could signal consolidation. This would not necessarily mean a broader market reversal if support holds. However, continued weakness in demand alongside increased profit-taking could increase the risk of a deeper correction in the near term.

CryptoQuant described the market as still bullish but showing signs of fatigue. The next test will be whether buying demand returns to absorb selling pressure or whether Bitcoin moves closer to those support levels.

The post Bitcoin Bull Market Shows Signs of Cooling: CryptoQuant appeared first on CryptoPotato.

Bitcoin’s Biggest Holders Ramp Up Buying While Retail Traders Remain Flat

30 September 2026 at 22:39

Bitcoin climbed above $87,400 last week, but the rally has since lost momentum. The world’s largest cryptocurrency then tested the $83,000 range before it surged past the upper boundary of its weekly range at $85,000.

Amidst the stagnation, larger holders are increasing their holdings again.

Whale Accumulation Returns

According to blockchain analytics platform Santiment, wallets holding between 10 and 10,000 BTC added 41,025 units over the past 10 days. Their total balance has now reached 13.64 million BTC, equal to about 67.93% of Bitcoin’s total supply. Santiment explained that these whale and shark wallets are now at their highest holdings since the market rally in mid-August.

There is a clear difference between large and small holders. Wallets holding less than 0.01 BTC have remained mostly unchanged during the same period. Santiment revealed that stronger market conditions have historically appeared when larger holders accumulate while smaller traders sell.

However, the analytics firm said the current pattern is not a guaranteed signal for Bitcoin’s price. Market watchers will likely focus on whether large holders continue adding BTC and whether retail investors begin reducing their positions. The trend could provide another indicator of changing market sentiment in the coming days.

Adding to the bullish picture, BIT Research said Bitcoin’s bear market may have already ended. The firm identified the cycle low in late July after the asset held above $62,900 and showed signs of weakening downside momentum. Since then, BTC has reclaimed key levels, including its 21-week moving average at $69,272, and moved above its March 2024 high of $73,084.

The report also highlighted Bitcoin’s cost basis. The True Market Mean currently stands at $76,897, which essentially means that the typical holder is back in profit. This could reduce selling pressure from investors looking to exit at break-even. The firm expects an upside range of $185,000 to $215,000 in its bullish scenario.

However, crypto analyst Doctor Profit speculated a short-term pullback before BTC’s next move higher. He pointed to bearish signals across several indicators, including RSI, MACD/PPO, and MFI, while also noting weaker trend strength on the ADX indicator.

ETF Inflows and Corporate Buying

Even as the market moves through a quieter stretch, institutional demand is still showing up. US-listed spot Bitcoin ETFs, for instance, attracted a whopping $2.4 billion last week. This week started at a slower pace, but the flow has remained positive. The funds raked in just over $31 million on Monday and another $66 million on Tuesday.

Corporate buyers have also stayed active. Strategy added another 1,665 BTC over the past week. The company paid an average of $85,681 per coin, taking its total holdings to 847,666 units. Strive has added to the buying activity as well. CEO Matt Cole said the company spent $94.5 million on 1,107 BTC at an average price of $85,400. Its total holdings have now reached 27,462.

The post Bitcoin’s Biggest Holders Ramp Up Buying While Retail Traders Remain Flat appeared first on CryptoPotato.

Bitcoin Fell After Four US Midterms: Could 2026 Break the Pattern?

30 September 2026 at 22:19

US midterm elections have a history of making investors nervous and markets more volatile. According to Ali Martinez, Bitcoin could face more volatility after this year’s highly anticipated event.

In a recent post, the analyst noted that BTC fell 72% after the 2010 midterms, 65% after 2014, 52% after 2018, and 27% after 2022. While this pattern does not prove the elections caused the declines,  the historical moves are worth watching ahead of November 3, 2026.

Four Midterms, Four Drops

Martinez also highlighted Bitcoin’s fourth-quarter performance in previous midterm years. BTC gained 391% in Q4 2010 but fell 16.7% in 2014, 42.16% in 2018, and 14.75% in 2022. This data indicates the possibility of increased volatility as the fourth quarter begins.

$73,000 area was flagged as an important level to watch. According to his analysis, this zone represents Bitcoin’s short-term holder cost basis and could act as support if the market sees a post-election decline.

Prediction markets such as Kalshi and Polymarket show Democrats maintaining an advantage over Republicans. The latter’s loss in the 2026 midterms could create fresh uncertainty for the crypto market. Democrats could gain control of the House, Senate, or both, which would make crypto-friendly regulation harder to advance. The CLARITY Act, which aimed to create clearer and lighter rules for digital assets, already failed to clear the Senate in September.

Reset Soon?

Amid all the midterm uncertainty, a Bitcoin pullback appears to be on the cards. For instance, pseudonymous trader “bee” believes the crypto asset may be setting up for a larger move, but sees a possible pullback before the next major rally.

BTC is currently trading between the 50-week moving average near $77,600 and the 100-week moving average around $89,700. The 200-week moving average sits lower, near $66,000. Bitcoin could first hold its current range and climb toward $90,000. A break above the 100-week moving average may attract more liquidity and push BTC higher. However, the trader expects momentum could weaken around the $90,000-$95,000 area.

From there, BTC risks rotating back toward $75,000-$77,000. “bee” isn’t the only one anticipating a correction. Doctor Profit also expects the asset to retest $79,000 before continuing higher.

The post Bitcoin Fell After Four US Midterms: Could 2026 Break the Pattern? appeared first on CryptoPotato.

Bitcoin Price Tops $85K as US Core PCE Rises 0.2% MoM, Cooler Than Expected

30 September 2026 at 16:36

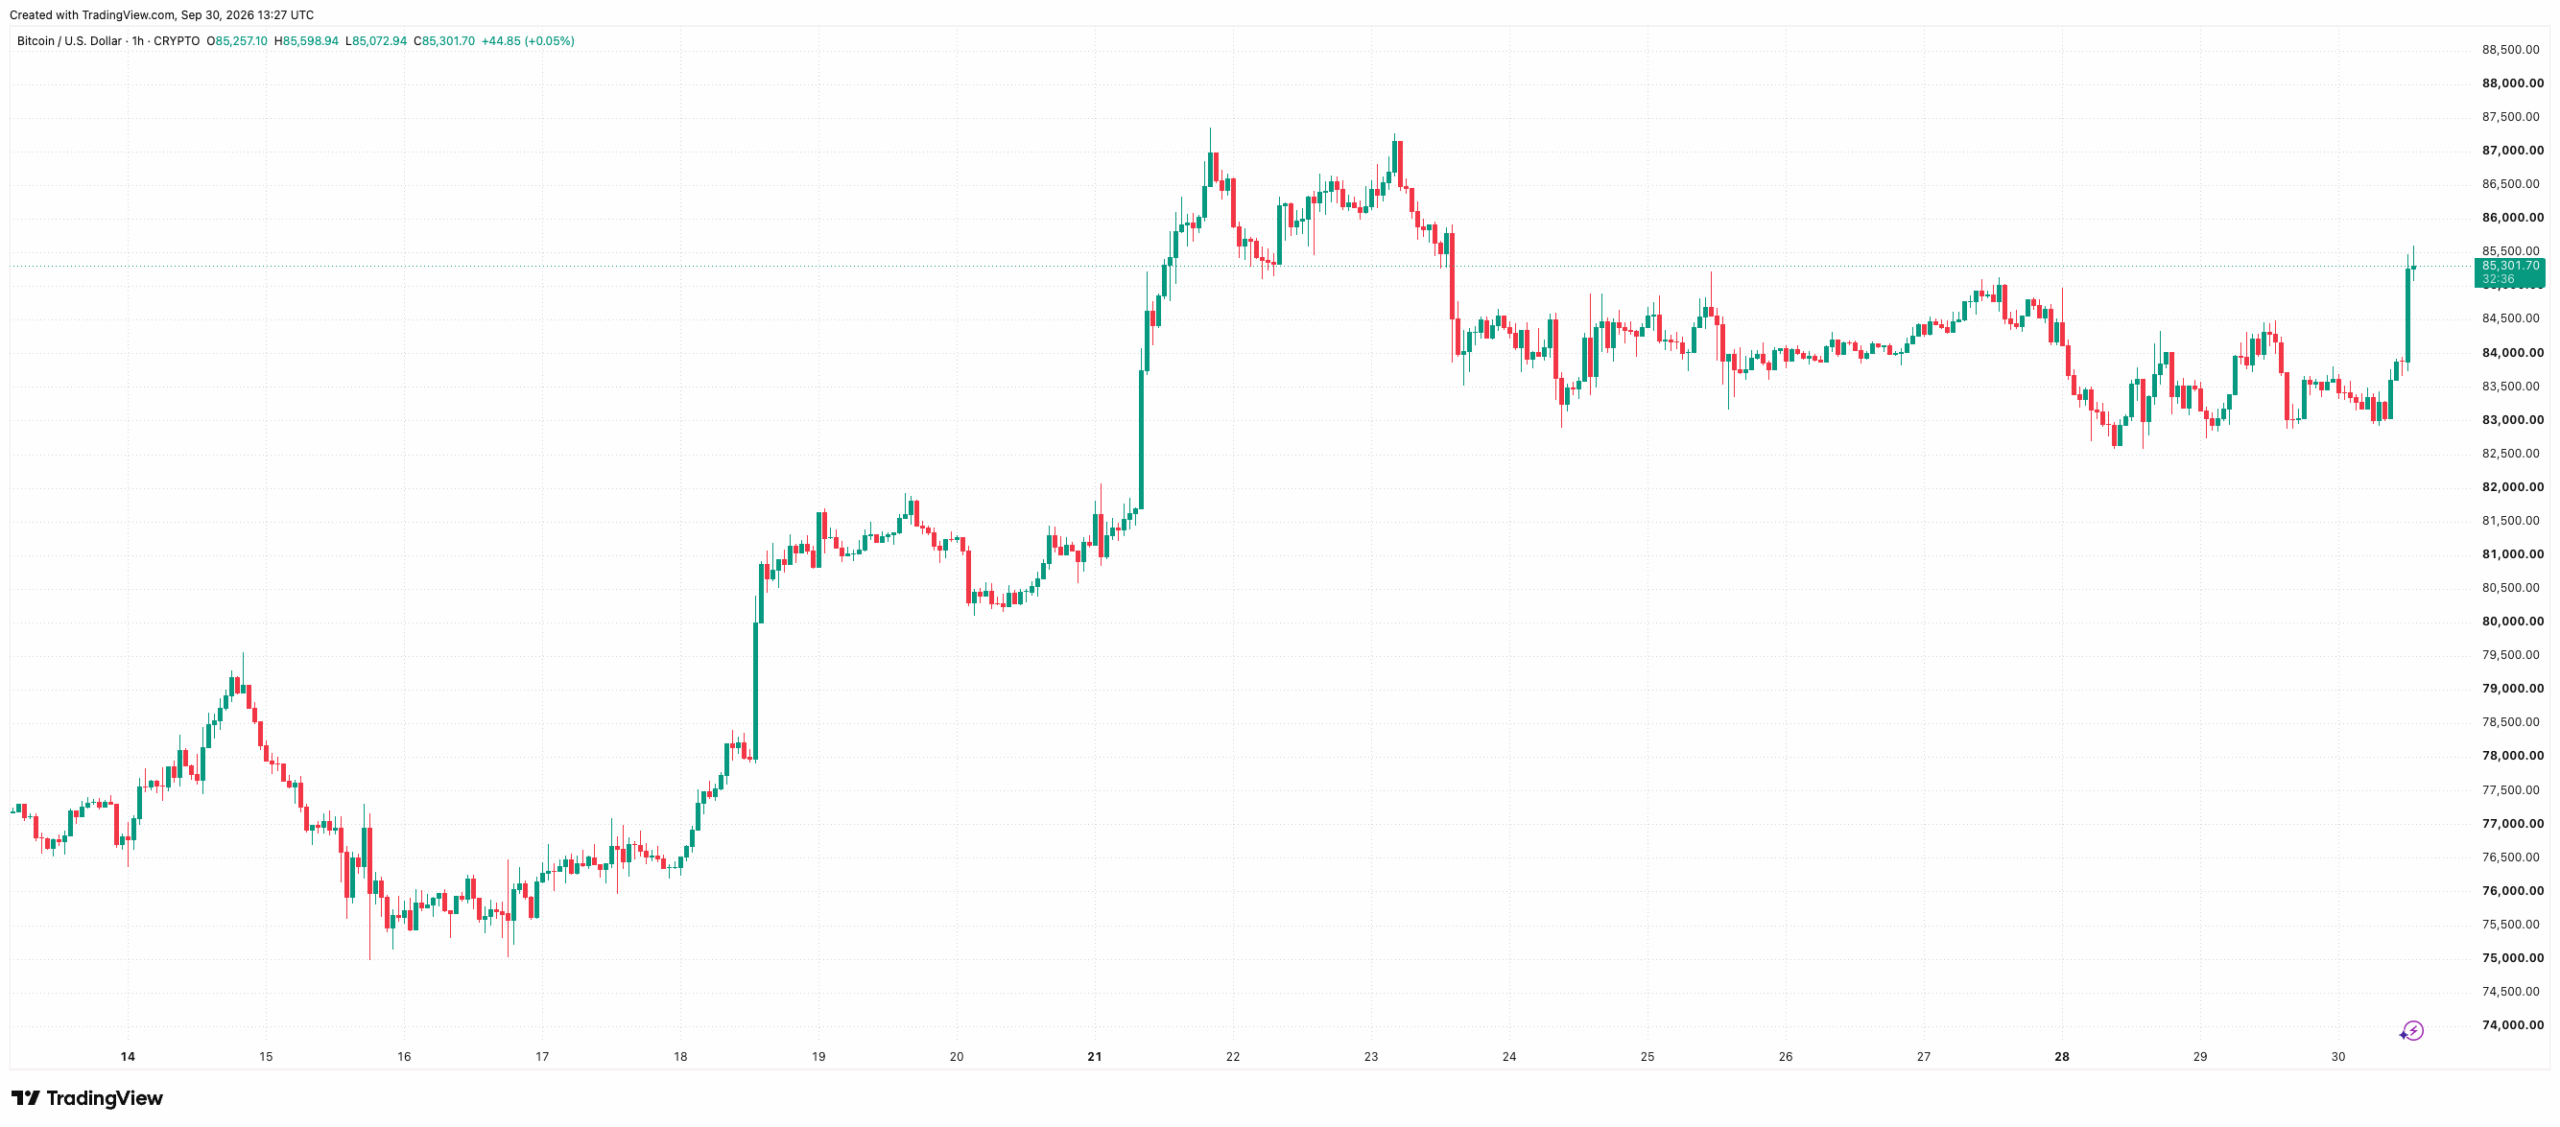
Bitcoin’s price surged in the past hour after the US Bureau of Economic Analysis released the core PCE report. The cryptocurrency touched $85,600, jumping from below $84K just an hour ago, showcasing that crypto traders welcomed the signs of cooling inflation.

It’s important to note that many altcoins also surged in the past hour, including ZEC, which is up more than 3.6%, HYPE, up 1.1%, ETH up 1.5%, SOL up 2.2%, and so forth.

BTCUSD_2026-09-30_16-27-24
Source: TradingView

This comes on the back of the fact that consumer prices posted a smaller-than-expected increase in August from a year ago, according to the primary inflation gauge of the Federal Reserve. The personal consumption expenditures price index increased by 0.3% for the month, putting the 12-month gain at 3.4%.

On the other hand, excluding food and energy, PCE posted a 0.2% increase that put the annual core level at 3%. The expectations were for a 0.3% increase and 3.3% annual rate, conversely. Speaking on the matter was David Russel, global head of market strategy at TradeStation, who said that this is “good news for investors worried about the recent surge in bond yields, and it bolsters the case for not hiking in October.” Recall that earlier this month, the Federal Reserve increased interest rates for the first time in three years, which, contrary to what many expected, pushed BTC’s price up.

The post Bitcoin Price Tops $85K as US Core PCE Rises 0.2% MoM, Cooler Than Expected appeared first on CryptoPotato.

Bitcoin $215K Scenario Emerges as BTC Reclaims Key Market Levels

30 September 2026 at 11:43

BIT Research published a report on Wednesday arguing that Bitcoin’s bear market is over, with one upside scenario for this cycle running from $185,000 to $215,000.

The primary cryptocurrency is trading above $83,000 and looks set to finish its third straight month in the green, pushing quarterly gains to 42%.

BIT Calls the Bottom on Holder Profits

The firm says it called the cycle low in late July, after Bitcoin hit a downside target from Elliott Wave analysis and held above $62,900.

Weekly RSI, a gauge of how hard prices are falling, stopped dropping in June and July even as price made new lows, a split the report compares to the 2022 bottom. BTC then crossed its 21-week moving average at $69,272 and reclaimed $70,000. It now trades around $83,000, above its March 2024 high of $73,084.

The report leaned on cost basis, with the True Market Mean, the estimated average price holders paid, sitting at $76,897, so the typical holder and the average spot ETF buyer are back in profit; therefore, in the analysts’ view, this removes a source of selling pressure.

Another thing BIT considered was the fact that US federal debt has passed $40 trillion, and rising Treasury yields caused by worries over government finances can send money toward gold and BTC.

Its debt model gives a reference valuation near $105,000, but the main headwind is a stronger dollar, with traders pricing in more Fed rate hikes and the Strait of Hormuz still closed. However, the firm does not expect it to derail the rally, since past dollar strength has hurt gold more than Bitcoin.

The OG crypto has traded between $83,000 and $85,000 since a rejection near $87,000 last week, and at the time of writing, CoinGecko showed it just above that $83,000 level, although it represented a dip of over 4% in seven days.

Still, that price is a nearly 10% improvement across two weeks and more than 7% higher than where it was 30 days ago. Coinglass data puts the third quarter at +42.22%, the best quarter since Q4 2024 and the best Q3 performance since 2017.

ETF flows have also improved, with the funds recording $2.8 billion of net inflows in September so far, taking cumulative inflows to $57.6 billion and total net assets to about $108 billion.

How the Range Gets to $215,000

In past cycles, Bitcoin climbed at least 85% above the average holder’s cost, which is about $142,000 today.

“This is a reference level for tracking the bull market, not a minimum target or a final top,” BIT’s market watchers clarified. “Historically, price has kept rising after crossing it, but there’s no guarantee that repeats.”

Last cycle, it first reached the 85% mark near $73,000 in March 2024 and peaked at $126,000, roughly 1.7 times higher. If the multiple shrinks to 1.3 to 1.5 times on a $142,000 base, the result is $185,000 to $215,000.

Timing is looser. The last cycle took about 19 months to go from the 85% level to the peak, so a similar pattern would put $200,000 around 2028 or 2029, but the analysts called that pattern-matching and described timing as highly uncertain. Closer to now, they say the asset looks stretched after a fast climb, so a pause or a larger pullback is still possible.

The post Bitcoin $215K Scenario Emerges as BTC Reclaims Key Market Levels appeared first on CryptoPotato.

❌