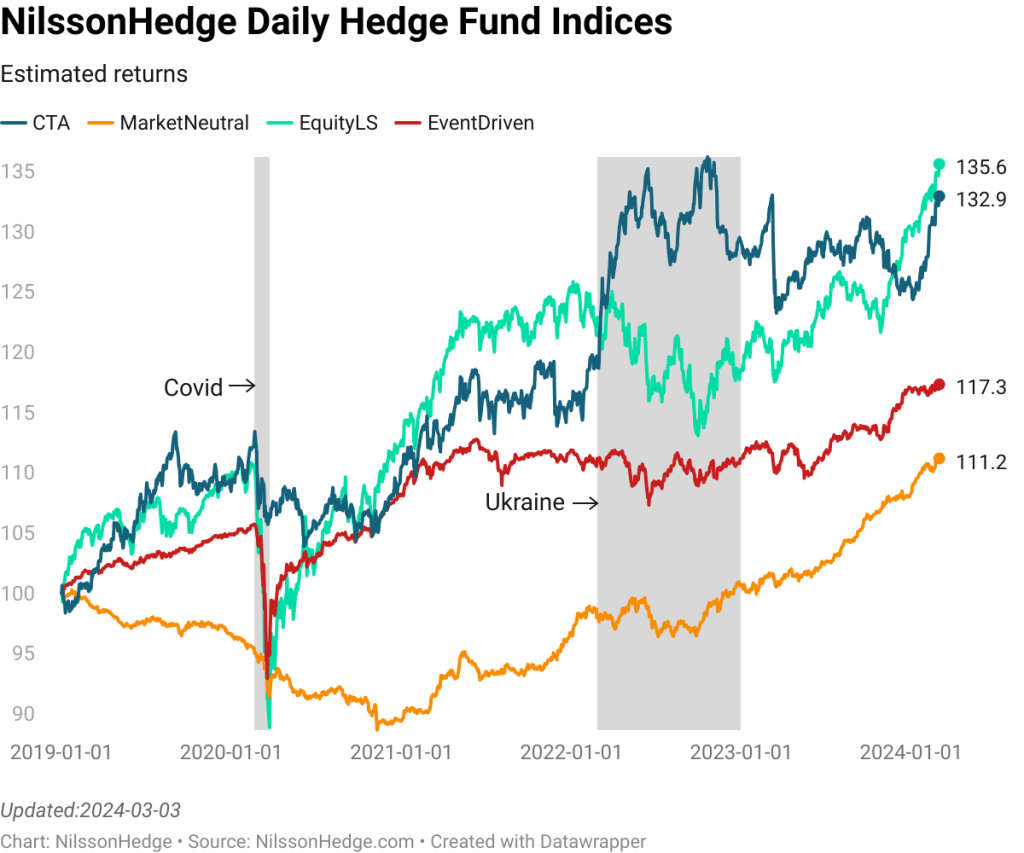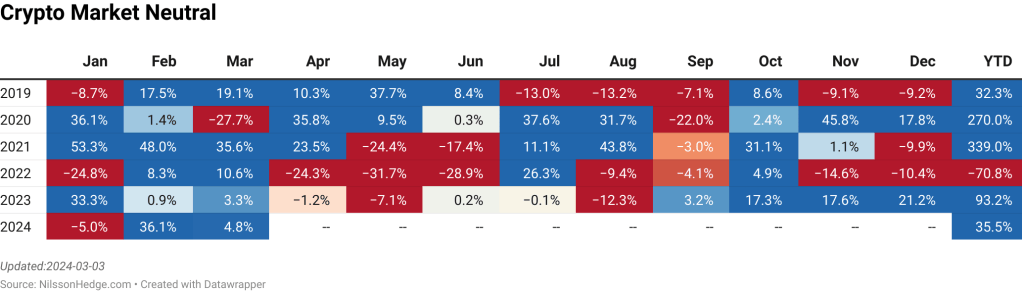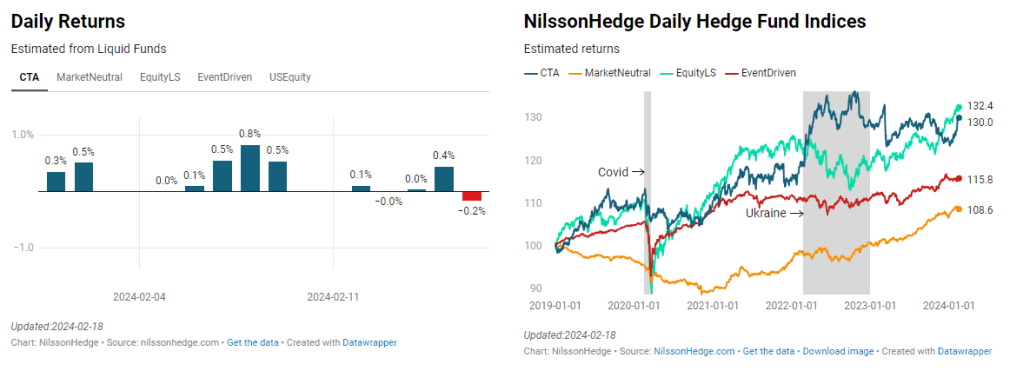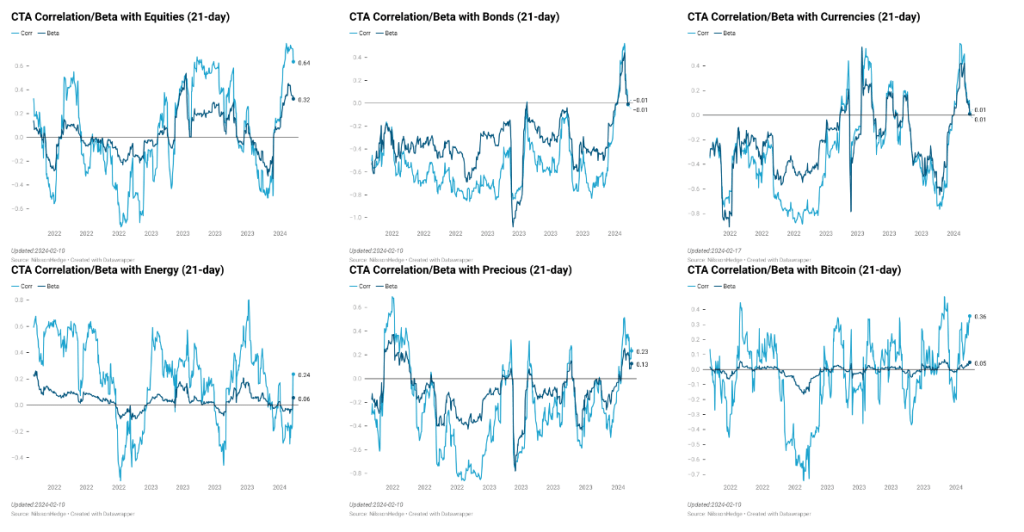
❌

Reading view

Honey, you Shrunk the Skew

This article first appeared in HedgeNordic’s Systematic Strategies and Quant Trading.

One of the mythical qualities of a trend-based strategy is that it is a strategy with a positive Skew, which measures the asymmetry of the returns. It is not always trivial to interpret, depending on the actual shape of the distribution. 

Skew describes the asymmetry of the shape of the distribution. Positive Skew is the tendency to see larger positive returns and smaller negative returns. Negative Skew is the tendency to observe larger negative observations and smaller positive gains. 

In layman’s terms, skewness suggests a distribution with occasional large gains and relatively smaller losses, whereas negative skewness indicates the opposite: steady gains punctuated by rare but severe losses. In technical terms, it is the third standardized moment. Skew is not a return measure, only a description of the return distribution.

The return distribution of a trend strategy is expected to have a ‘fatter’ right tail. But maybe not always in the way investors expect. 

During the golden days of Hedge Funds (pre-2008), positive skewness was an argument often used to motivate an increased allocation to Managed Futures strategies. Especially as other Hedge Fund strategies exhibited negative Skew. 

Expecting a positive Skew from momentum-based strategies is reasonable on a trade-by-trade basis, i.e. when looking at the return of individual trades, entry to exit. As we will show, it is not true when looking at the daily portfolio returns and seems to get worse over time. We build our own trend replication strategies, and we also look at a few of the daily indices that are available. 

As an investor and a trader, we know that CTA strategies often have large negative daily returns. Something that can come as a shock to investors. 

Trade by Trade statistics are seldom available or even of interest to the individual investor. If a manager has an extraordinary multiyear trade in Cocoa, Sugar, or Coffee it is great for the total return, but does not generally change the shape of the observable distribution. 

The Term Structure of Skew

As an illustrative Trend Strategy, we build a standardized breakout strategy. We use a portfolio of 86 liquid futures, diversified over Equities, Fixed Income, Currencies, and Commodities. Over this portfolio, we apply a breakout strategy with a variable lookback. We start with 2 days and run this strategy all the way up to 256 days, creating 15 different return streams. 

The distance between lookbacks is based on the square root of 2. While this seem overly specific, this also ensures that we have a reasonable degree of diversification between two adjacent portfolios.

The breakout strategy buys higher highs and sells lower lows, as measured over the last N days. 

The average holding periods here range from a week to close to two years. Breakouts are easy to conceptualize, and the results generally hold for other common measures of trend direction. The shorter breakout typically does not have positive (simulated) returns, partly illustrating that markets have different behaviors over longer and shorter horizons. 
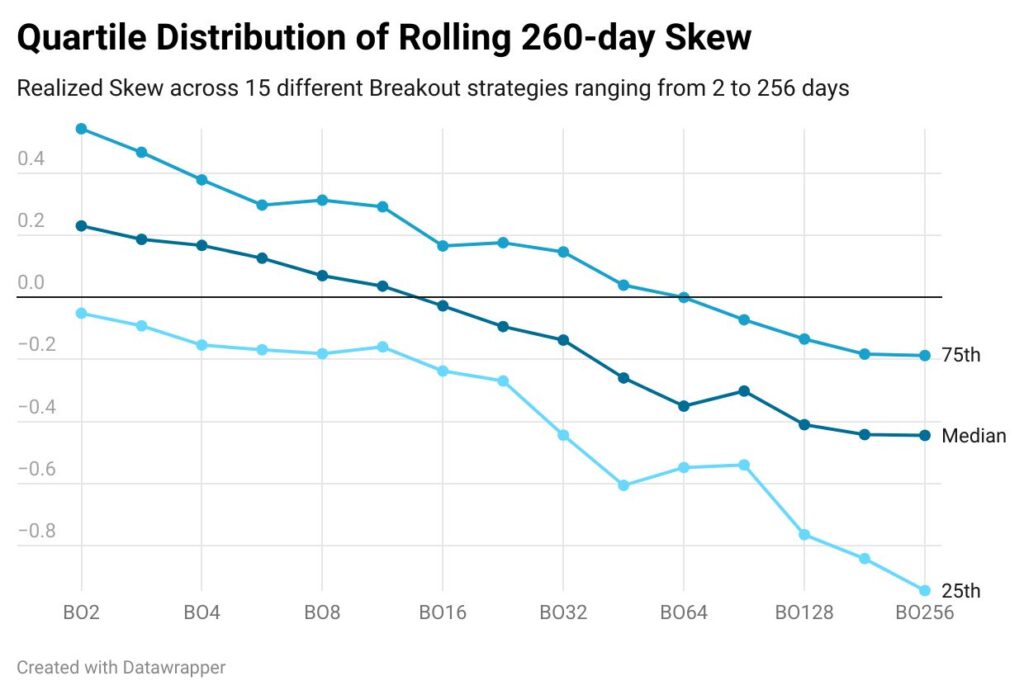
Line graph showing the quartile distribution of rolling 260-day skew for 15 different breakout strategies, indicating realized skew across varying lookback periods from 2 to 256 days.

We calculate the rolling yearly daily skew of the strategy, highlight the median skew, and the upper and lower quartiles. We can verify some earlier academic results, i.e. the term structure of skew is downward sloping for momentum strategies. The longer the holding period, the more negative skew we realize, and vice versa. 

To ensure that this is not an artifact of daily returns, we run the same calculations using monthly data. The results hold, with a downward sloping Skew term structure, but the best monthly skew is obtained for the 4-day breakout strategy, creating a slightly humped term structure. Skew turns negative on a 64-day breakout horizon rather than the 16-day breakout using daily data. Monthly returns hide a lot. 

Reality Check

As a quick reality check, we calculate the average daily skew of the two fastest breakout strategies (2 and 3 days) and the two longest (181 and 256 days). We compare this to the skew of a composite of different daily CTA indices. 
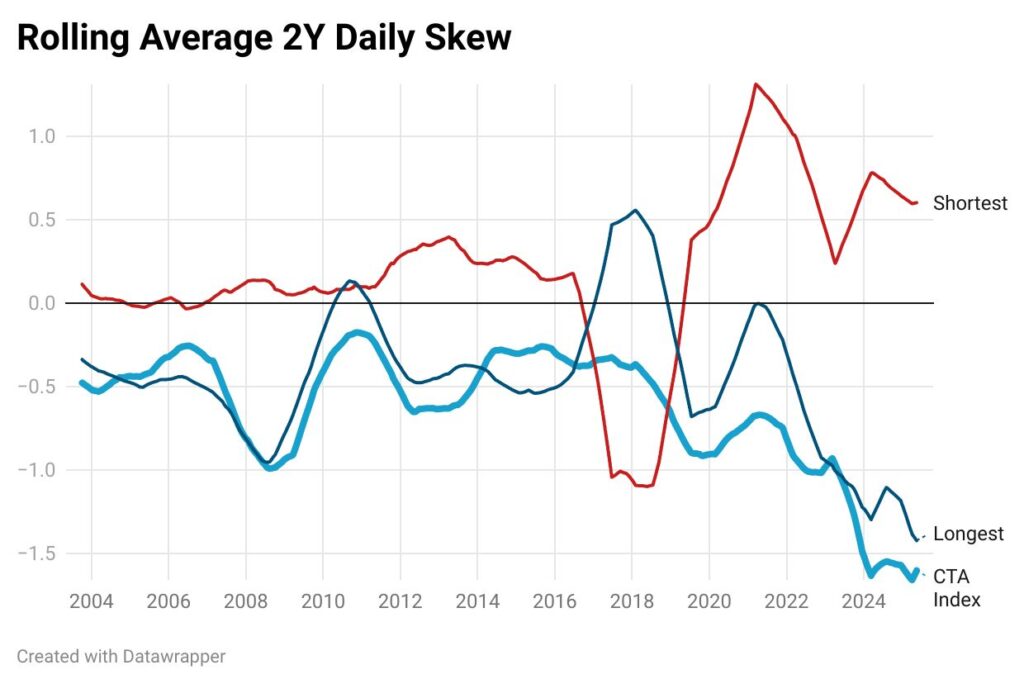
Graph showing the rolling average 2-year daily skew of various trading strategies, with lines indicating shortest and longest strategies compared to a CTA index from 2004 to 2024.

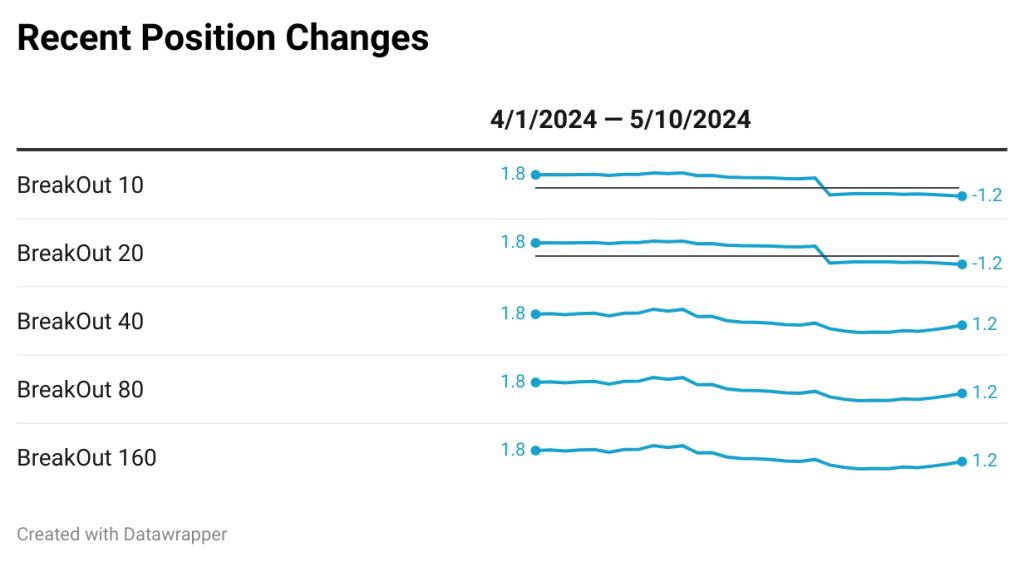
A trivial observation is that with a brief exception of an episode during 2017-2019, faster momentum strategies realized a larger positive skew. The realized Skew for shorter strategies is increasing since Covid. On the contrary, longer-term strategies have realized a negative skew, with a few exceptions. It is also getting increasingly negative. 

As our Breakout strategies are not ‘real’ CTAs, we calculate the same statistics based on daily returns from large CTAs. We note that this ratio is getting increasingly negative, and even more negative than what would be indicated by Breakout strategies that hold positions for years. 

As a side note, there are some other tricks that can achieve a higher positive skew for trend strategies. For instance, continuously adding exposure to an existing trend position. If the trend continues, the portfolios get increasingly exposed to a trend with strong positive drifts. That said, it is occasionally a bit difficult to combine with a sound risk management policy. 

Summary

While Skew may seem to be an esoteric measure, it has often been used as an argument for why Trend Following strategies should be included in a portfolio, i.e. the chance of obtaining large positive returns during market dislocations. 

Our analysis also shows that the choice of time frame tends to influence Skew. Shorter-term momentum strategies tend to exhibit more persistent positive Skew over time and do not suffer from a similar deterioration over the last five years. Other short-term strategies may have completely different skew properties. This result for such strategies is however outside the scope of this short article. 

The term structure of Skew is not a new observation and has been raised in previous academic and industry papers. The recent decreased Skew for Managed Futures managers could mean several different things:

  1. Large managers are often involved in crowded trades, suffering larger negative returns when positions are liquidated. 
  2. Managers are more often exposed to markets with an inherent negative skew. An example here would be an increased exposure to long equity or short volatility positions that tend to be negatively skewed. There is nothing wrong with this exposure, but they may imply a different dynamic than expected.
  3. Trend Managers have gradually gravitated towards slower and slower trading strategies. If nothing else, this typically increases capacity.
  •  

Best’n’Worst May 25

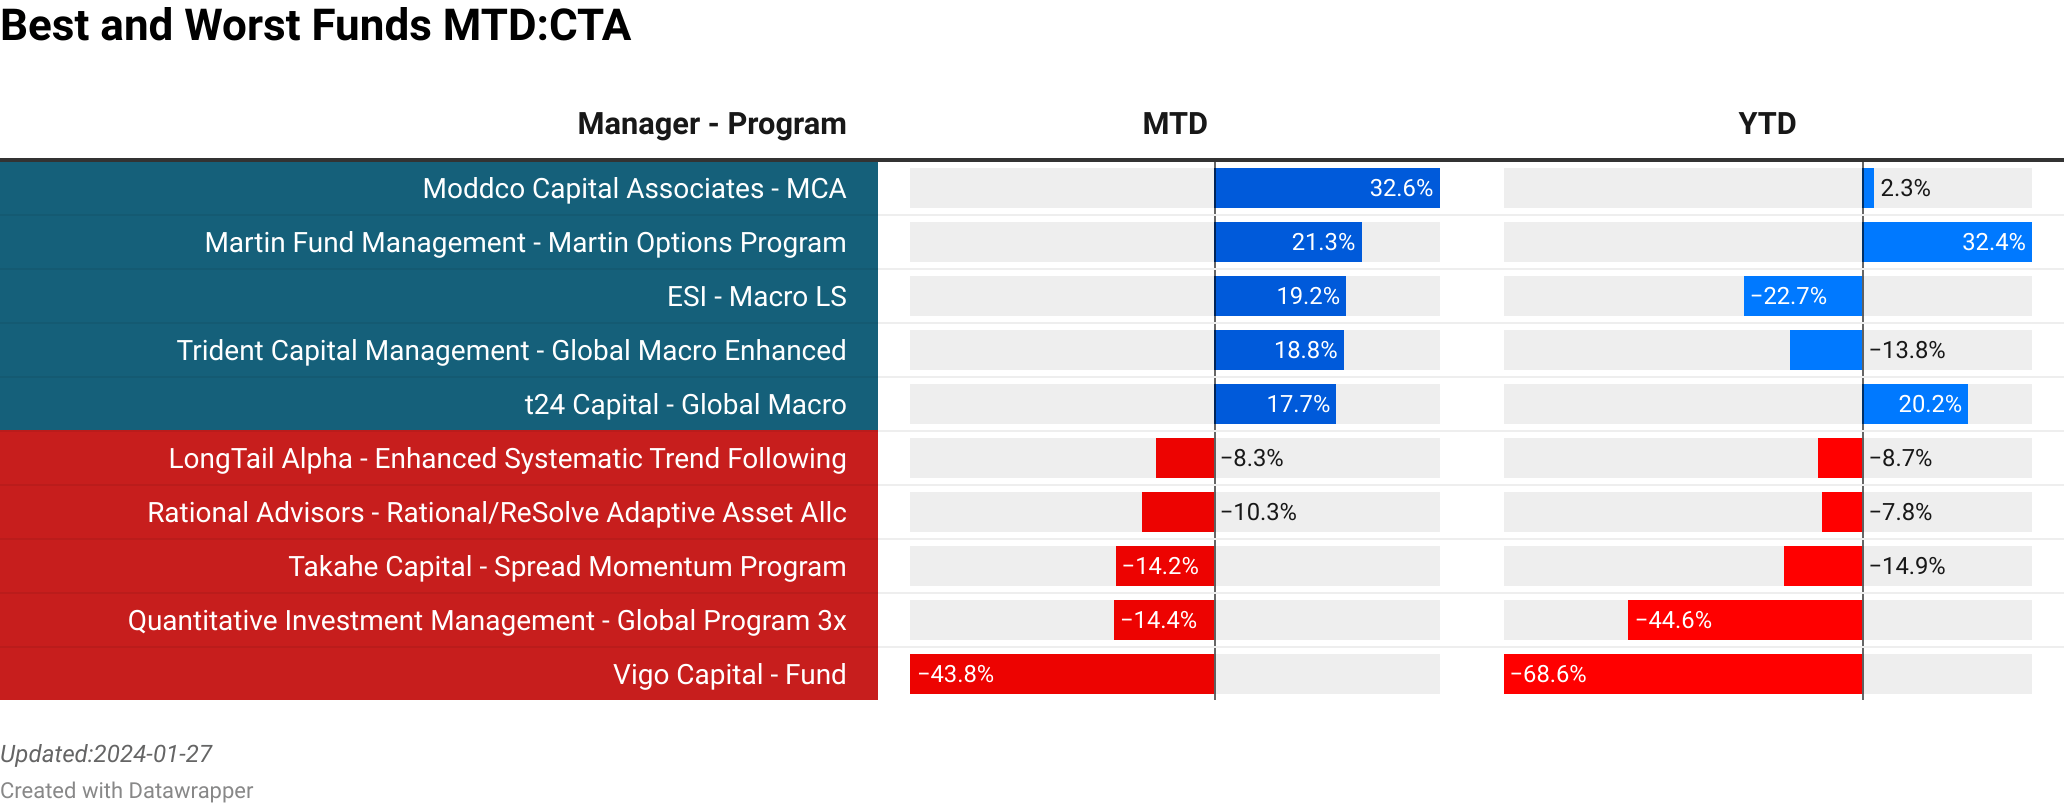
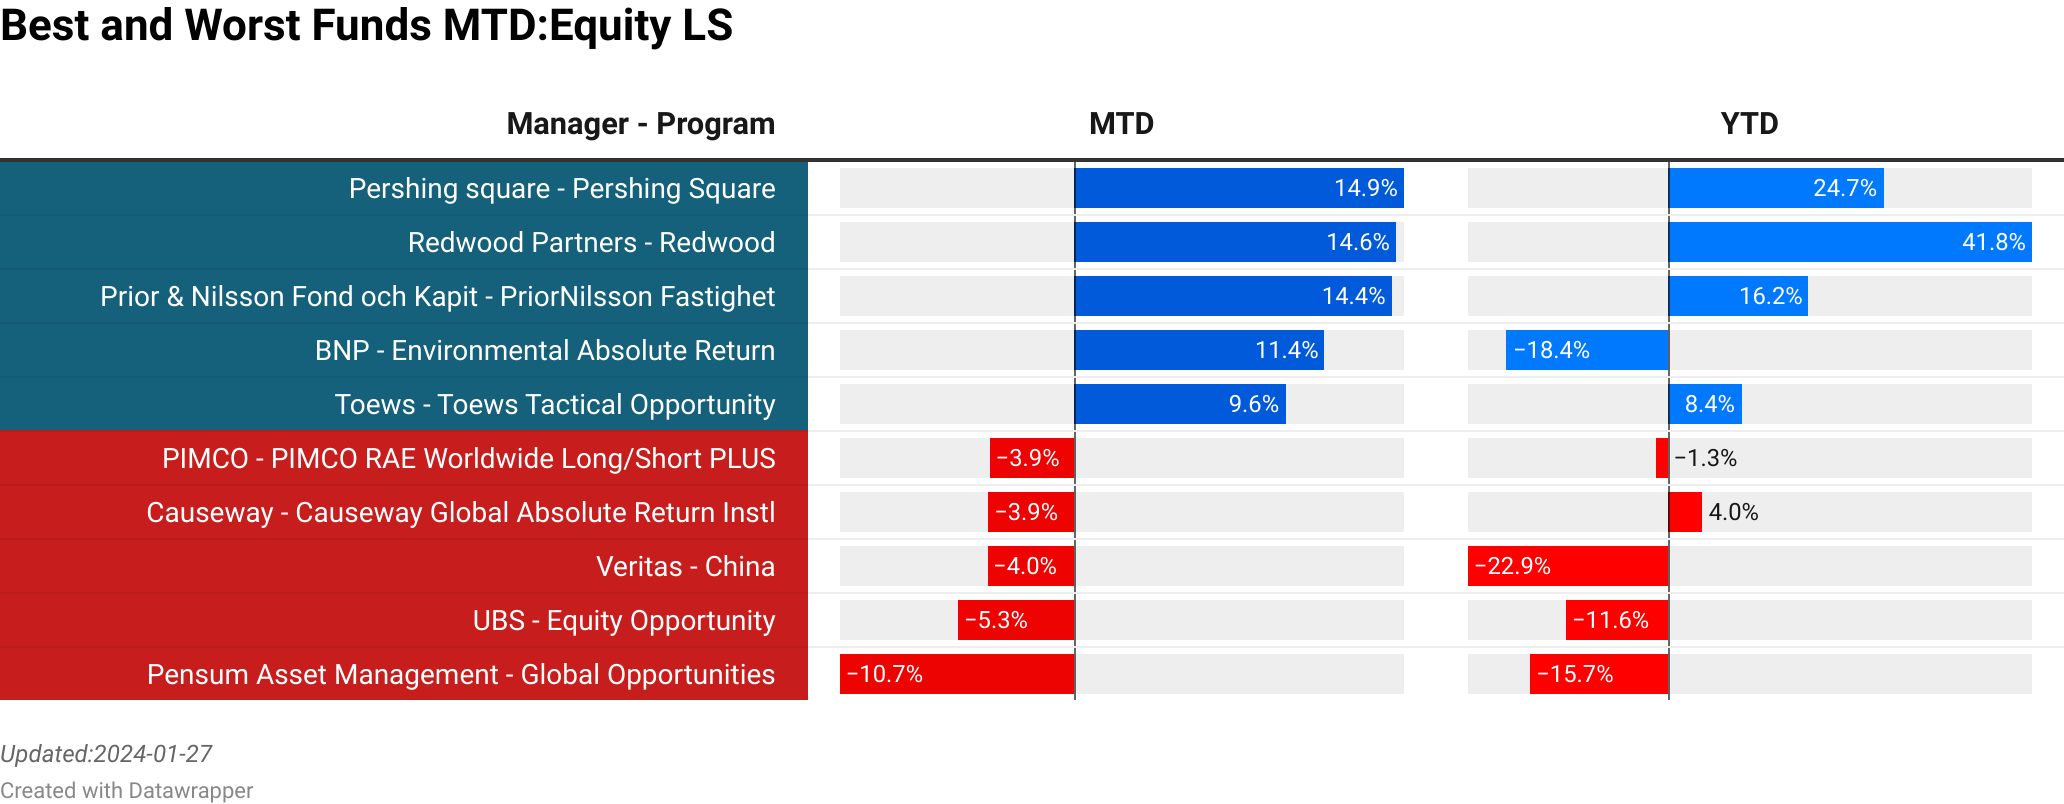
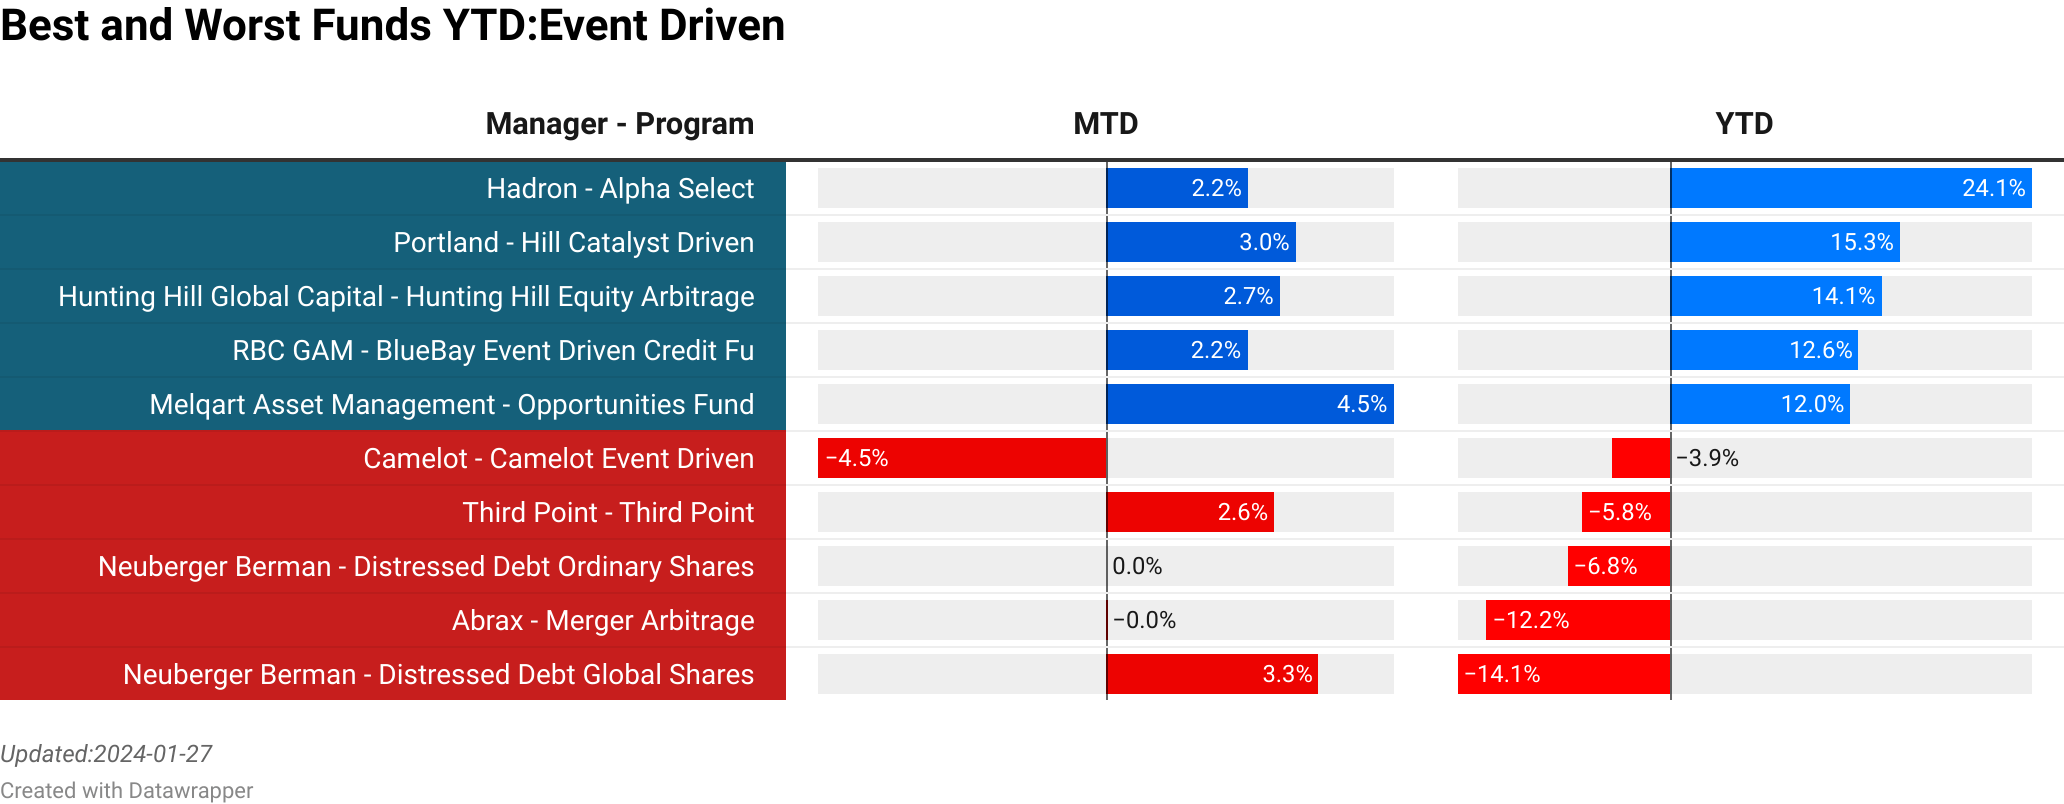
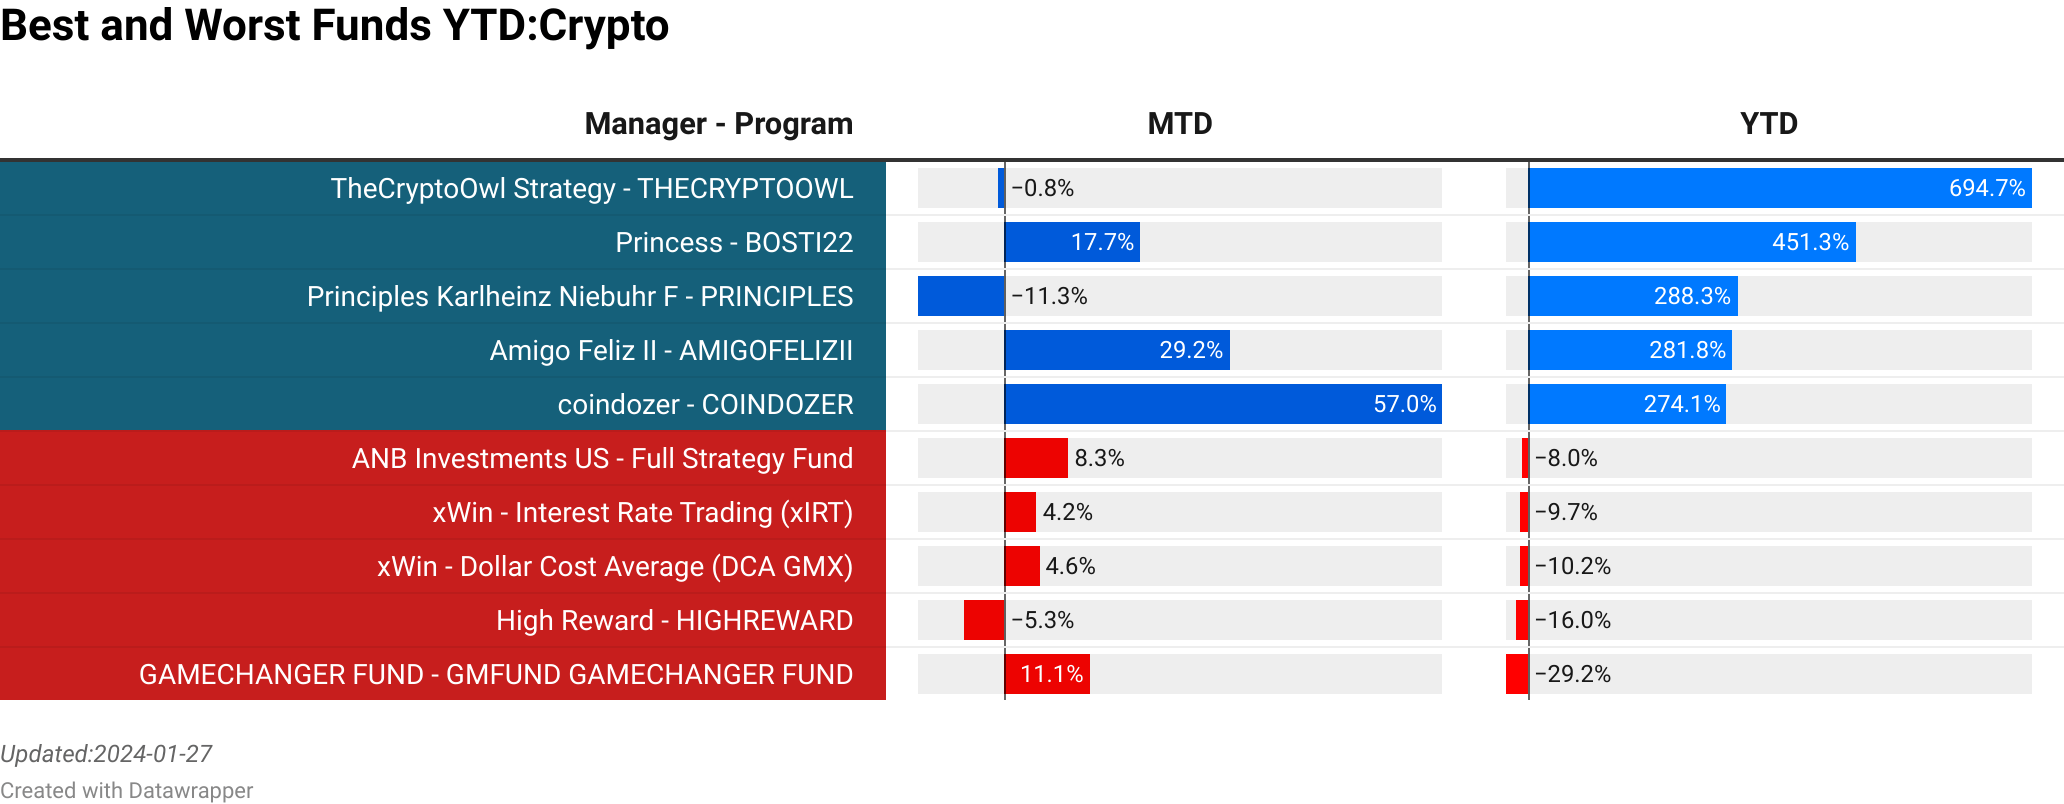
Based on the most recent return data that we have available, we can provide a comprehensive overview of the top-performing and bottom-performing strategies for each category, taking into account both monthly and yearly results. Our analysis is based on proprietary composite data streams that we have compiled, but we must note that there is always the possibility of errors or inaccuracies in our calculations.

CTA

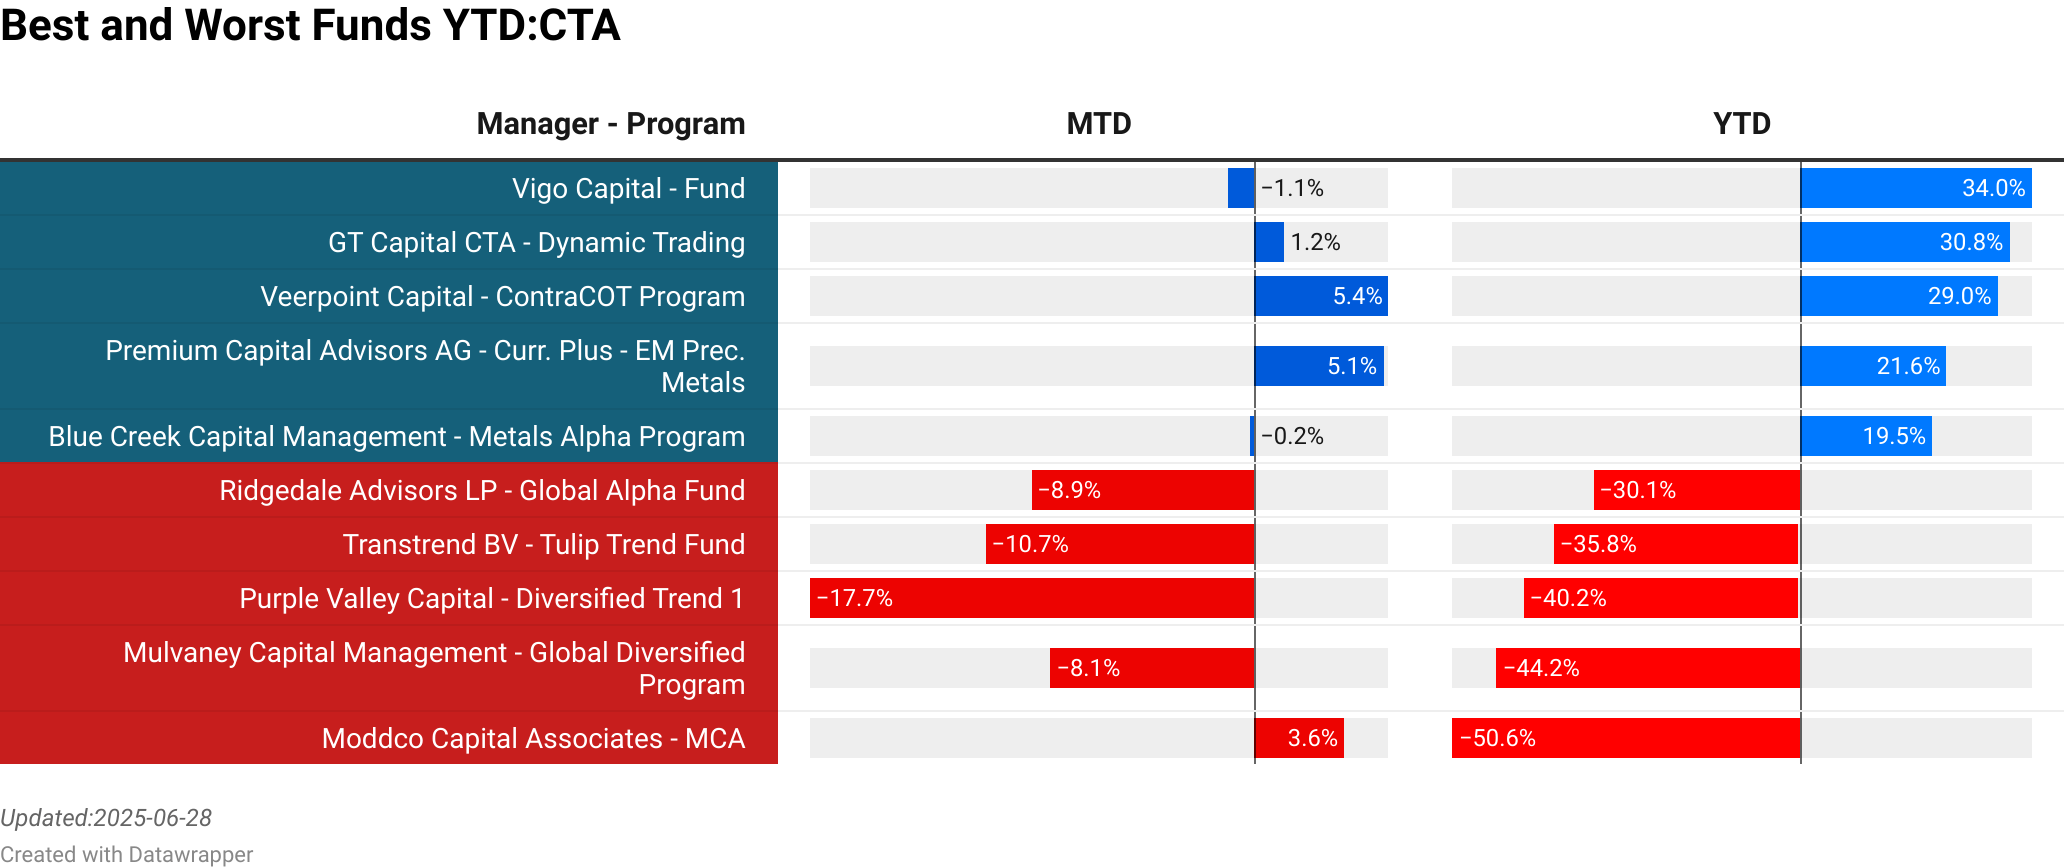
Comhla : Artemis  :  18.52% [0.36]<br> ABR : Enhanced Short Volatility  :  12.62% [0.90]<br> Atlas : Global Macro  :  11.65% [282.00]<br> ABR : 50/50 Volatility Investor  :  10.21% [0.00]<br> ABR : Dynamic Short Volatility Fund  :  10.19% [0.00]<br> PGM Asset Management : PGM Trident Program  :  -10.35% [5.40]<br> Transtrend BV : Tulip Trend Fund  :  -10.71% [89.28]<br> Eagle Trading Systems : Eagle Risk Allocation  :  -12.01% [220.00]<br> QTS Capital Management : Tail Reaper  :  -12.32% [0.67]<br> Purple Valley Capital : Diversified Trend 1  :  -17.72% [10.00]<br> >
Vigo Capital : Fund  :  -1.07% [1.74]<br> GT Capital CTA : Dynamic Trading  :  1.21% [0.09]<br> Veerpoint Capital : ContraCOT Program  :  5.37% [0.08]<br> Premium Capital Advisors AG : Curr. Plus - EM Prec. Metals  :  5.15% [188.00]<br> Blue Creek Capital Management : Metals Alpha Program  :  -0.16% [40.00]<br> Ridgedale Advisors LP : Global Alpha Fund  :  -8.89% [59.00]<br> Transtrend BV : Tulip Trend Fund  :  -10.71% [89.28]<br> Purple Valley Capital : Diversified Trend 1  :  -17.72% [10.00]<br> Mulvaney Capital Management : Global Diversified Program  :  -8.12% [158.00]<br> Moddco Capital Associates : MCA  :  3.59% [0.05]<br> >

To explore the full list of CTAs and their rankings, including dynamic updates as new data becomes available, we invite you to visit our website at the Link provided.

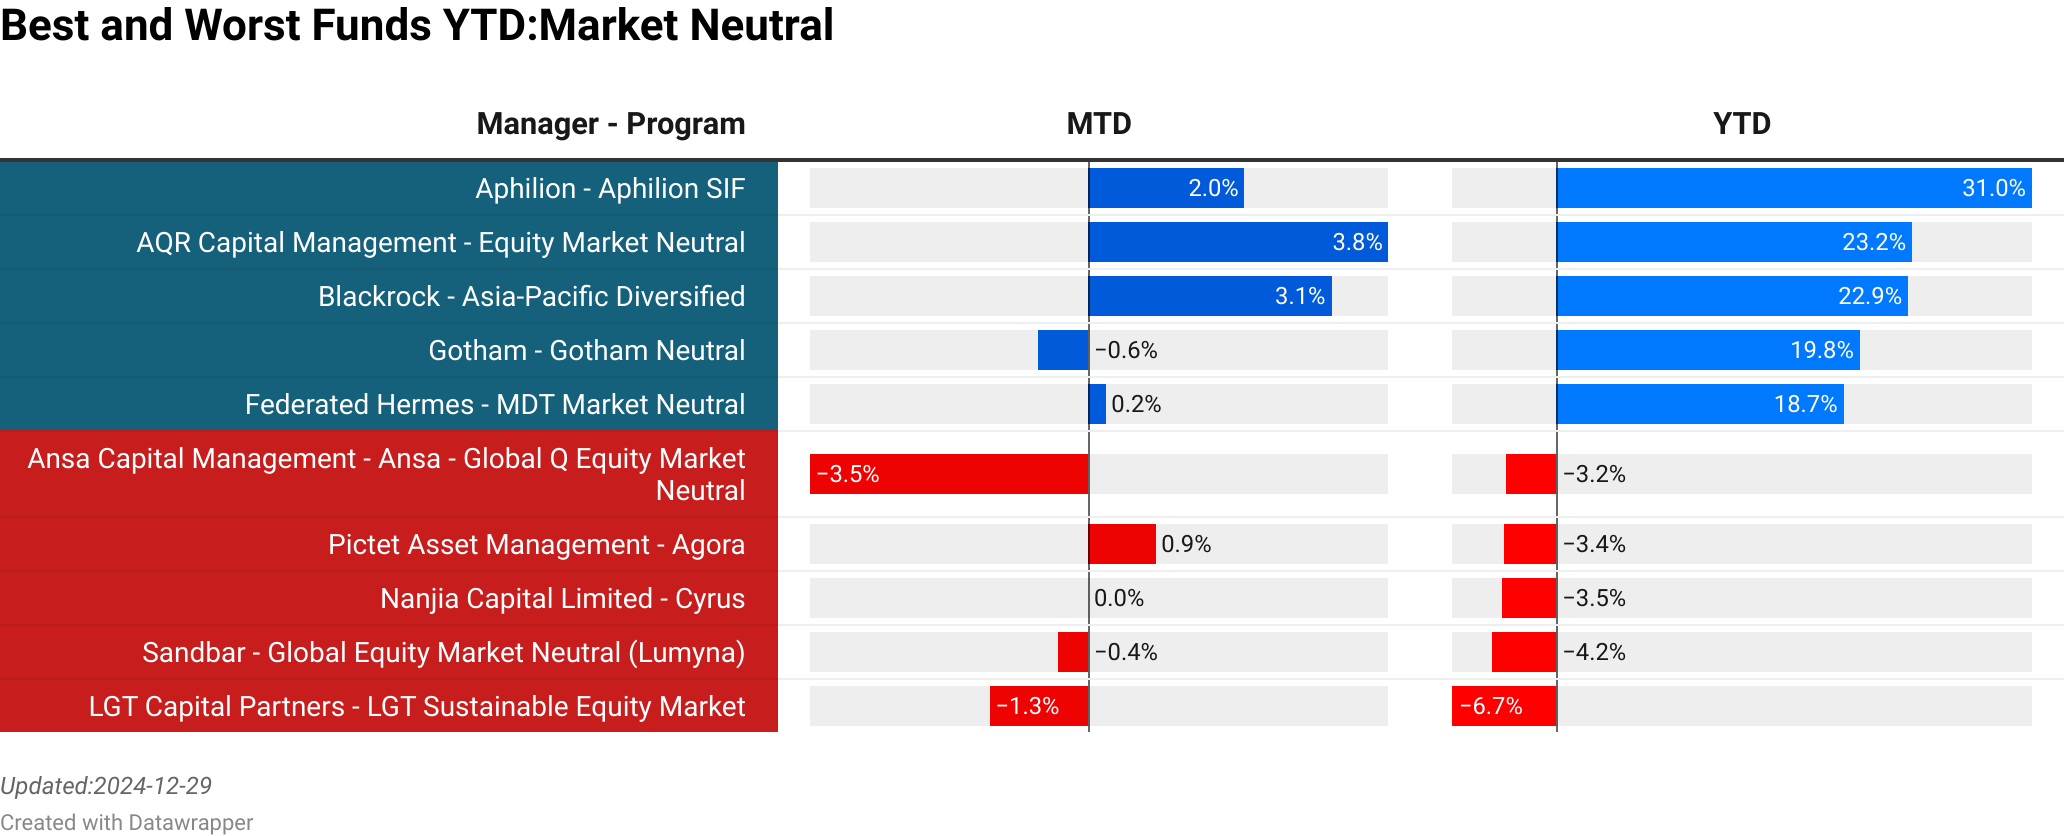
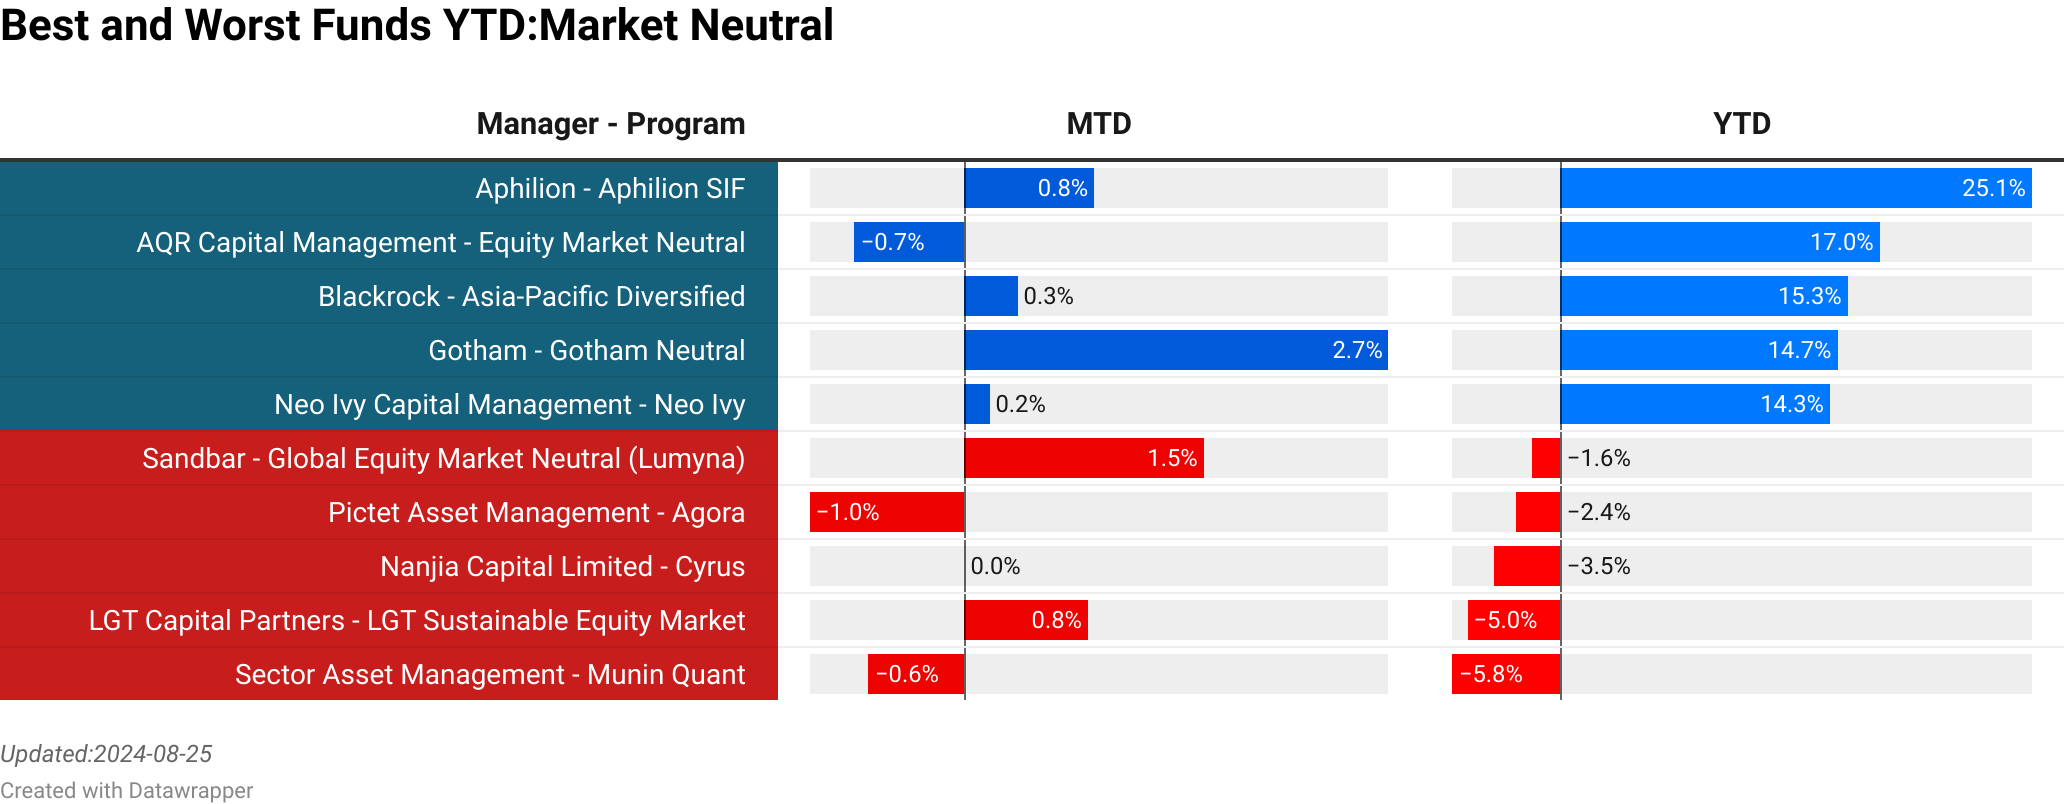
Market Neutral

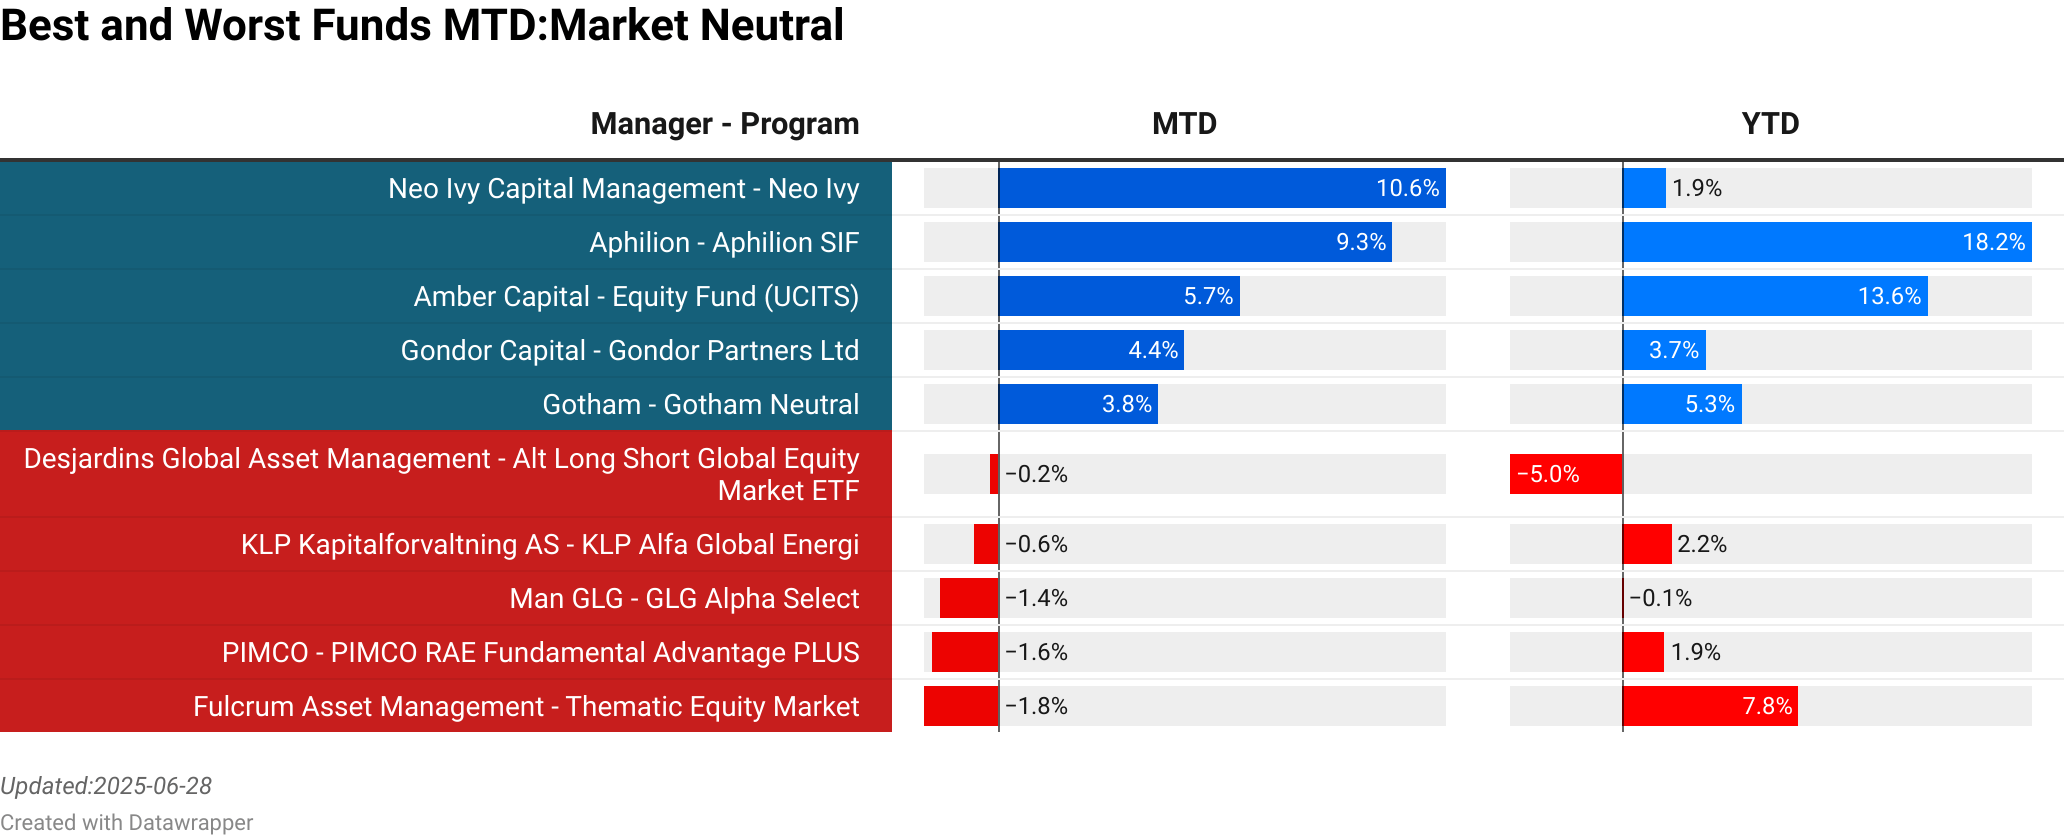
Neo Ivy Capital Management : Neo Ivy  :  10.60% [0.00]<br> Amber Capital : Equity Fund (UCITS)  :  5.72% [37.97]<br> Gondor Capital : Gondor Partners Ltd  :  4.42% [12.00]<br> Gotham : Gotham Neutral  :  3.79% [0.00]<br> Exane : Ceres  :  3.38% [156.99]<br> Desjardins Global Asset Management : Alt Long Short Global Equity Market ETF  :  -0.20% [28.82]<br> KLP Kapitalforvaltning AS : KLP Alfa Global Energi  :  -0.58% [0.20]<br> Man GLG : GLG Alpha Select  :  -1.37% [1594.60]<br> PIMCO : PIMCO RAE Fundamental Advantage PLUS  :  -1.56% [0.00]<br> Fulcrum Asset Management : Thematic Equity Market  :  -1.76% [423.94]<br> >
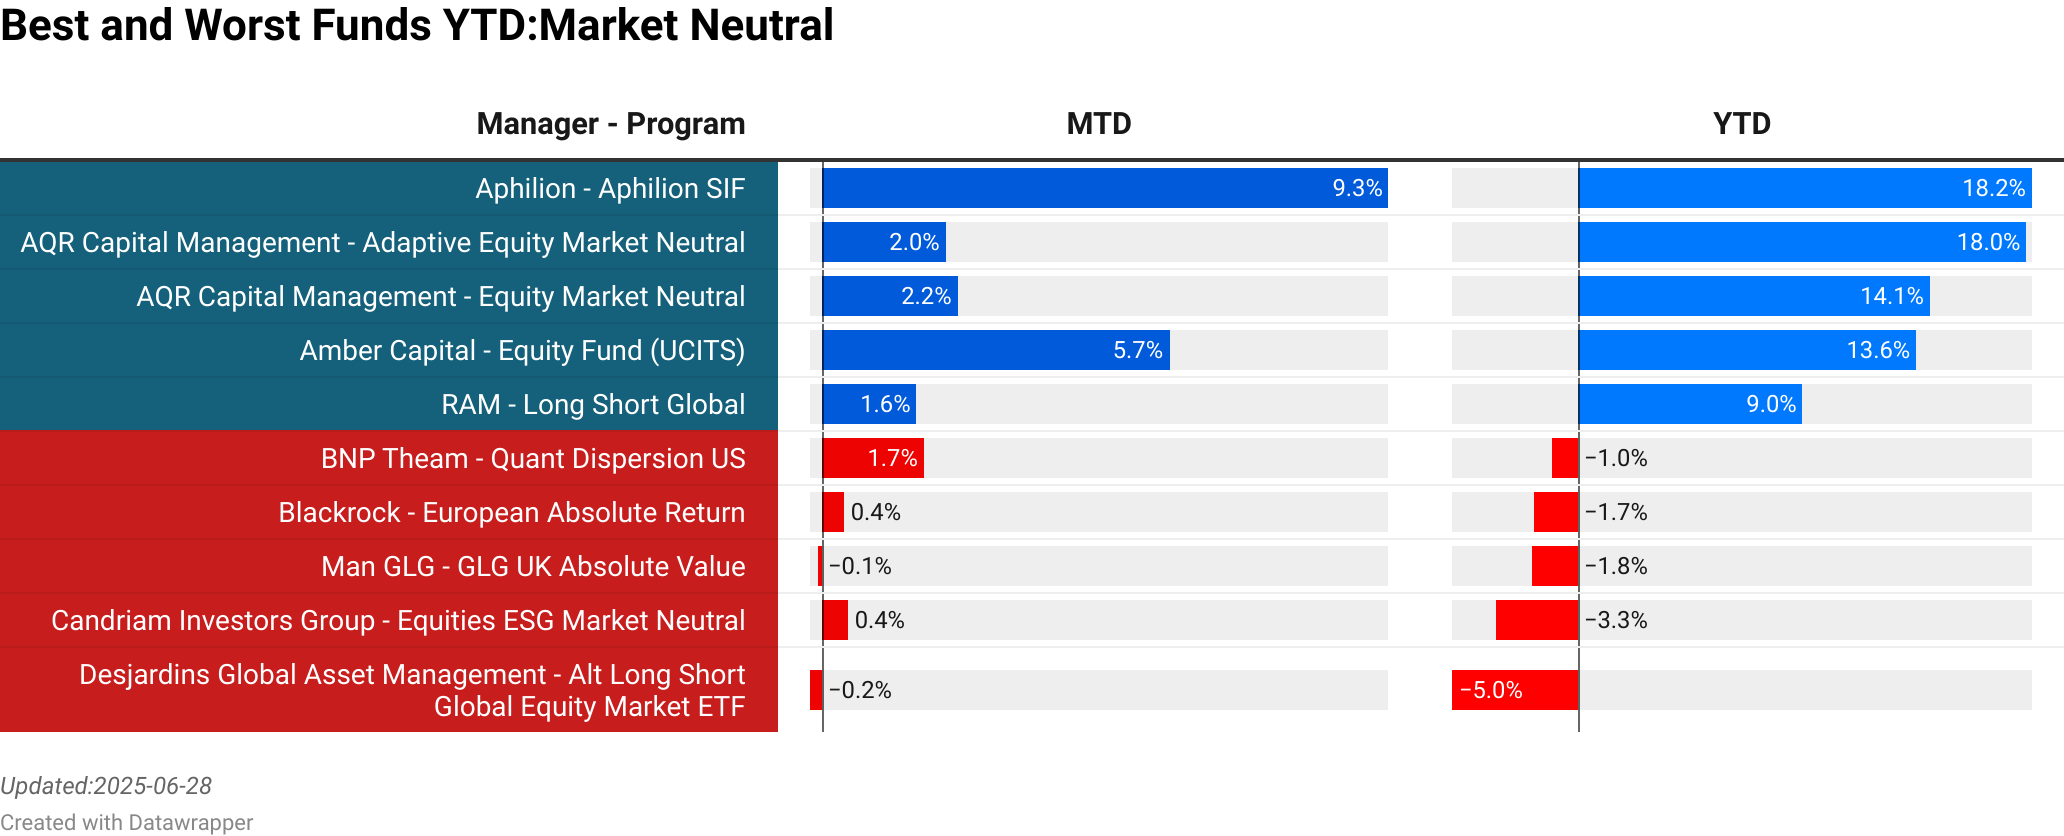
AQR Capital Management : Adaptive Equity Market Neutral  :  2.04% [711.81]<br> AQR Capital Management : Equity Market Neutral  :  2.23% [1840.00]<br> Amber Capital : Equity Fund (UCITS)  :  5.72% [37.97]<br> RAM : Long Short Global  :  1.56% [13.92]<br> Exane : Ceres  :  3.38% [156.99]<br> BNP Theam : Quant Dispersion US  :  1.68% [133.58]<br> Blackrock : European Absolute Return  :  0.37% [662.49]<br> Man GLG : GLG UK Absolute Value  :  -0.06% [463.54]<br> Candriam Investors Group : Equities ESG Market Neutral  :  0.44% [19.90]<br> Desjardins Global Asset Management : Alt Long Short Global Equity Market ETF  :  -0.20% [28.82]<br> >

To explore the full list of Market Neutral strategies and their rankings, including dynamic updates as new data becomes available, we invite you to visit our website at the Link provided.

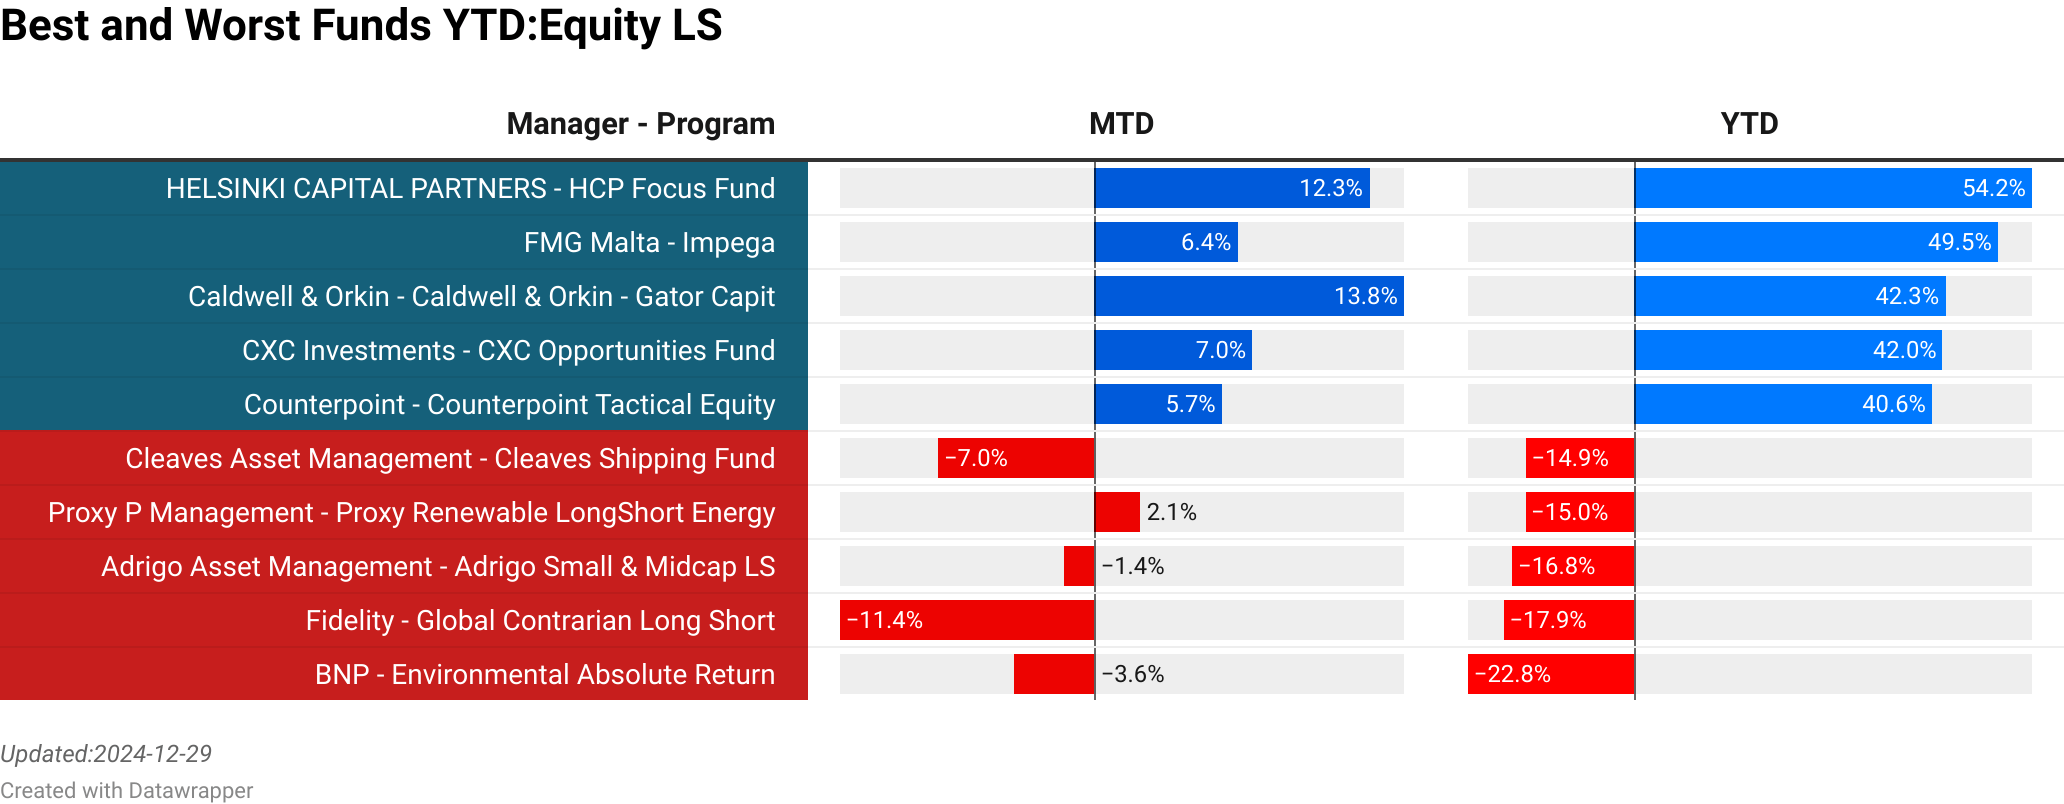
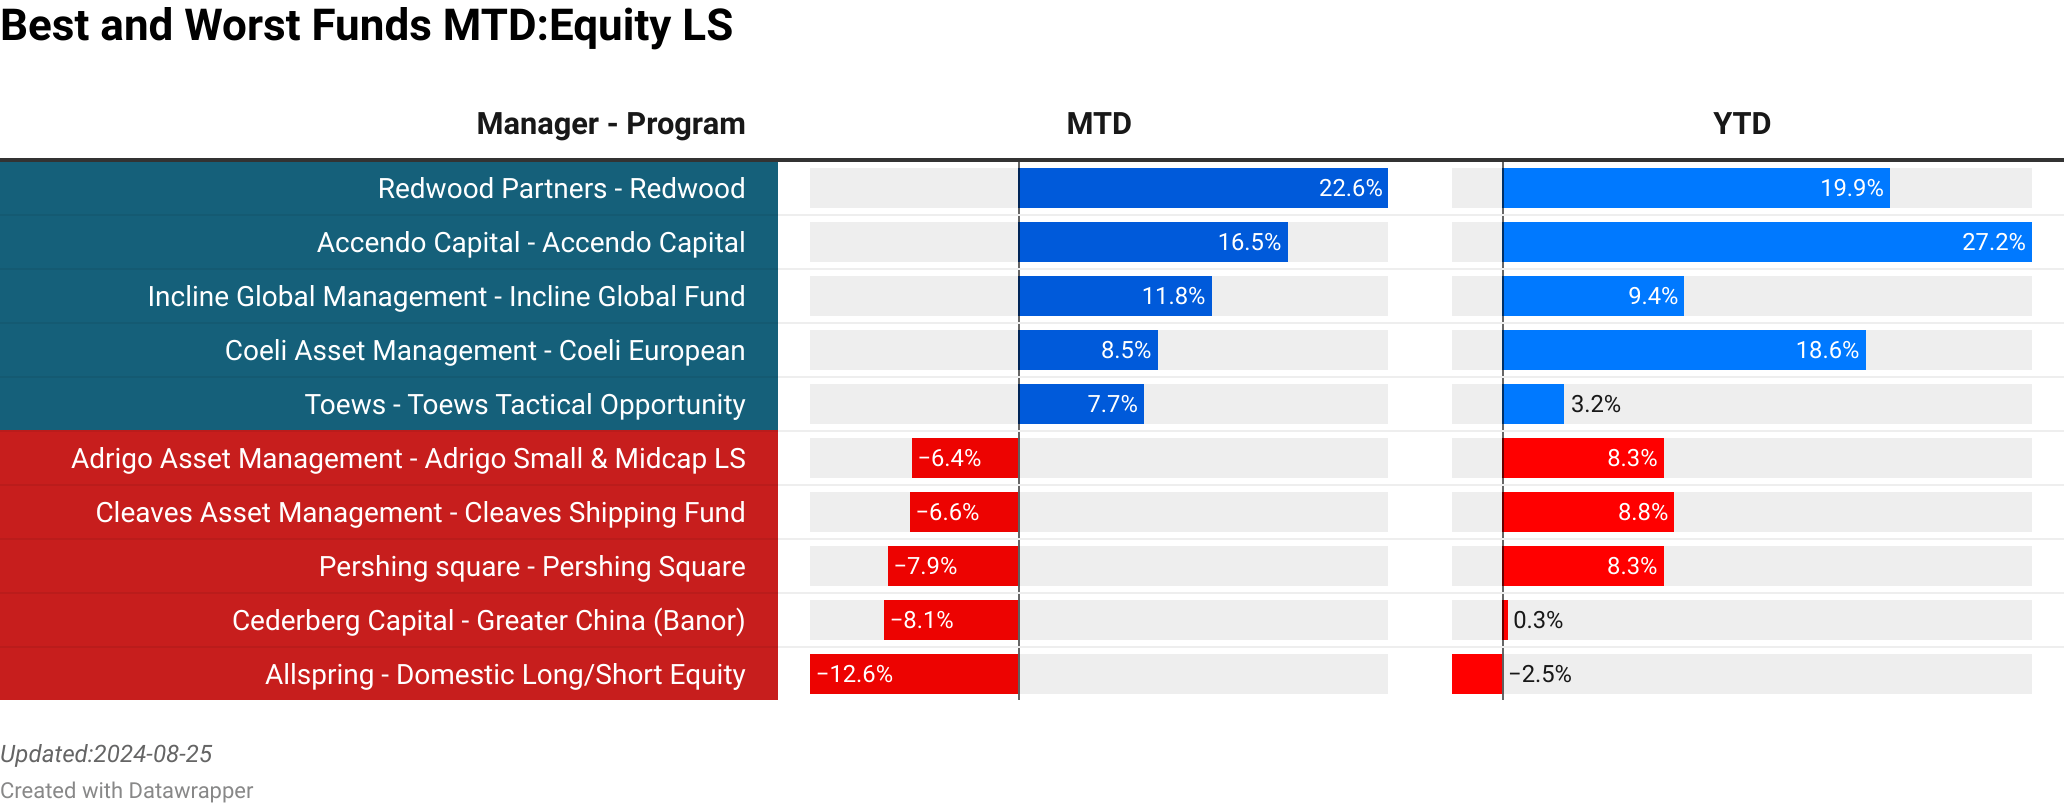
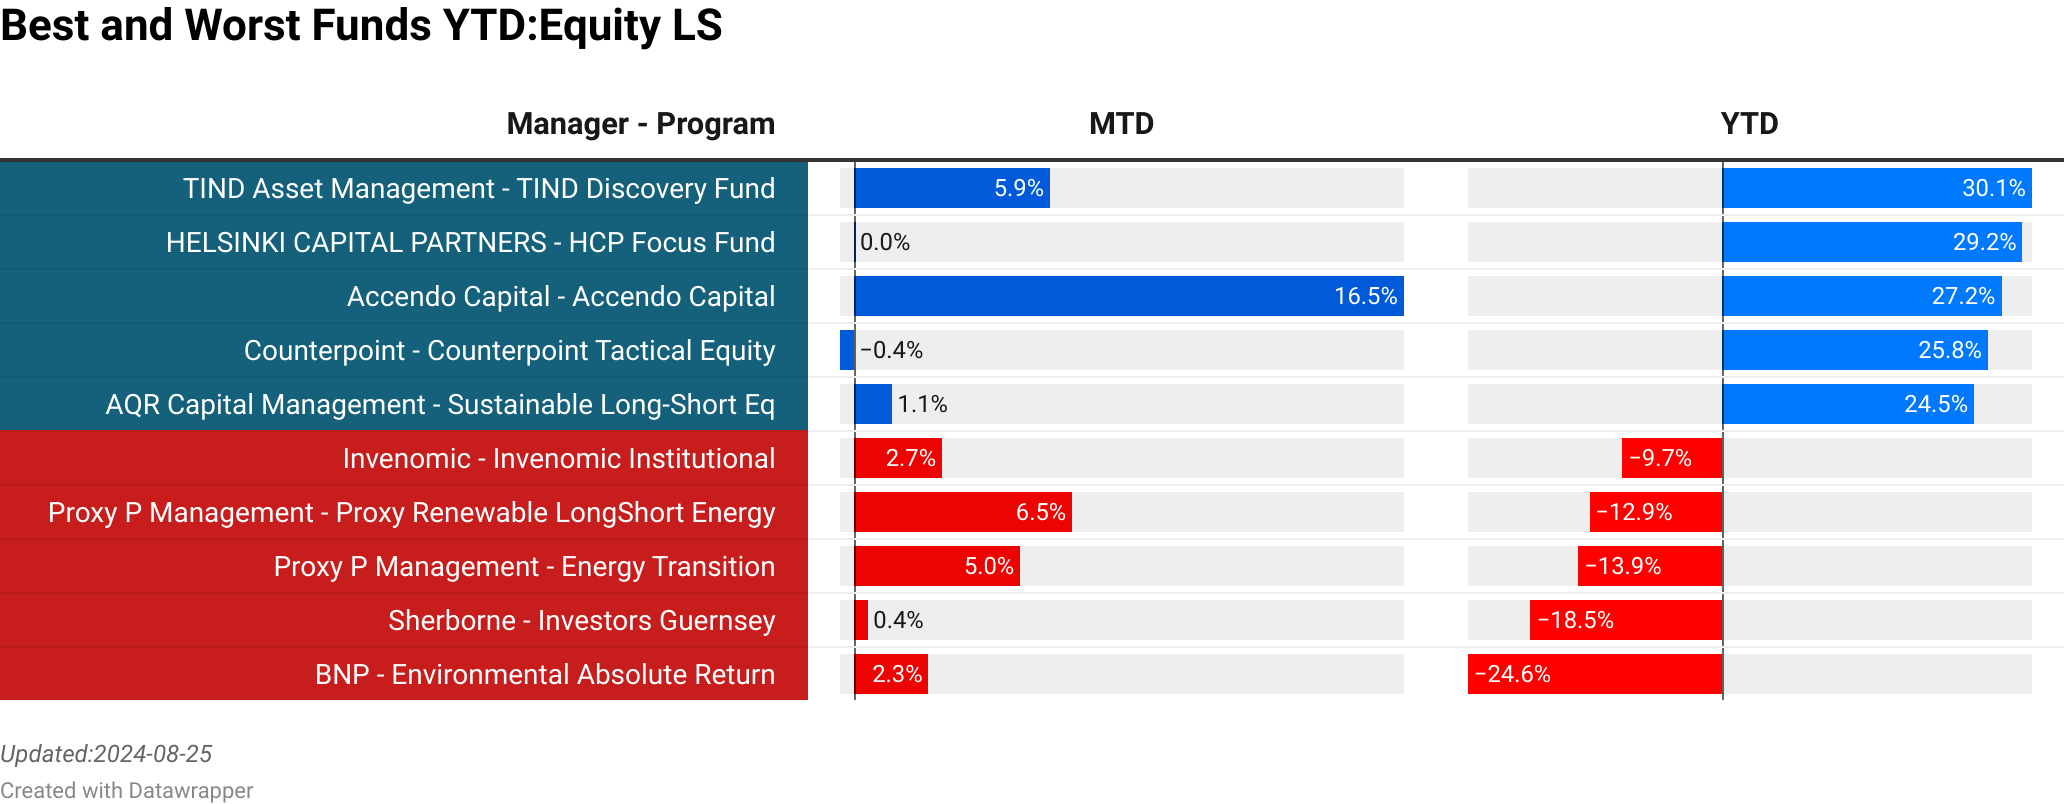
Equity Long Short

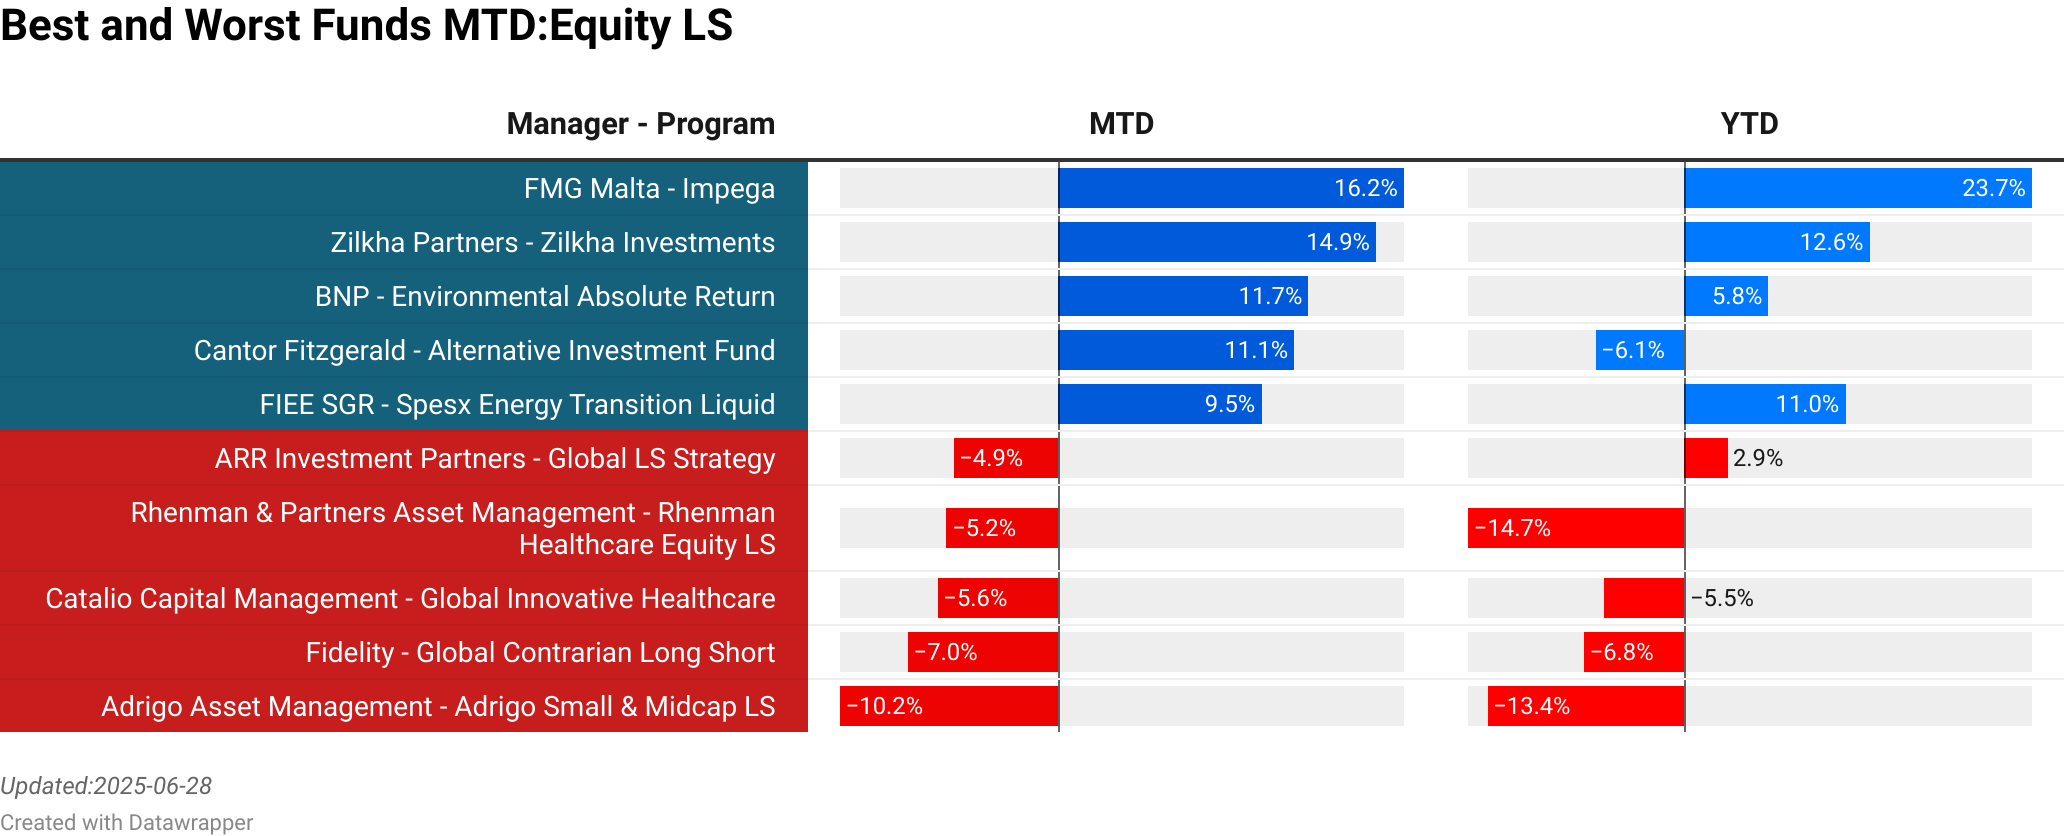
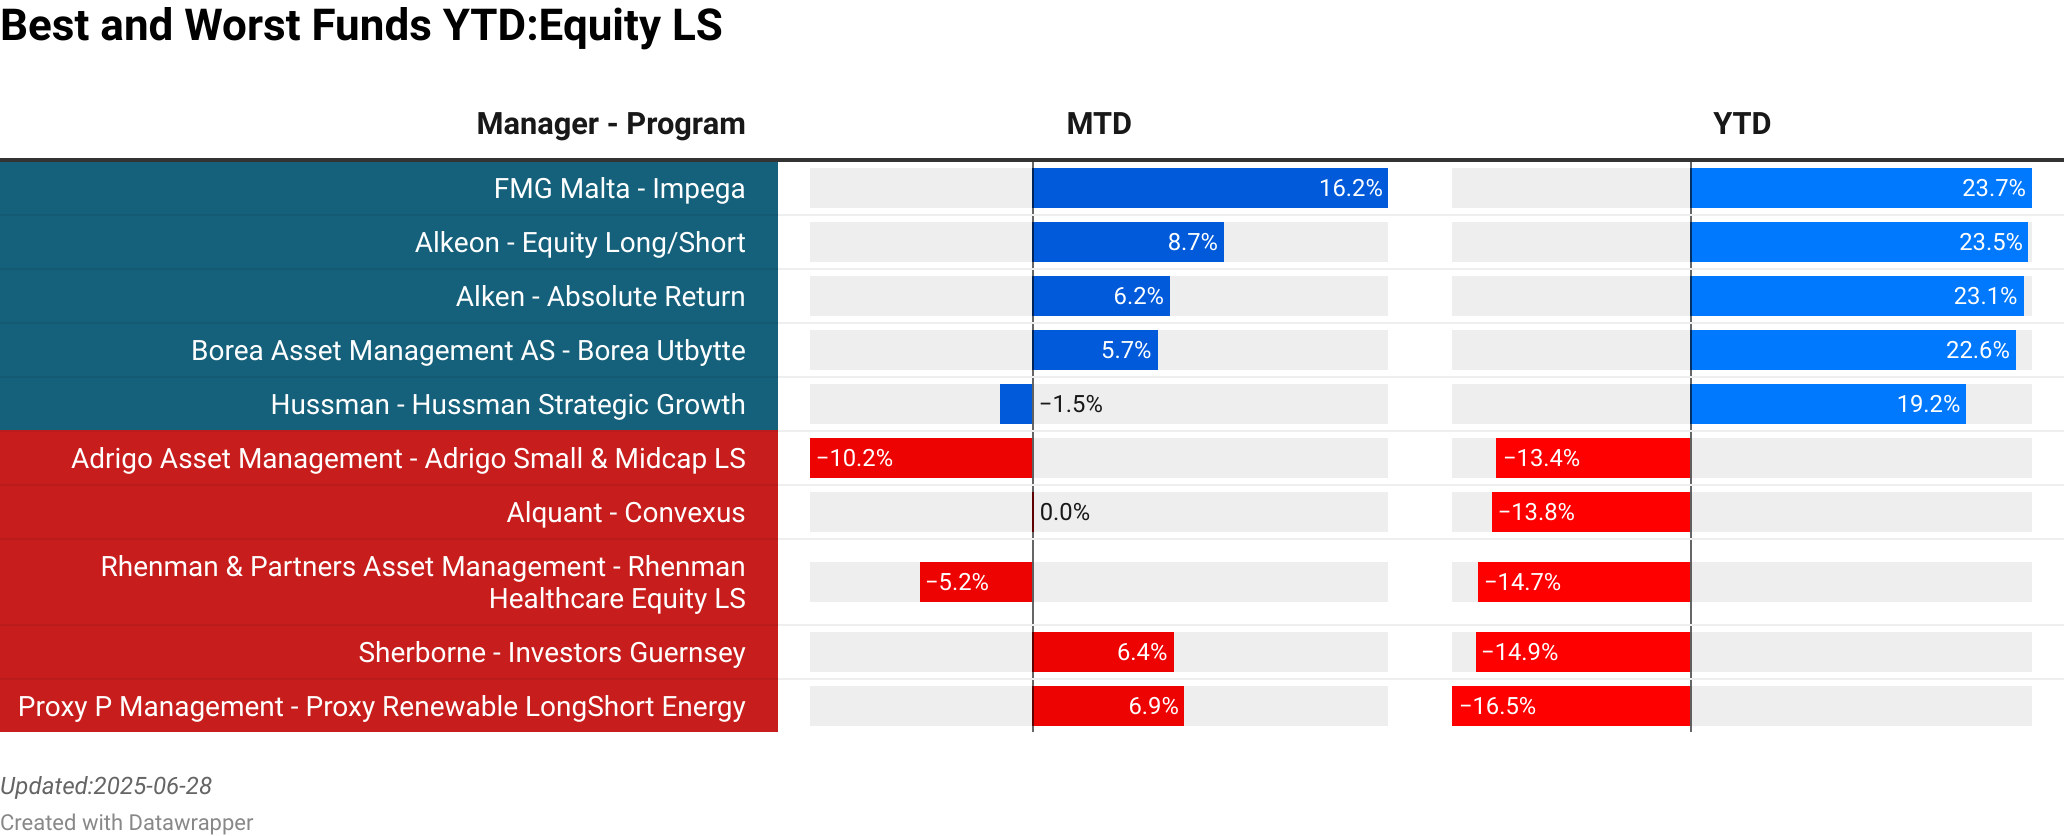
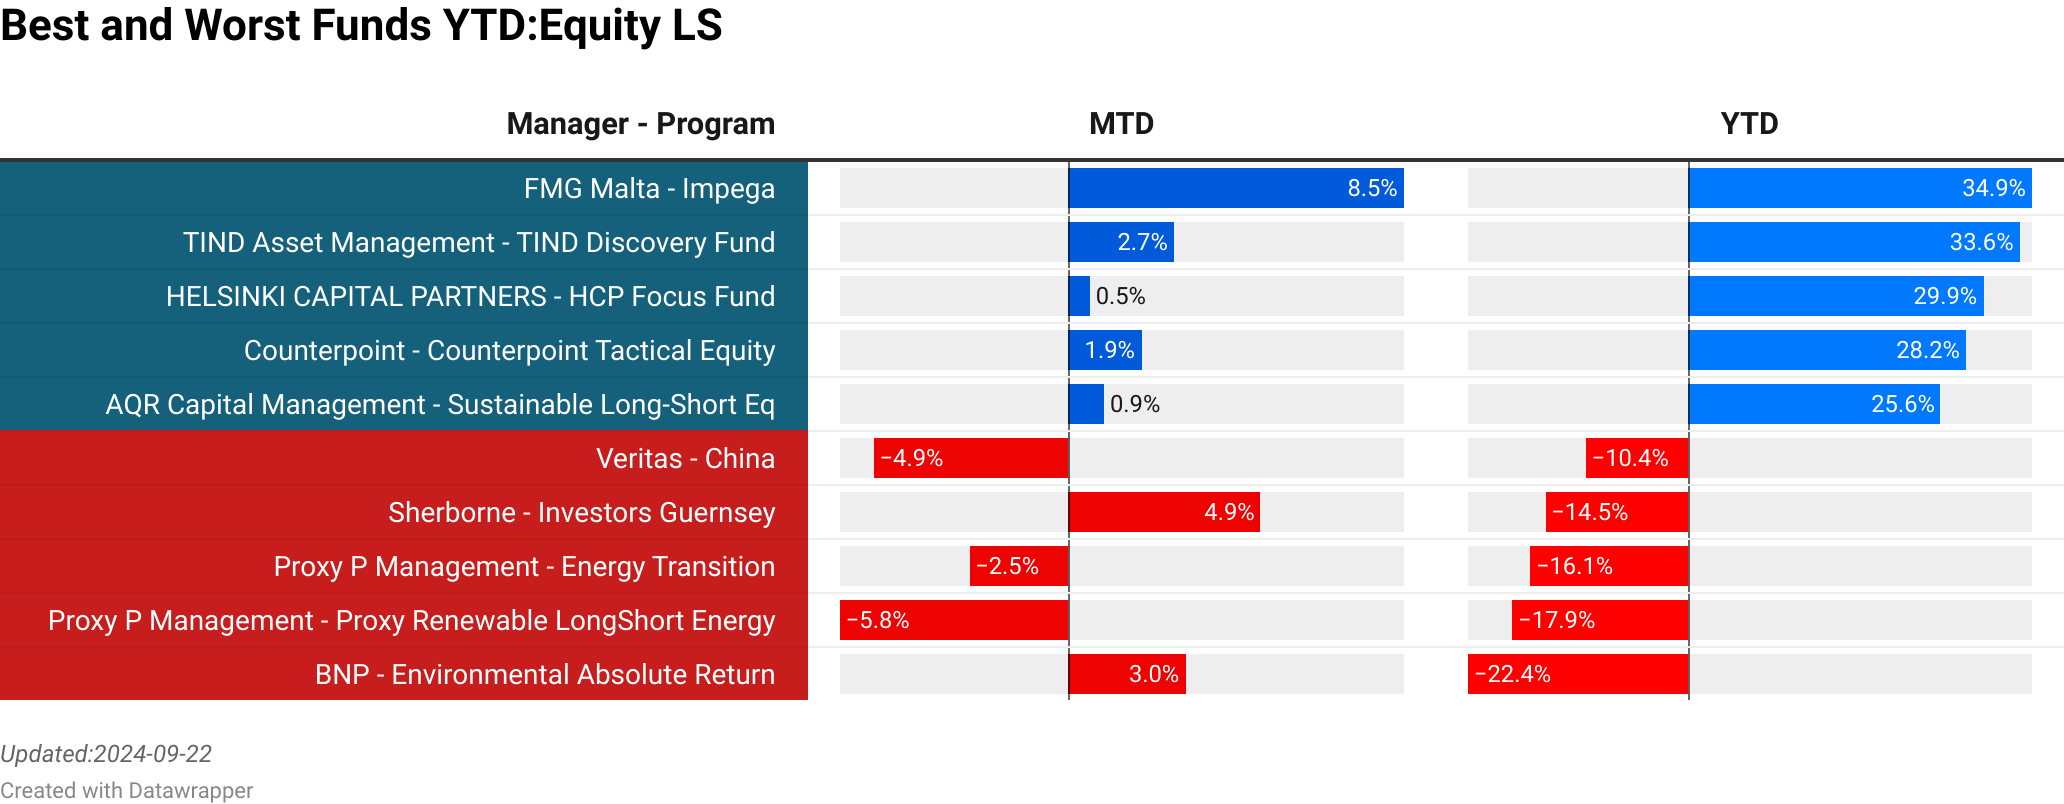
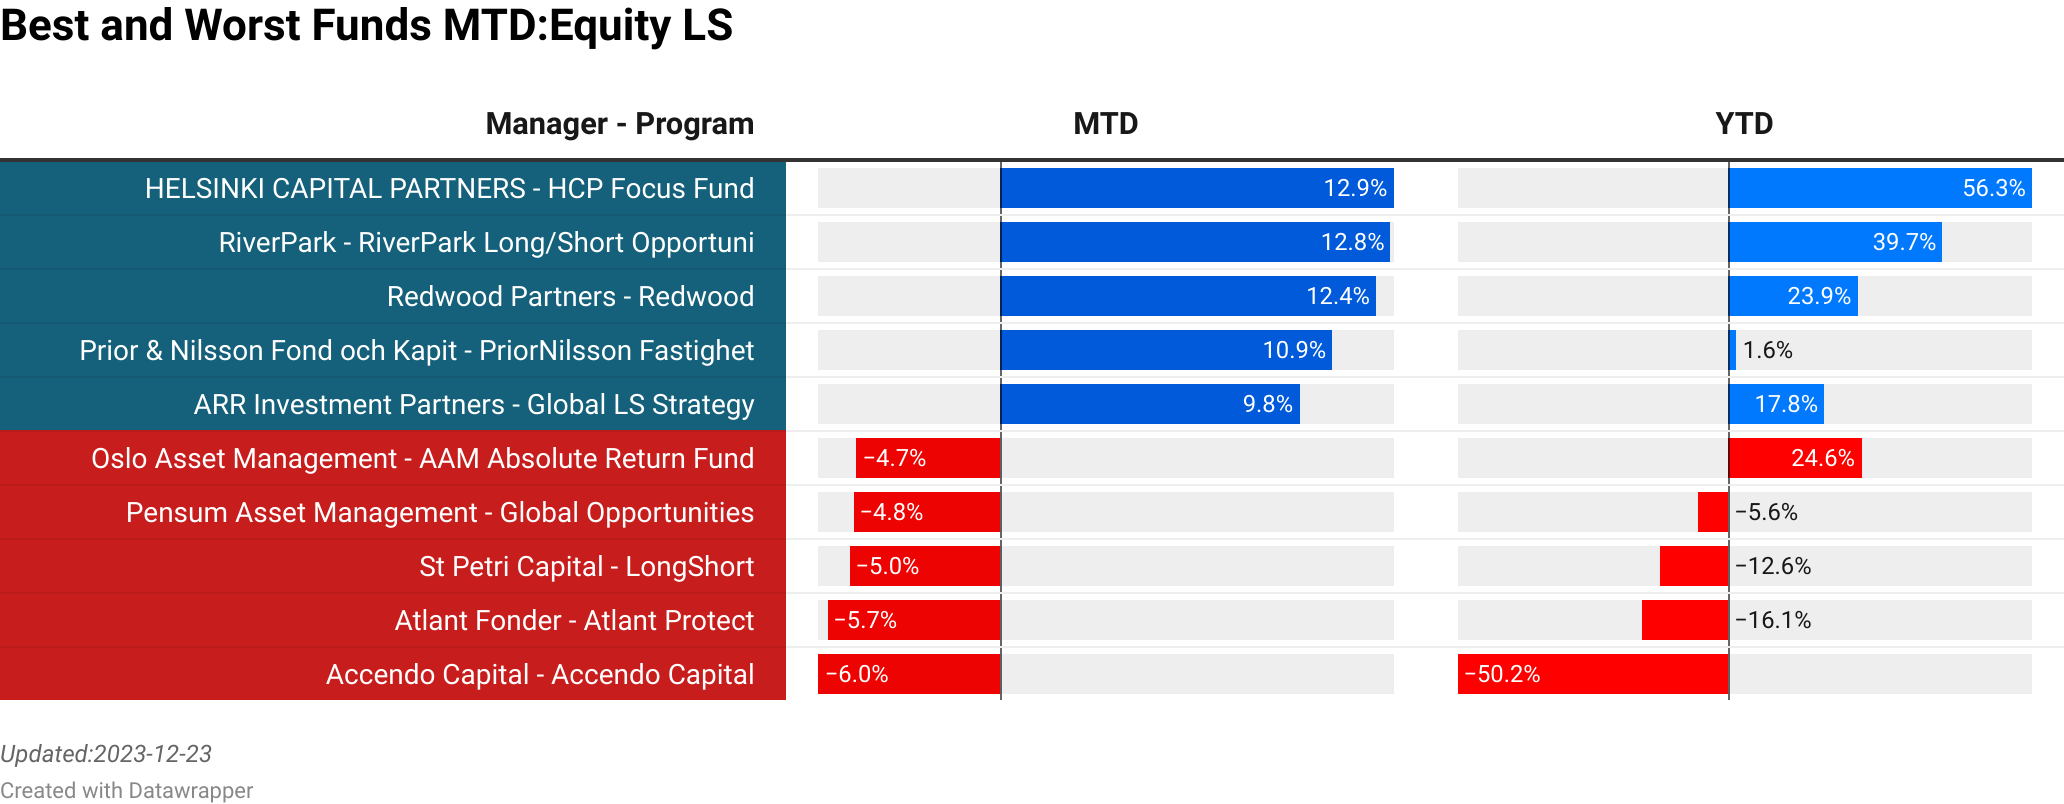
FMG Malta : Impega  :  16.20% [0.00]<br> Zilkha Partners : Zilkha Investments  :  14.90% [0.00]<br> BNP : Environmental Absolute Return  :  11.74% [8.46]<br> Cantor Fitzgerald : Alternative Investment Fund  :  11.08% [206.09]<br> FIEE SGR : Spesx Energy Transition Liquid  :  9.54% [29.46]<br> ARR Investment Partners : Global LS Strategy  :  -4.85% [36.31]<br> Rhenman & Partners Asset Management : Rhenman Healthcare Equity LS  :  -5.18% [700.80]<br> Catalio Capital Management : Global Innovative Healthcare  :  -5.59% [109.42]<br> Fidelity : Global Contrarian Long Short  :  -6.98% [10.45]<br> Adrigo Asset Management : Adrigo Small  & Midcap LS  :  -10.15% [20.20]<br> >
FMG Malta : Impega  :  16.20% [0.00]<br> Alkeon : Equity Long/Short  :  8.70% [22.40]<br> Alken : Absolute Return  :  6.24% [72.85]<br> Borea Asset Management AS : Borea Utbytte  :  5.67% [0.30]<br> Hussman : Hussman Strategic Growth  :  -1.50% [0.00]<br> Adrigo Asset Management : Adrigo Small  & Midcap LS  :  -10.15% [20.20]<br> Alquant : Convexus  :  0.04% [11.72]<br> Rhenman & Partners Asset Management : Rhenman Healthcare Equity LS  :  -5.18% [700.80]<br> Sherborne : Investors Guernsey  :  6.39% [0.00]<br> Proxy P Management : Proxy Renewable LongShort Energy  :  6.92% [0.00]<br> >

To explore the full list of Equity Long Short strategies and their rankings, including dynamic updates as new data becomes available, we invite you to visit our website at the Link provided.

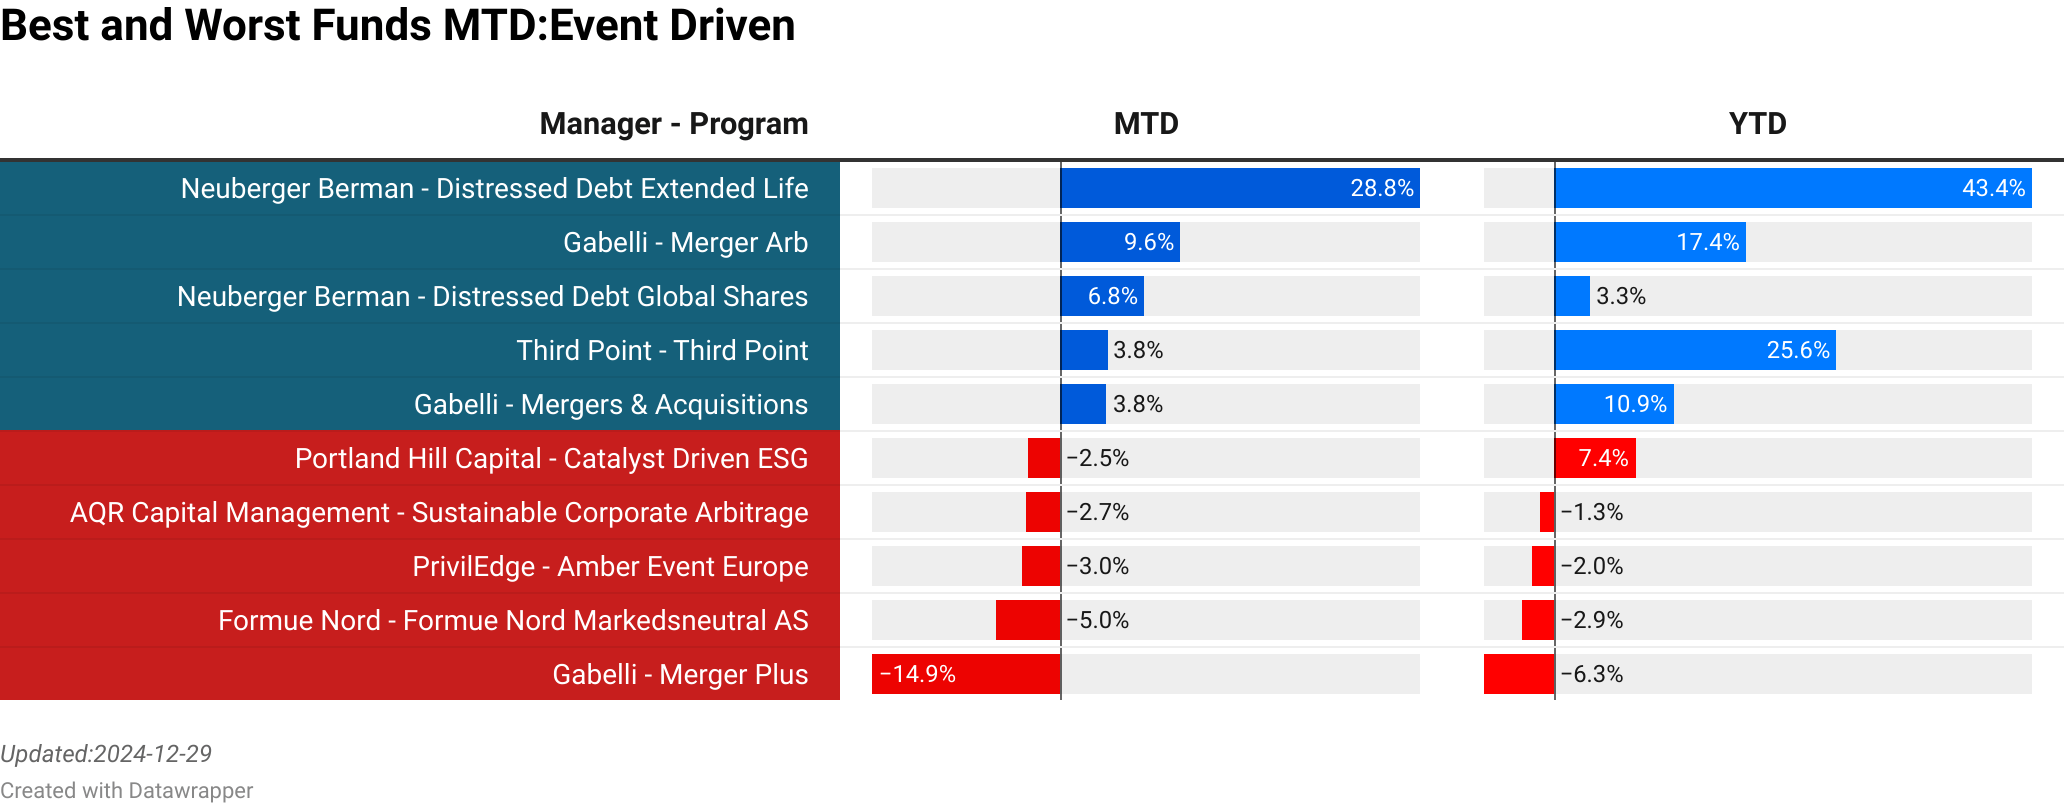
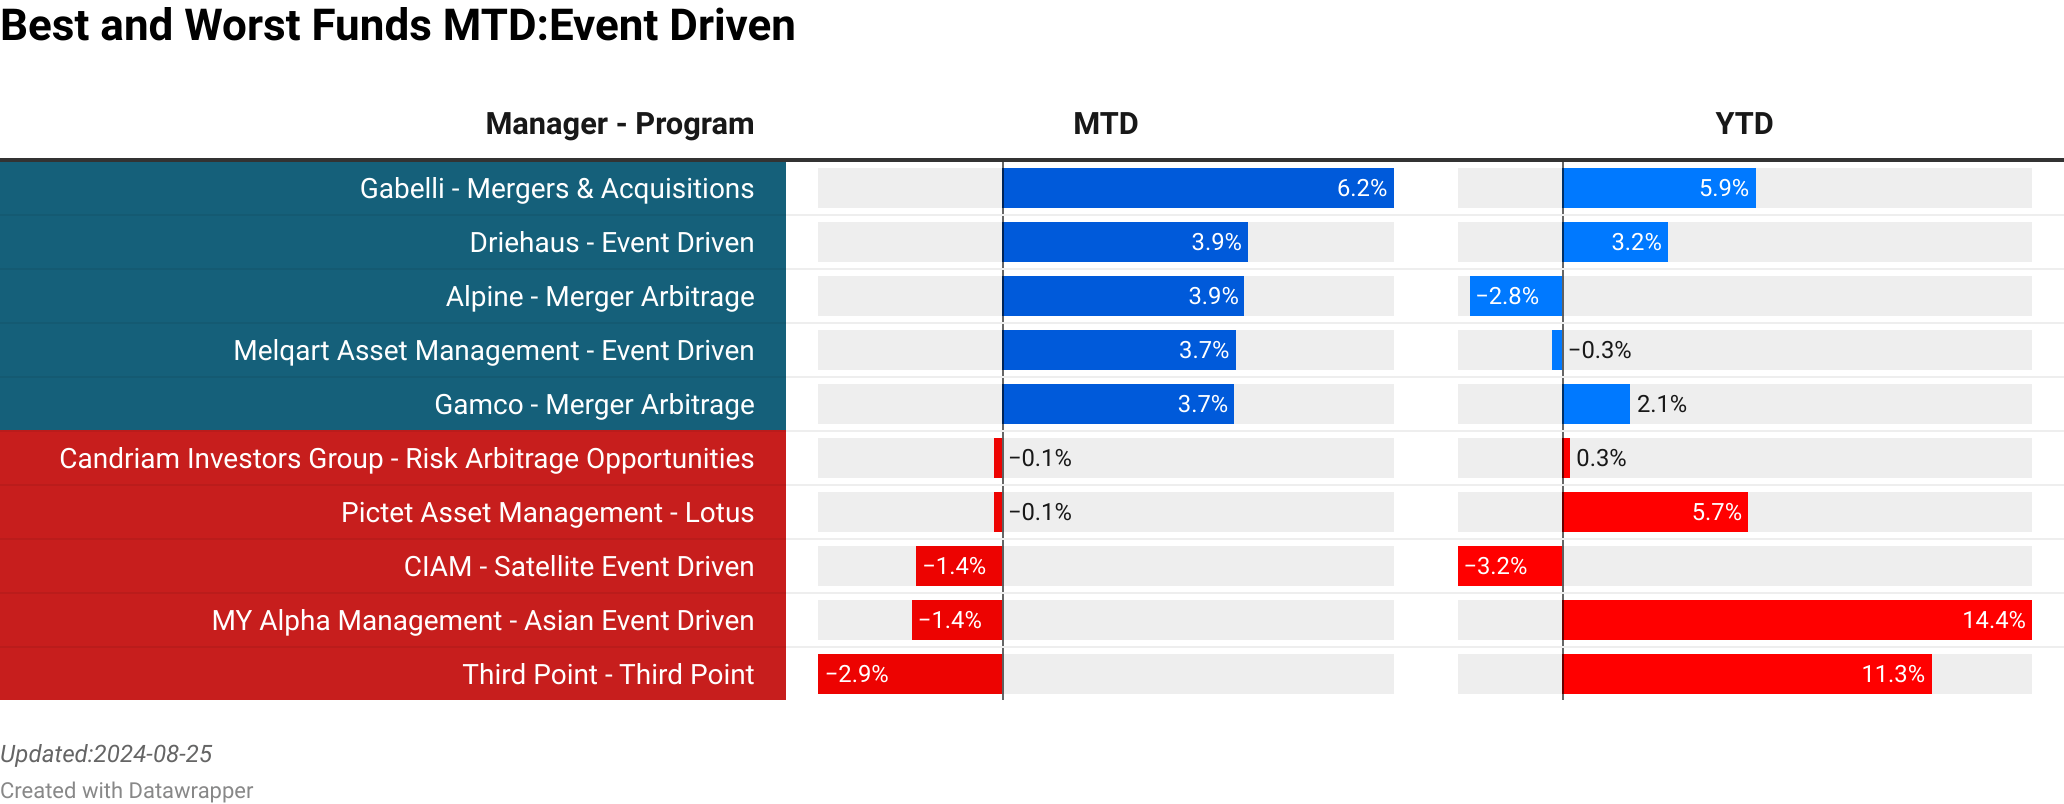
Event Driven

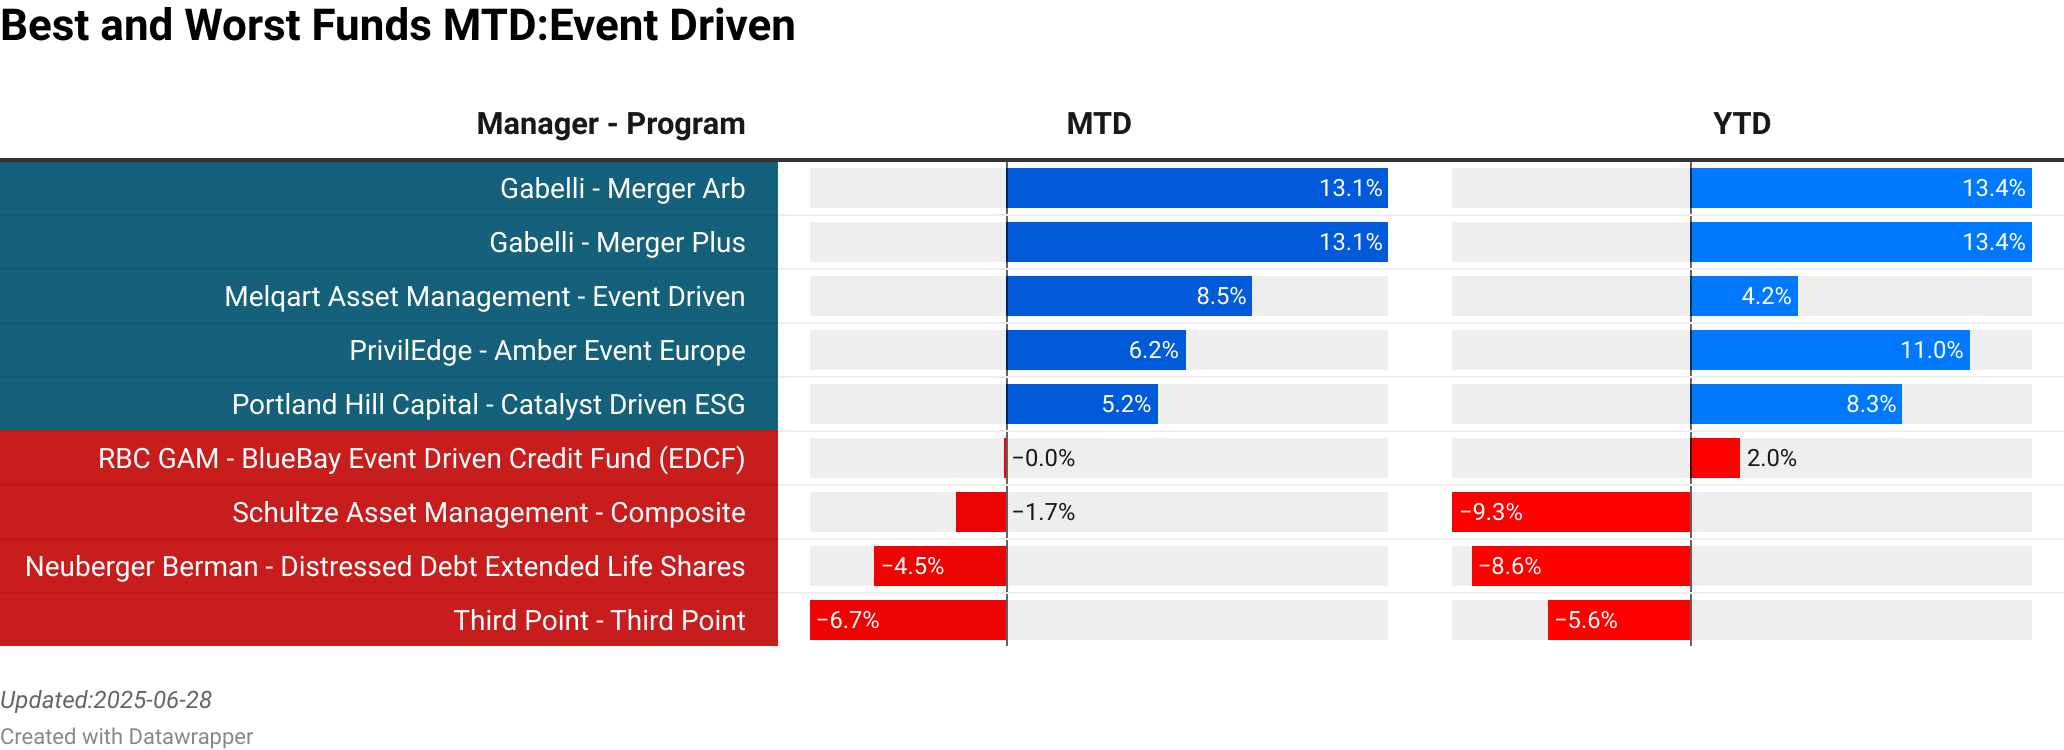
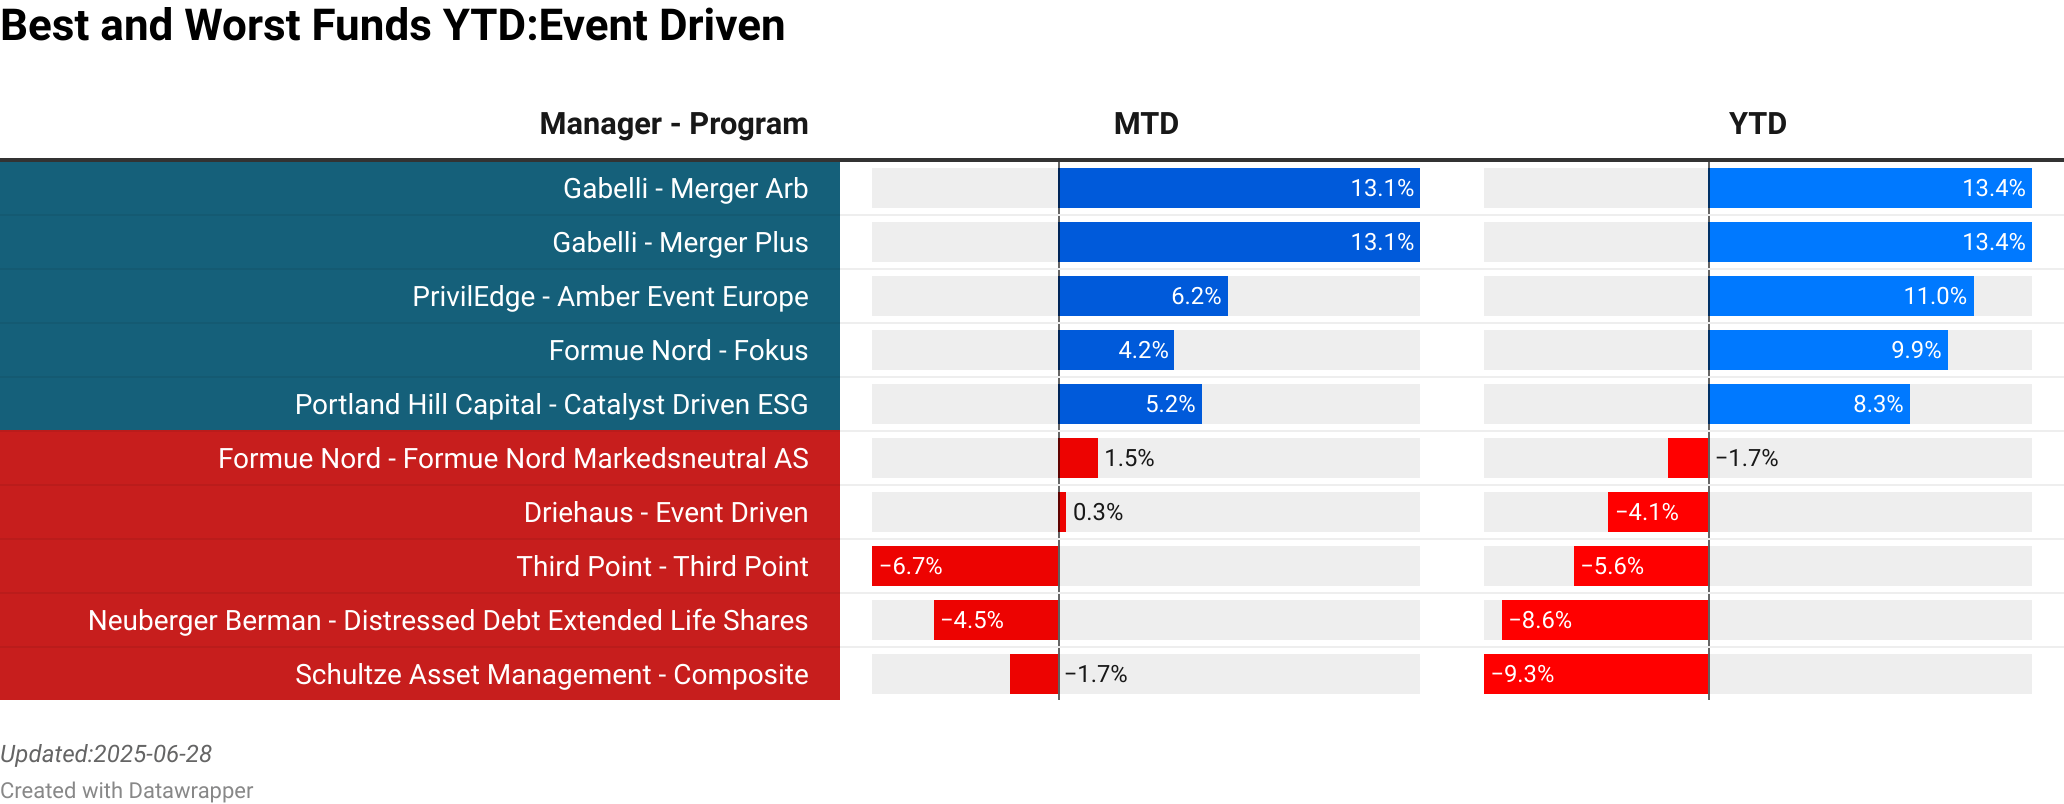
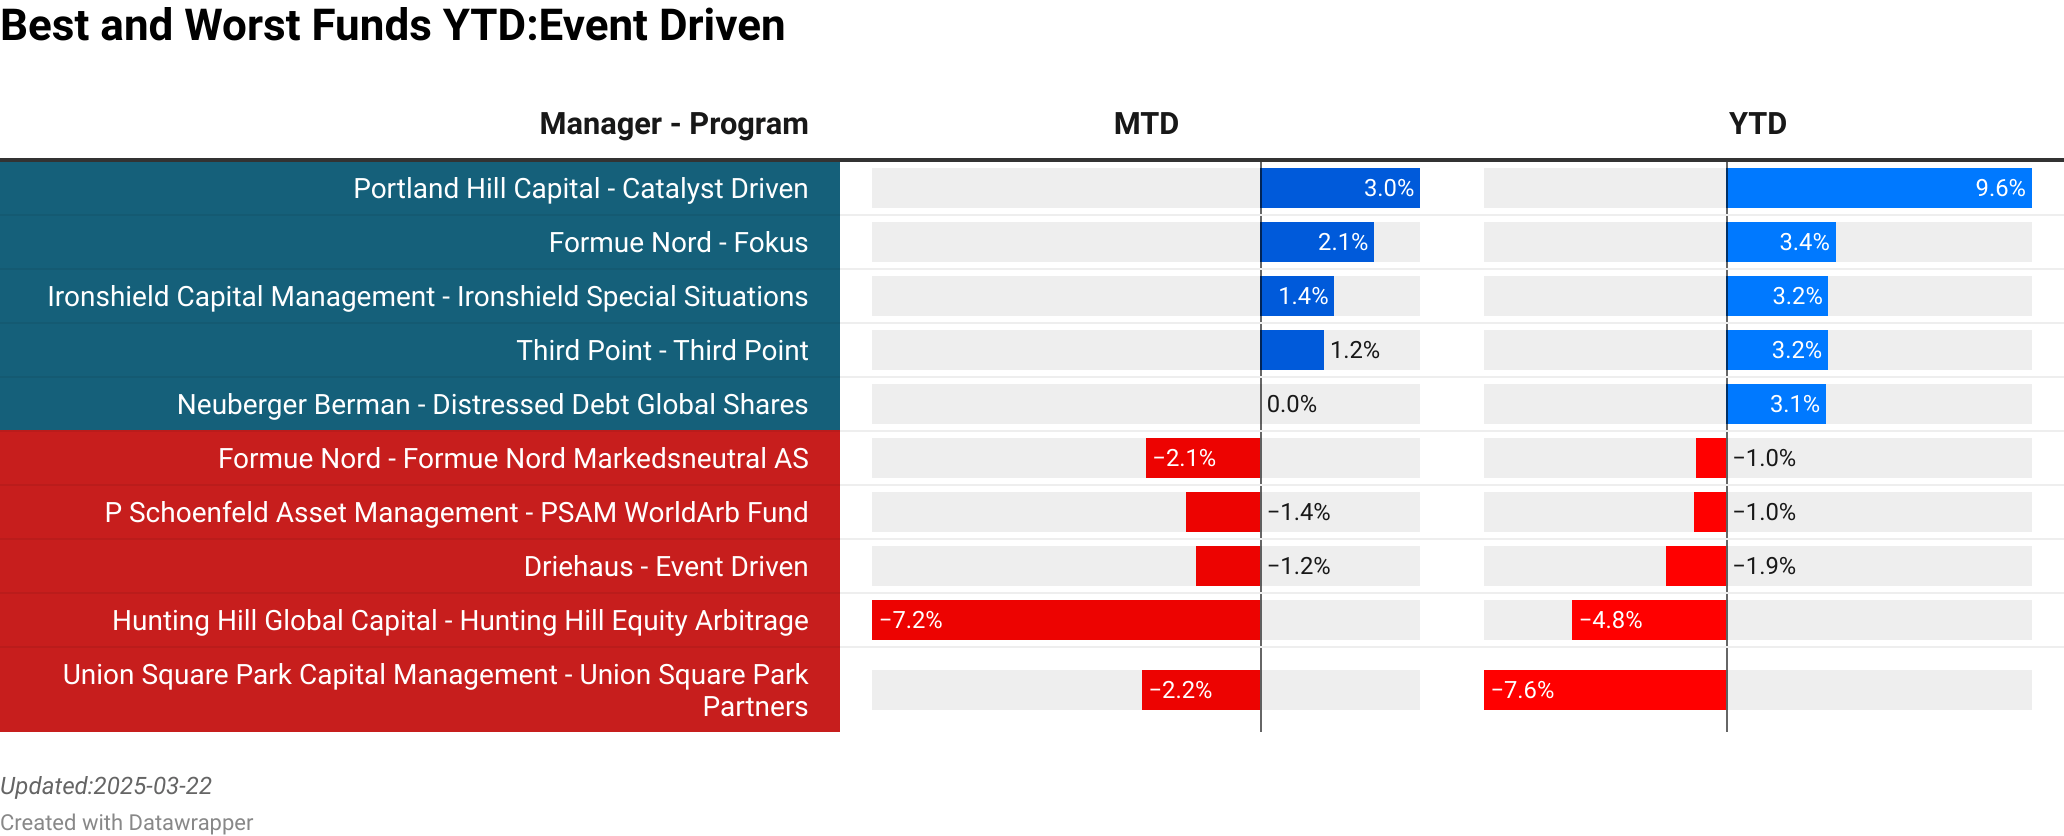
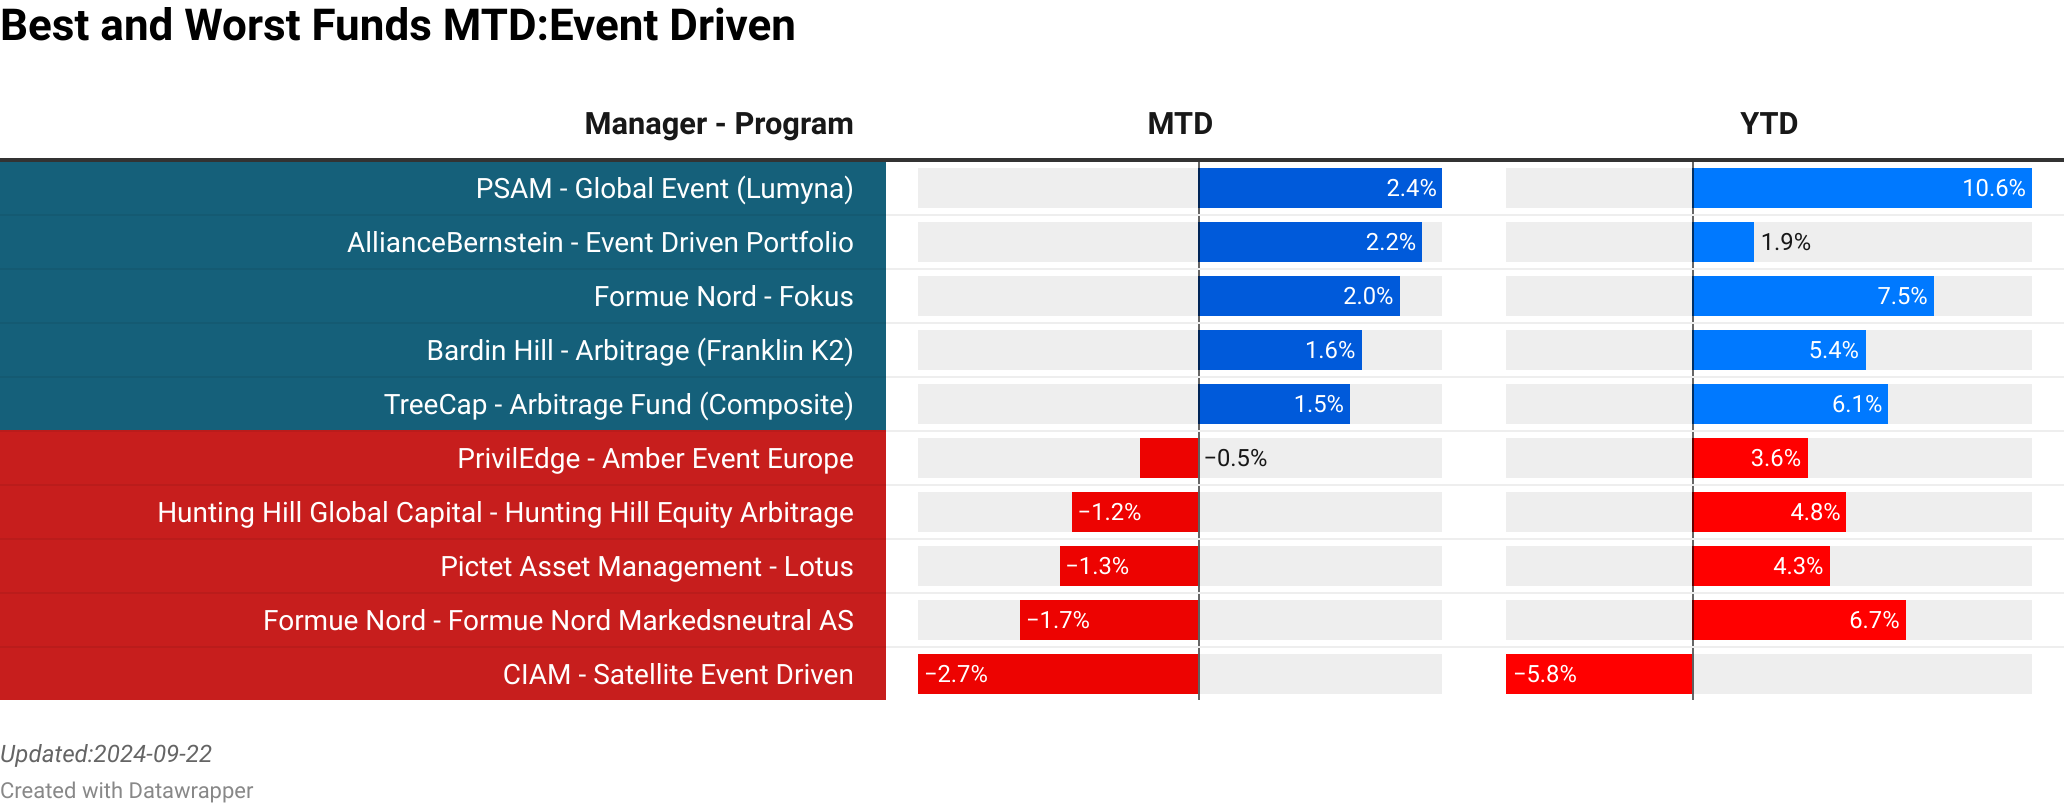
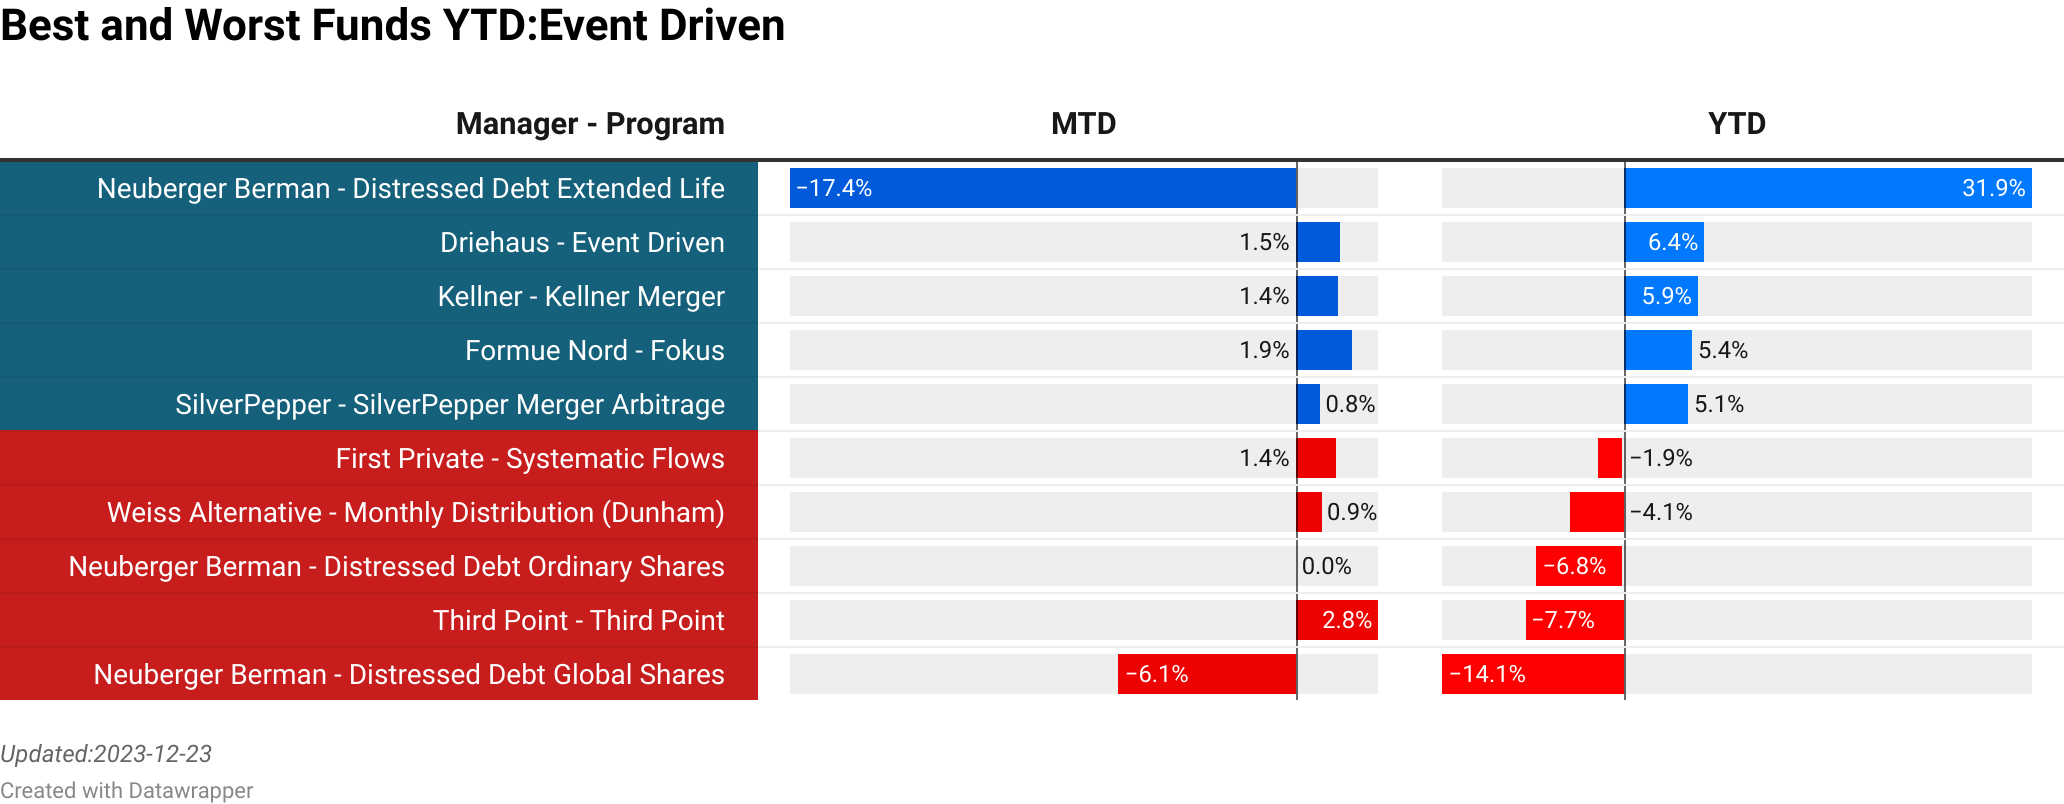
FMG Malta : Impega  :  16.20% [0.00]<br> Zilkha Partners : Zilkha Investments  :  14.90% [0.00]<br> BNP : Environmental Absolute Return  :  11.74% [8.46]<br> Cantor Fitzgerald : Alternative Investment Fund  :  11.08% [206.09]<br> FIEE SGR : Spesx Energy Transition Liquid  :  9.54% [29.46]<br> ARR Investment Partners : Global LS Strategy  :  -4.85% [36.31]<br> Rhenman & Partners Asset Management : Rhenman Healthcare Equity LS  :  -5.18% [700.80]<br> Catalio Capital Management : Global Innovative Healthcare  :  -5.59% [109.42]<br> Fidelity : Global Contrarian Long Short  :  -6.98% [10.45]<br> Adrigo Asset Management : Adrigo Small  & Midcap LS  :  -10.15% [20.20]<br> >
FMG Malta : Impega  :  16.20% [0.00]<br> Alkeon : Equity Long/Short  :  8.70% [22.40]<br> Alken : Absolute Return  :  6.24% [72.85]<br> Borea Asset Management AS : Borea Utbytte  :  5.67% [0.30]<br> Hussman : Hussman Strategic Growth  :  -1.50% [0.00]<br> Adrigo Asset Management : Adrigo Small  & Midcap LS  :  -10.15% [20.20]<br> Alquant : Convexus  :  0.04% [11.72]<br> Rhenman & Partners Asset Management : Rhenman Healthcare Equity LS  :  -5.18% [700.80]<br> Sherborne : Investors Guernsey  :  6.39% [0.00]<br> Proxy P Management : Proxy Renewable LongShort Energy  :  6.92% [0.00]<br> >

To explore the full list of Event Driven strategies and their rankings, including dynamic updates as new data becomes available, we invite you to visit our website at the Link provided.

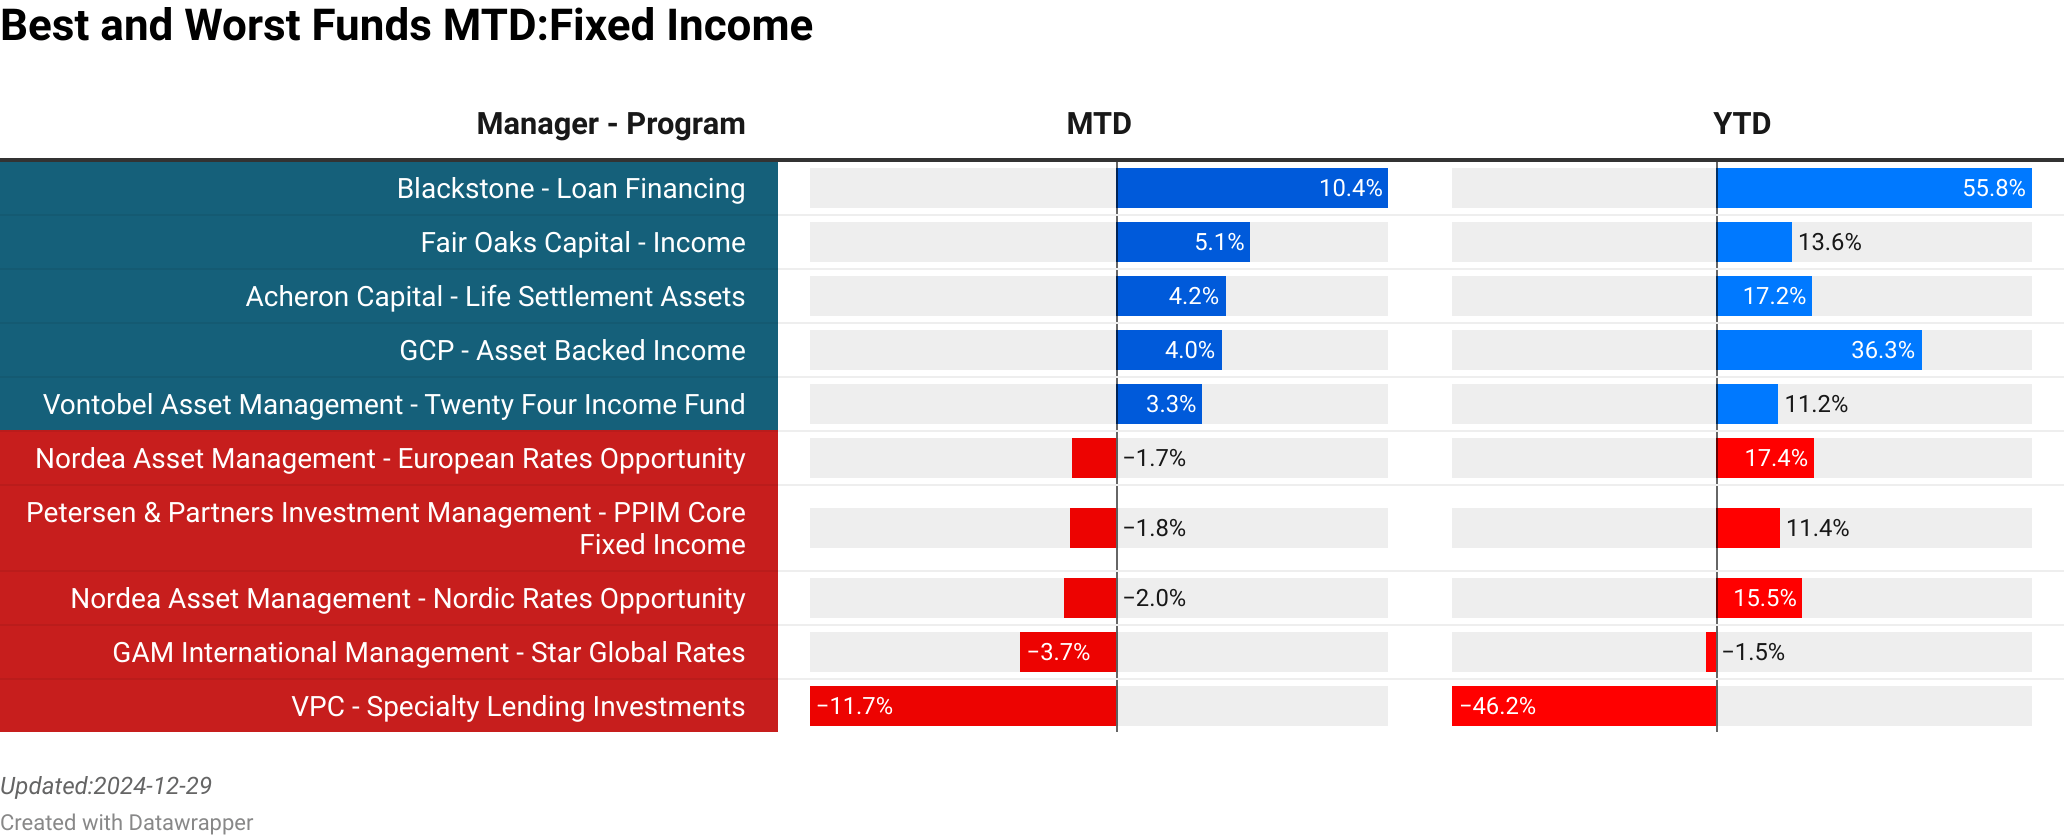
Fixed Income

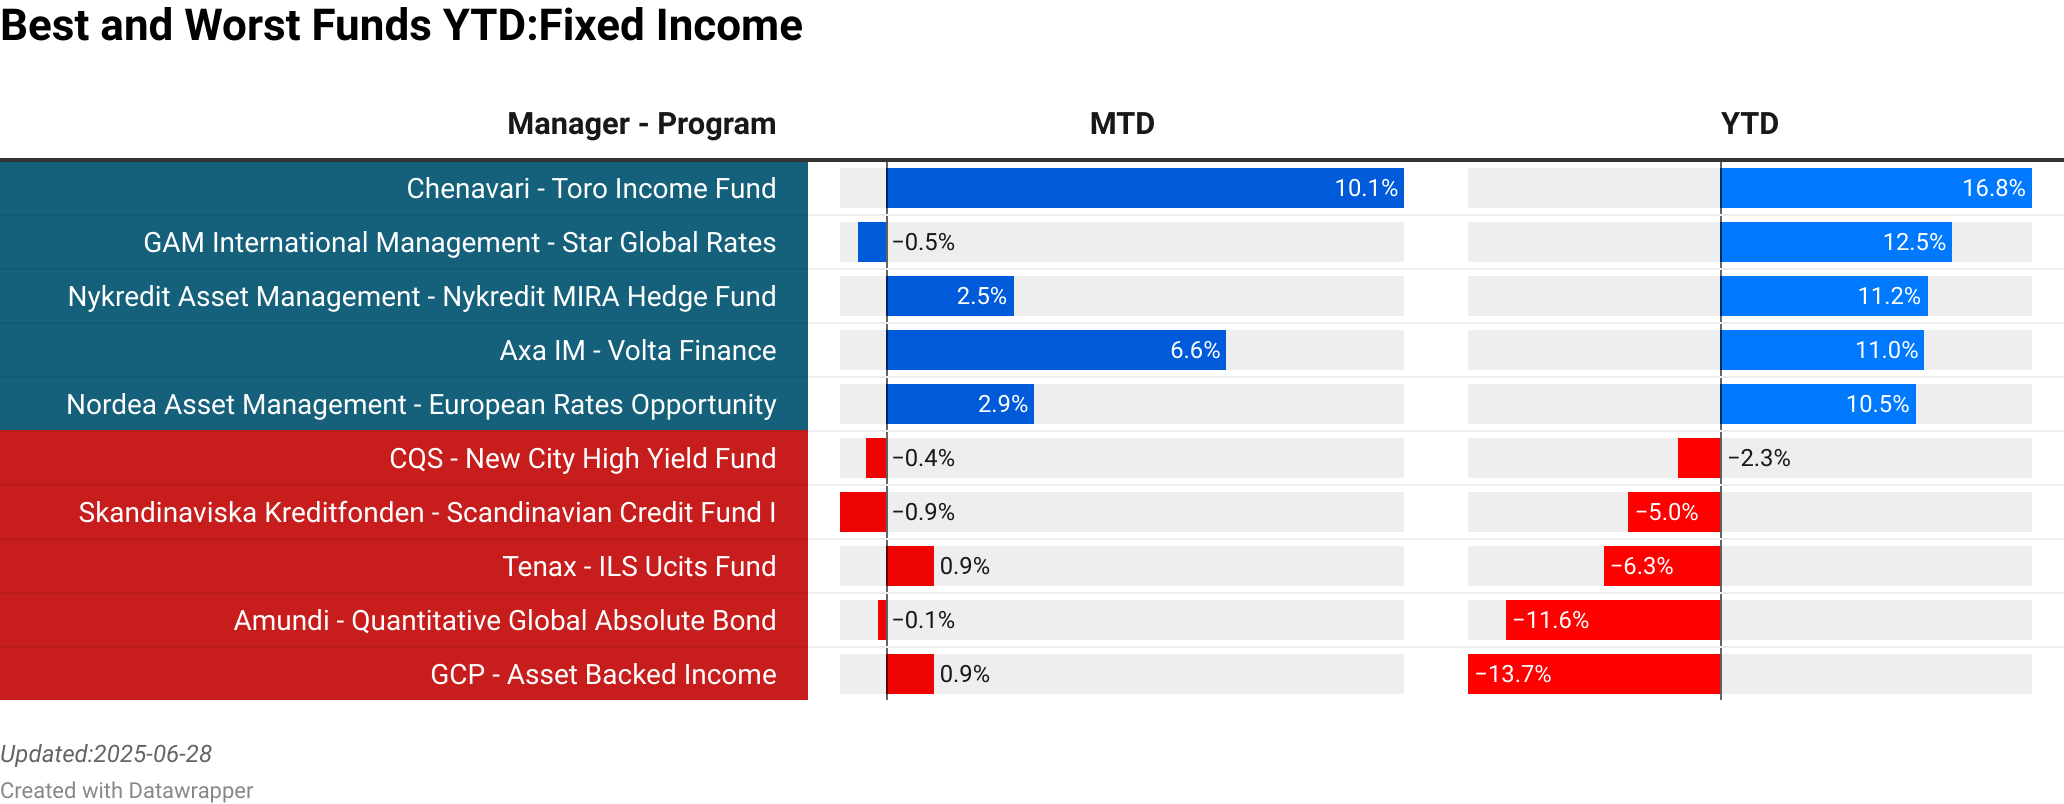
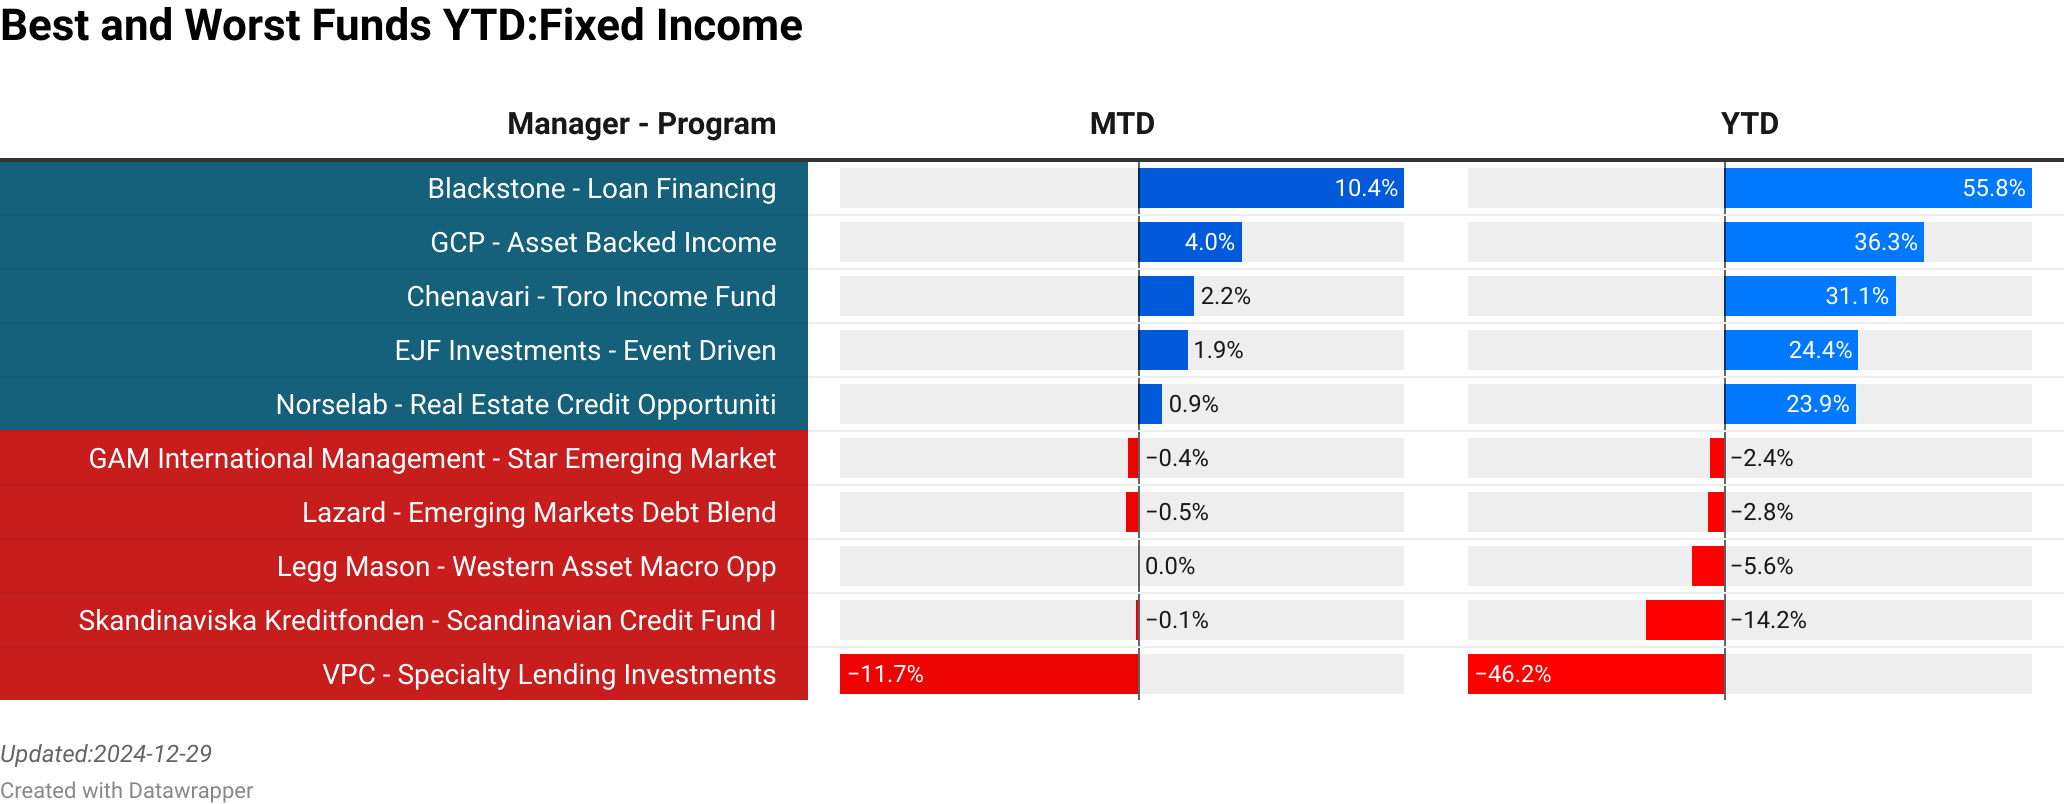
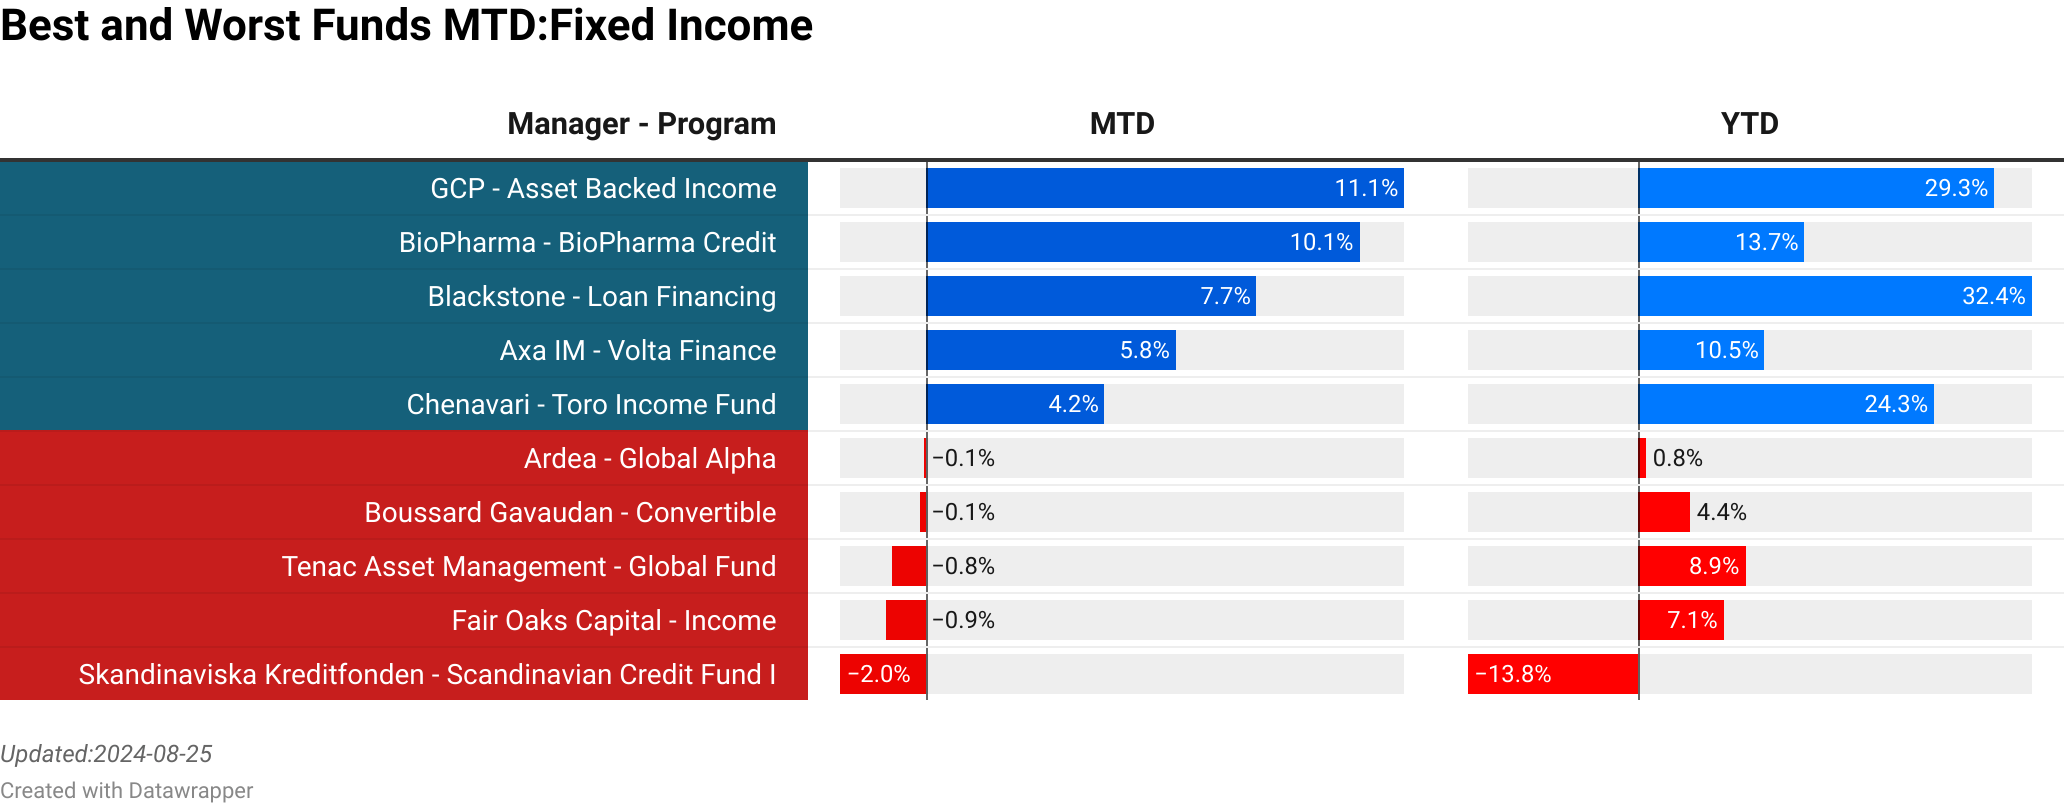
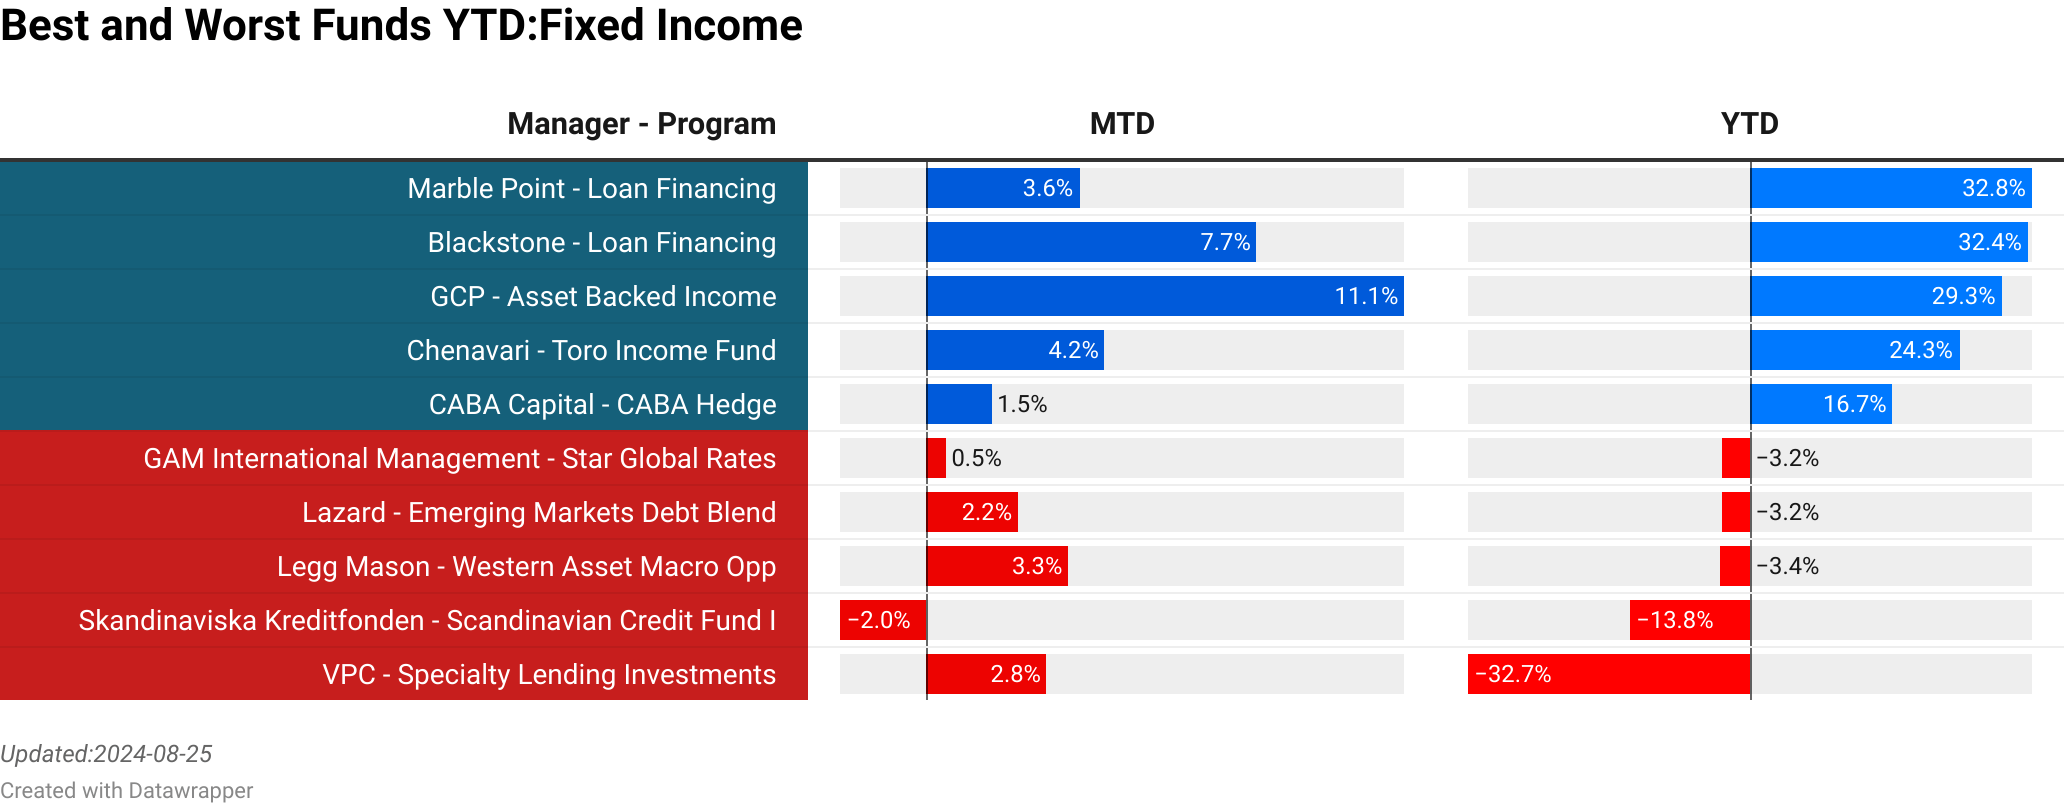
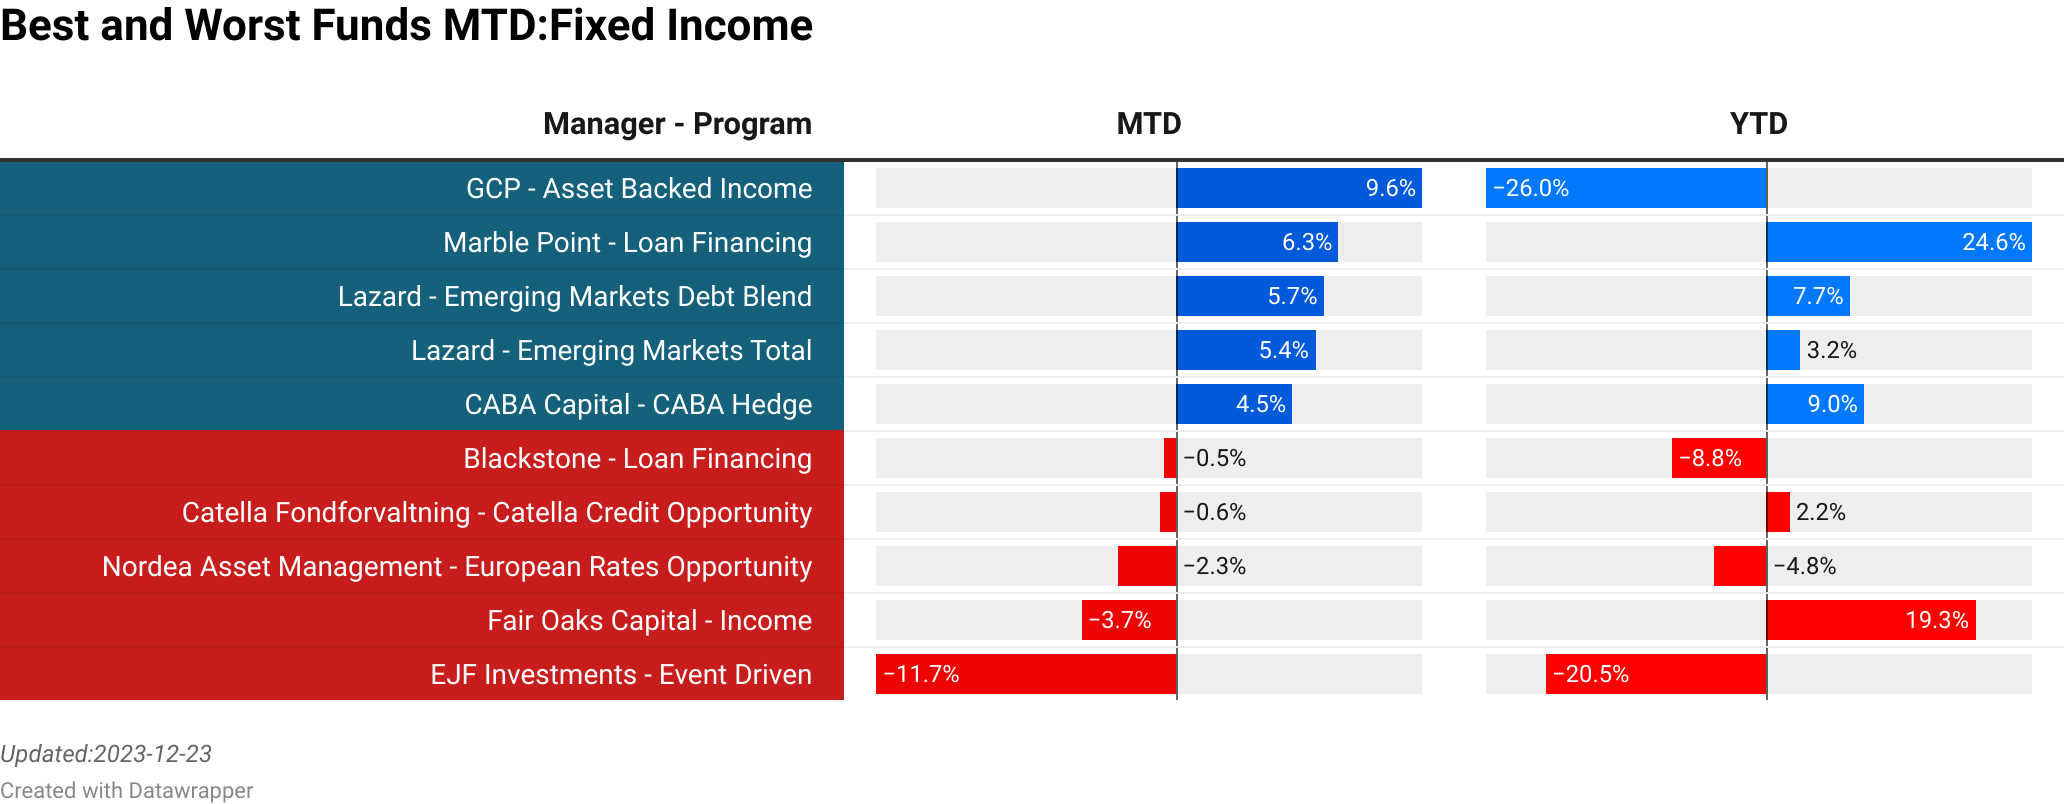
Acheron Capital : Life Settlement Assets  :  13.63% [0.00]<br> Chenavari : Toro Income Fund  :  10.05% [0.00]<br> Axa IM : Volta Finance  :  6.61% [0.00]<br> Fair Oaks Capital : Income  :  6.25% [0.00]<br> Tabula : Liquid Credit Income  :  4.29% [314.08]<br> Ironshield Capital Management : Credit Fund  :  -0.67% [184.68]<br> Robeco : QI Long/Short Dynamic Duration  :  -0.79% [52.32]<br> Skandinaviska Kreditfonden : Scandinavian Credit Fund I  :  -0.86% [0.40]<br> Nordkinn Asset Management : Nordkinn Fixed Income Macro Fund  :  -1.20% [0.60]<br> Tenac Asset Management : Global Fund  :  -2.51% [167.00]<br> >
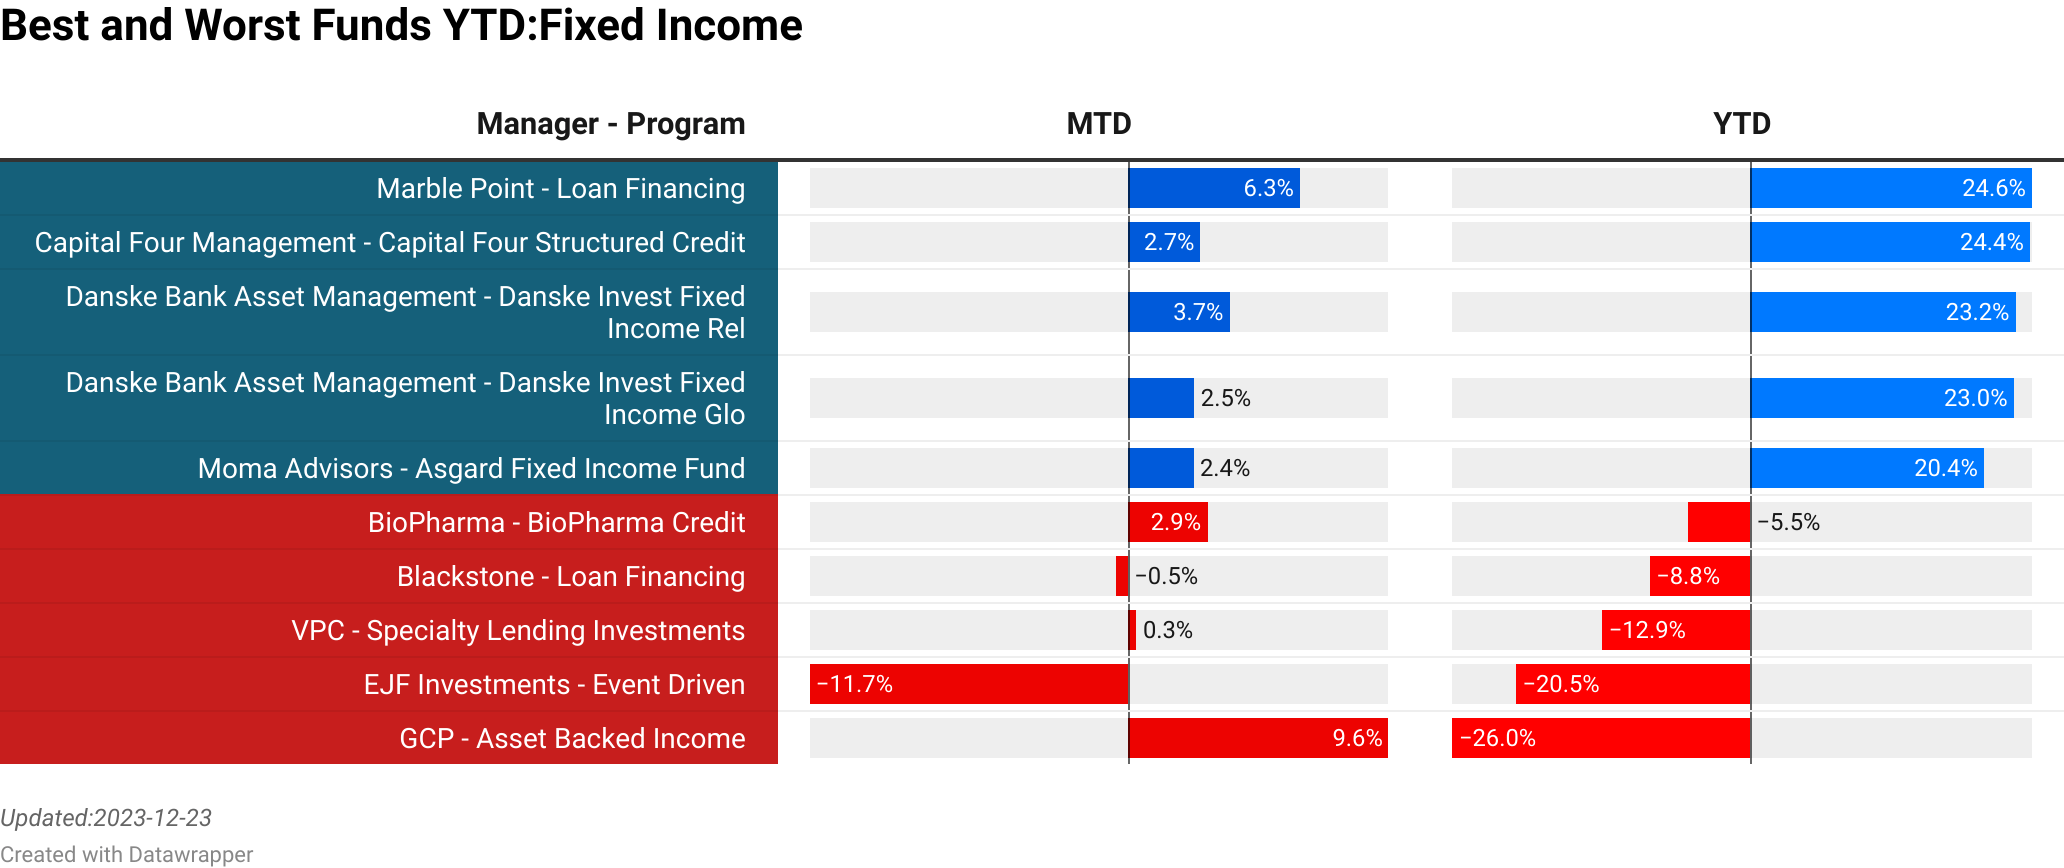
Chenavari : Toro Income Fund  :  10.05% [0.00]<br> GAM International Management : Star Global Rates  :  -0.51% [191.34]<br> Nykredit Asset Management : Nykredit MIRA Hedge Fund  :  2.48% [53.70]<br> Axa IM : Volta Finance  :  6.61% [0.00]<br> Nordea Asset Management : European Rates Opportunity  :  2.89% [412.80]<br> CQS : New City High Yield Fund  :  -0.37% [0.00]<br> Skandinaviska Kreditfonden : Scandinavian Credit Fund I  :  -0.86% [0.40]<br> Tenax : ILS Ucits Fund  :  0.94% [121.19]<br> Amundi : Quantitative Global Absolute Bond  :  -0.14% [60.17]<br> GCP : Asset Backed Income  :  0.94% [0.00]<br> >

To explore the full list of Event Driven strategies and their rankings, including dynamic updates as new data becomes available, we invite you to visit our website at the Link provided.

Risk Premia

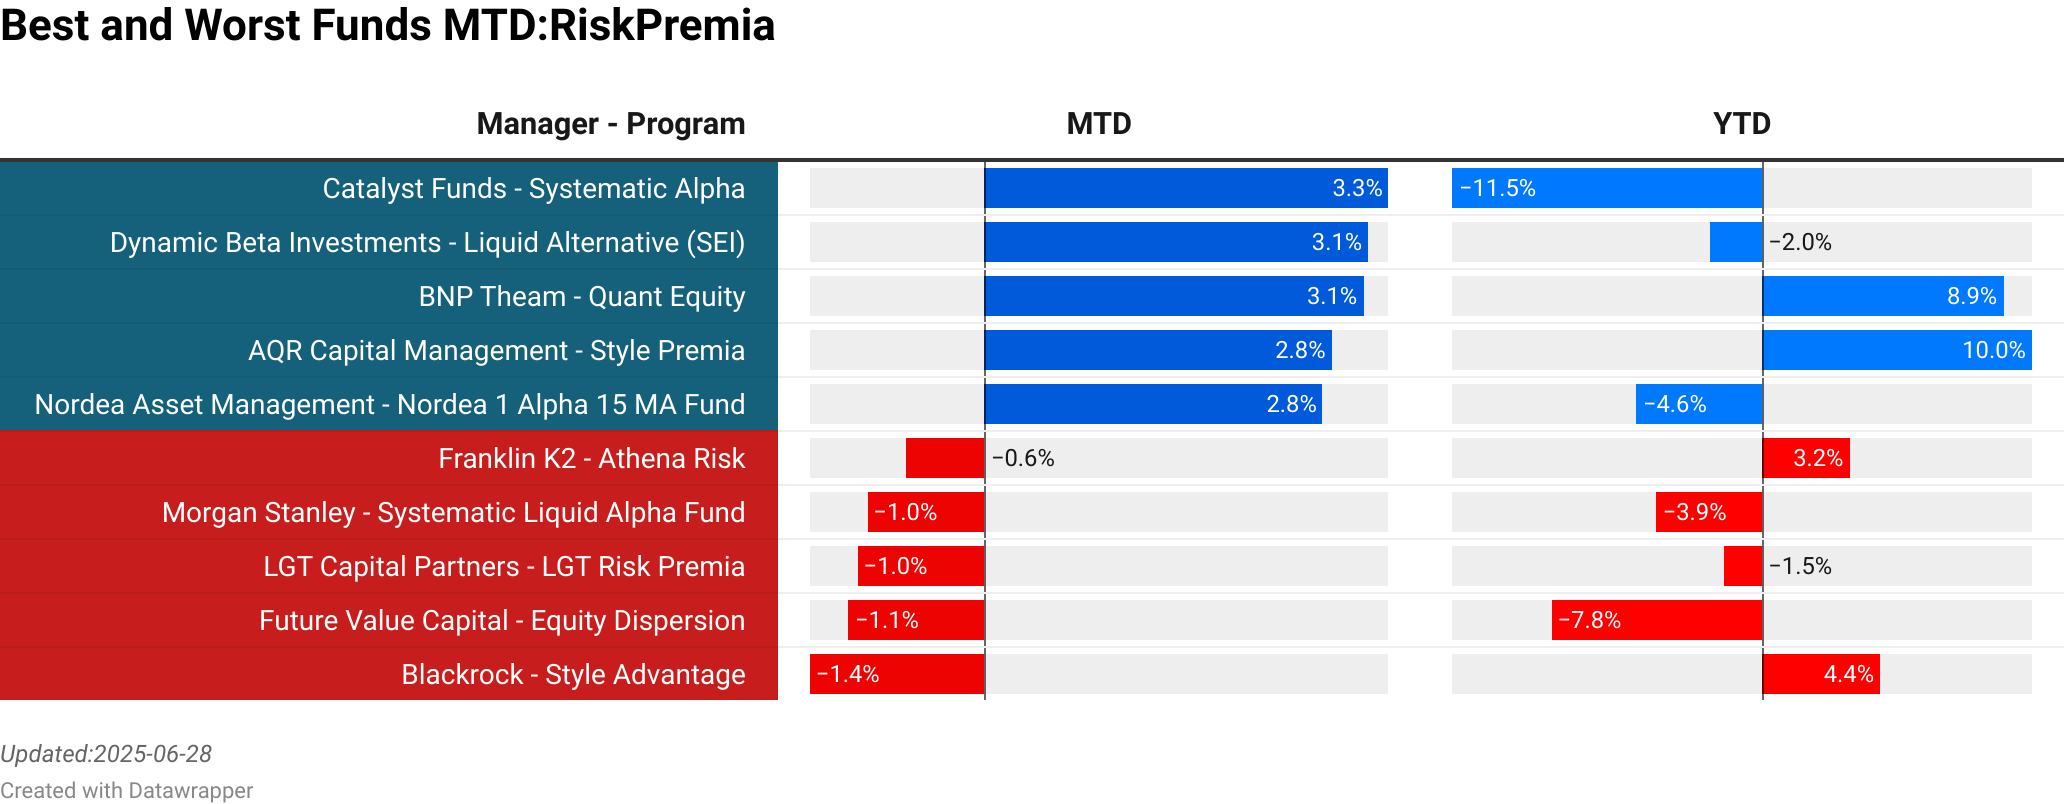
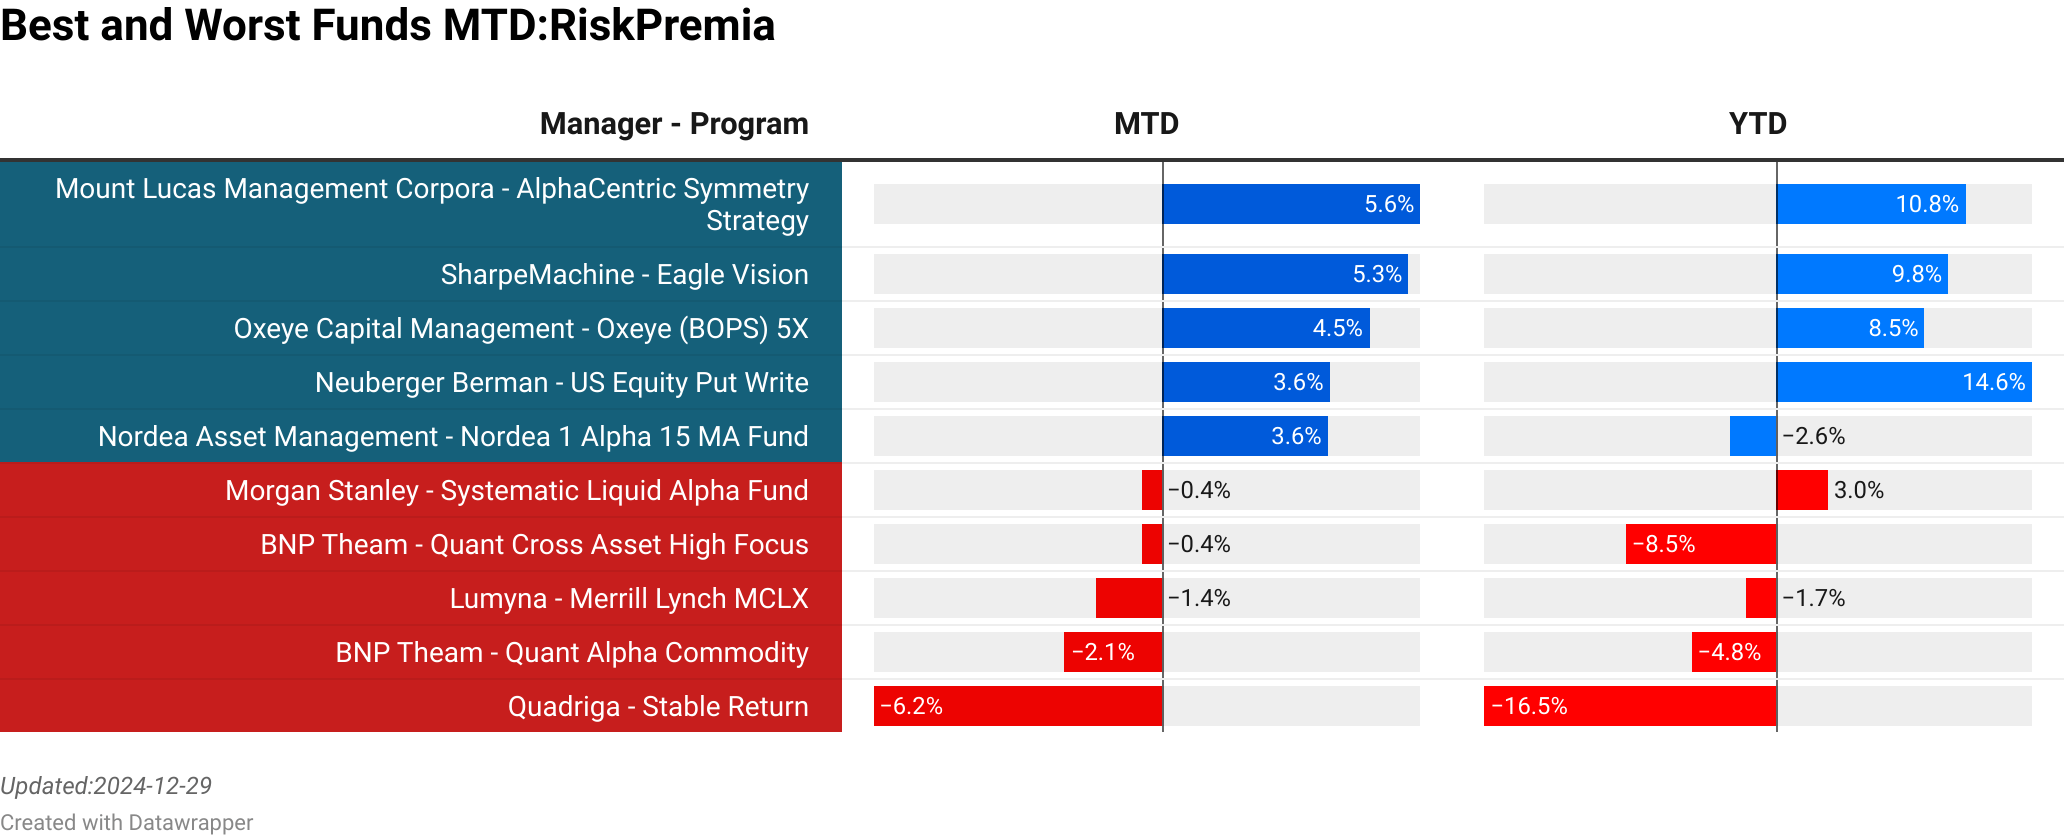
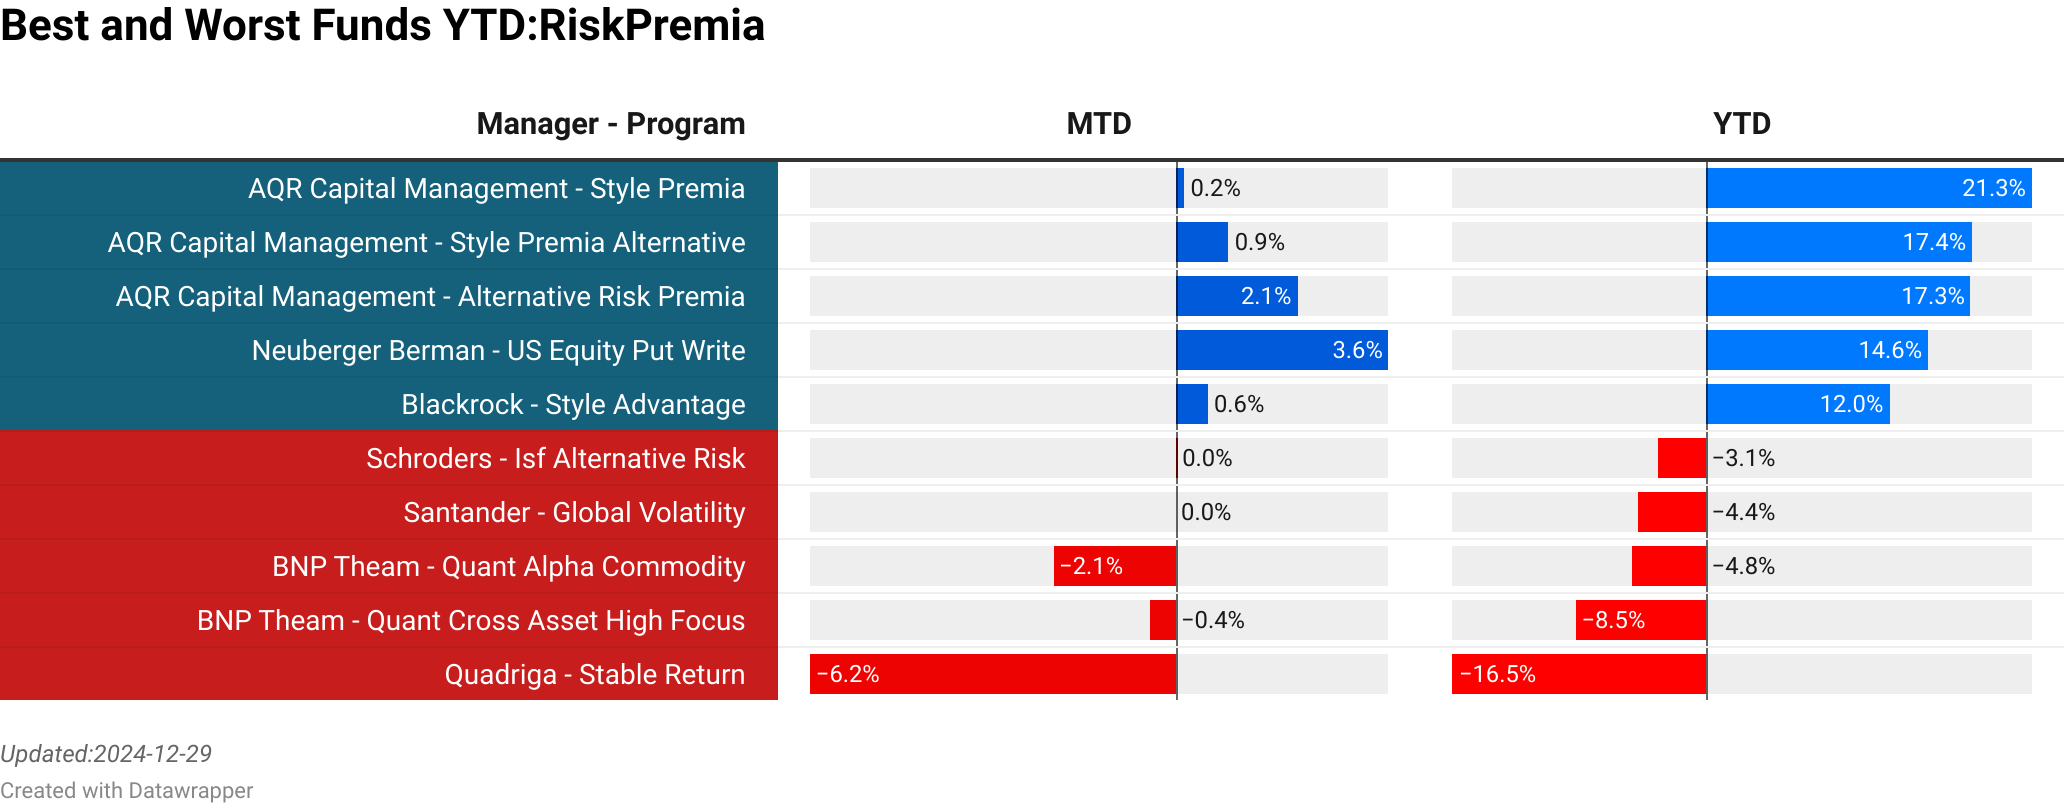
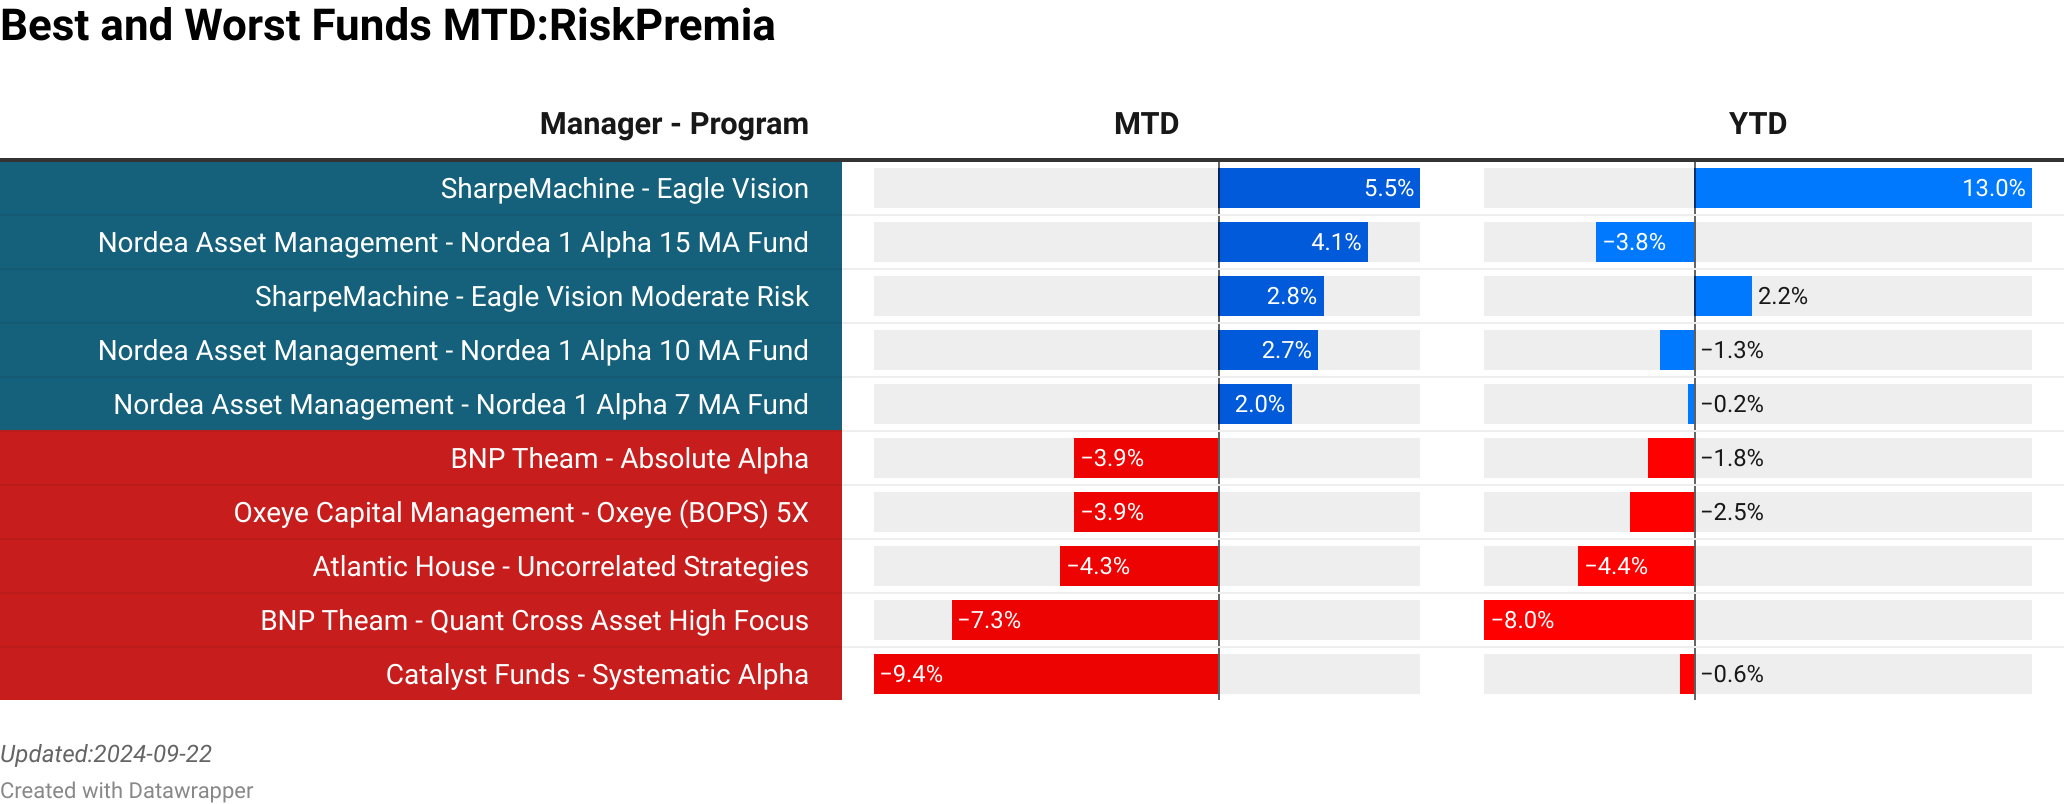
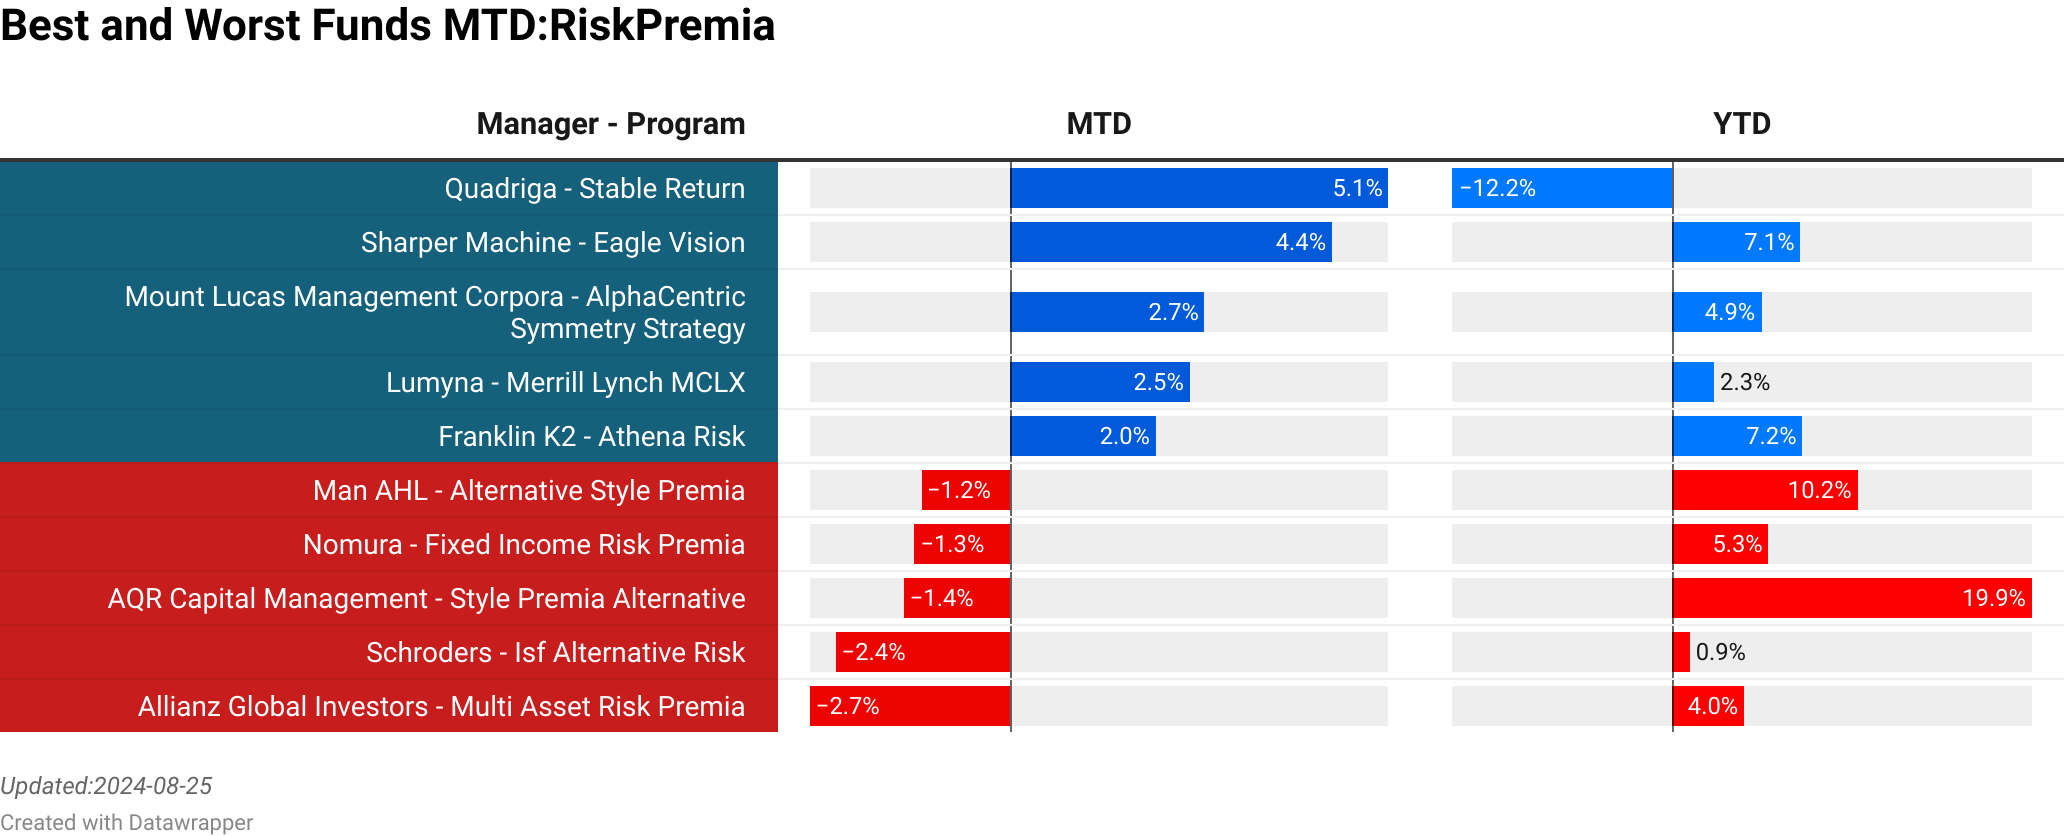
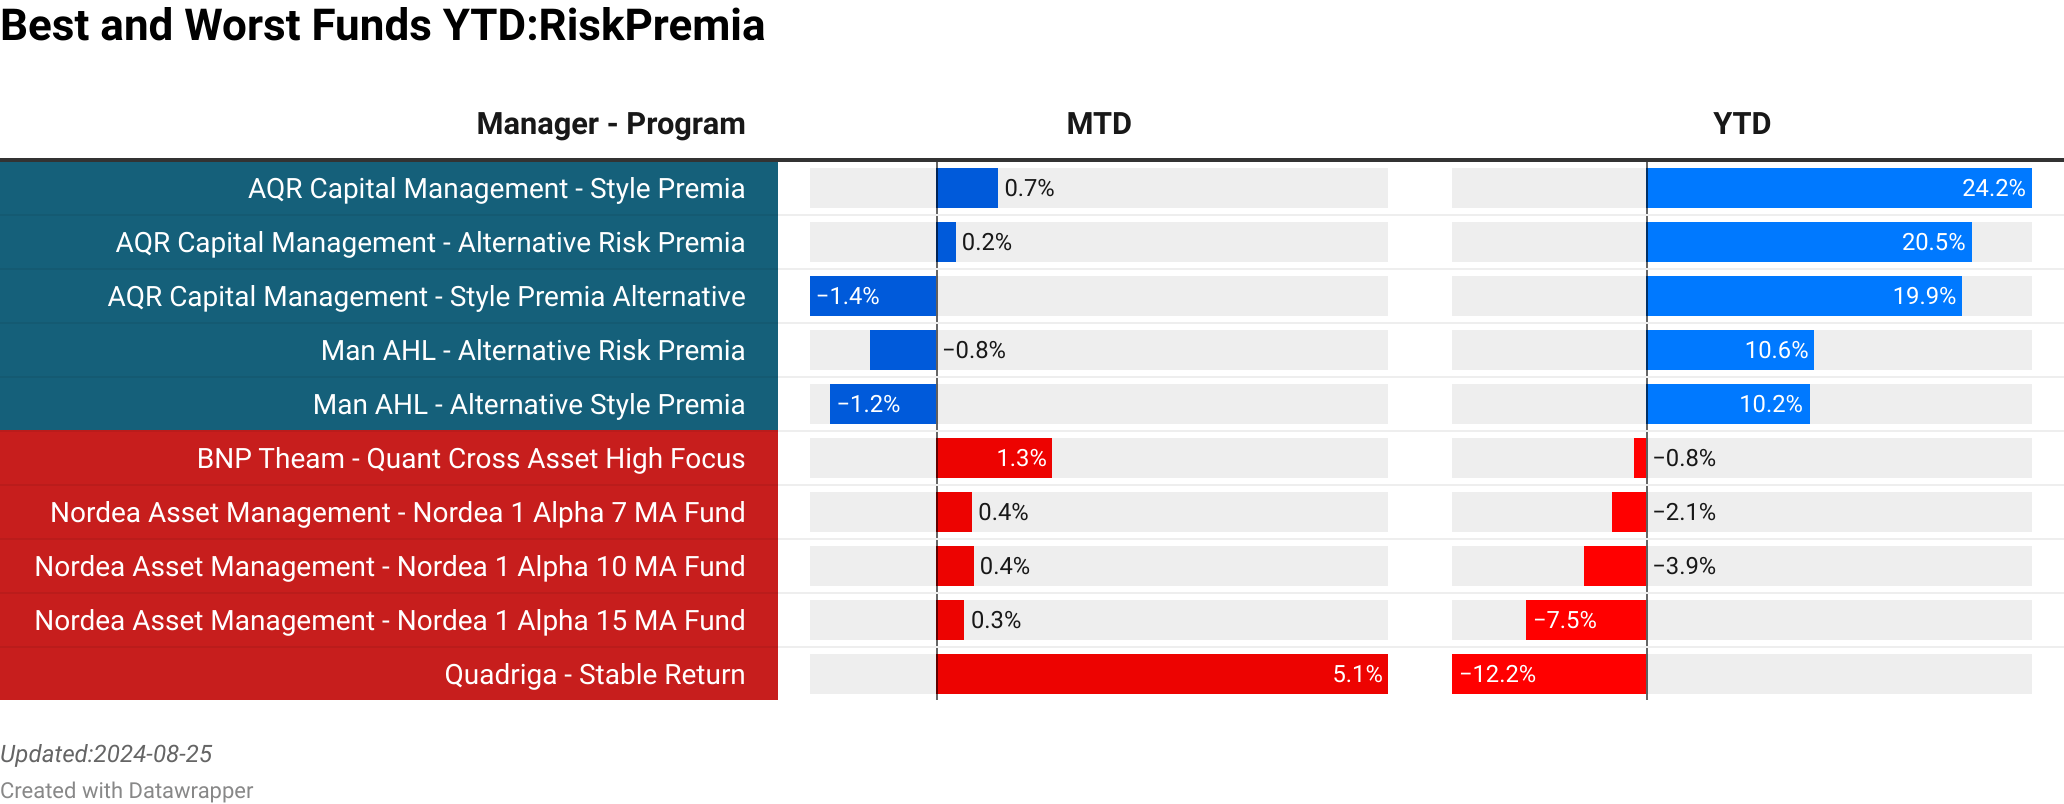
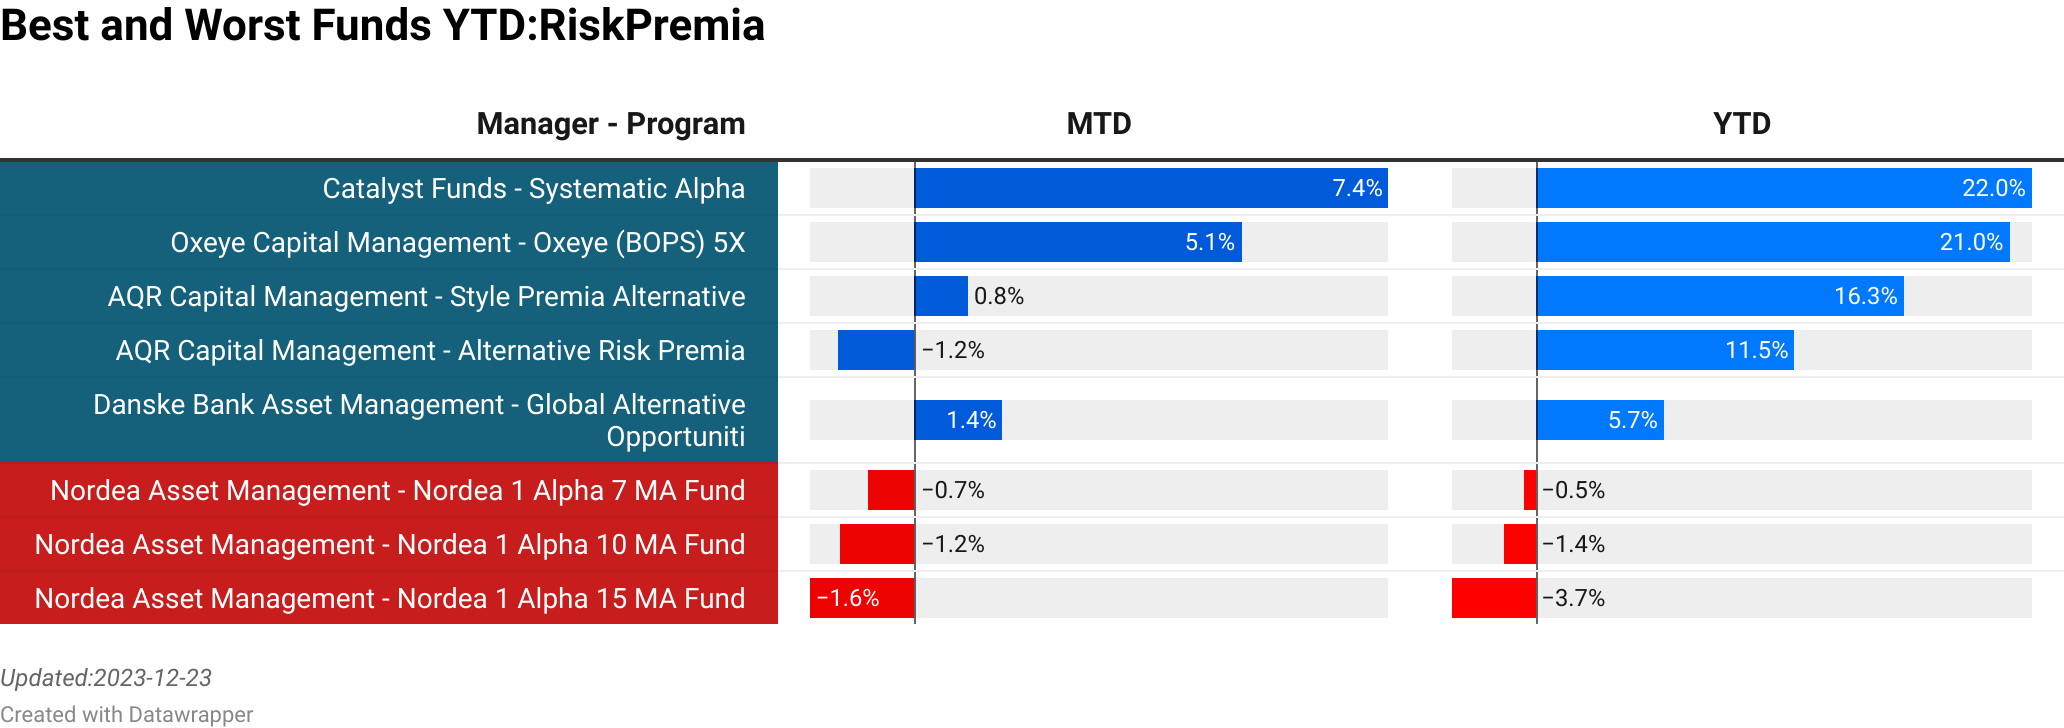
Catalyst Funds : Systematic Alpha  :  3.29% [0.00]<br> Dynamic Beta Investments : Liquid Alternative (SEI)  :  3.13% [945.67]<br> BNP Theam : Quant Equity  :  3.09% [14.58]<br> AQR Capital Management : Style Premia  :  2.83% [365.09]<br> Nordea Asset Management : Nordea 1  Alpha 15 MA Fund  :  2.76% [2194.89]<br> Franklin K2 : Athena Risk  :  -0.64% [113.45]<br> Morgan Stanley : Systematic Liquid Alpha Fund  :  -0.96% [86.03]<br> LGT Capital Partners : LGT Risk Premia  :  -1.04% [677.15]<br> Future Value Capital : Equity Dispersion  :  -1.11% [6.53]<br> Blackrock : Style Advantage  :  -1.43% [142.44]<br> >
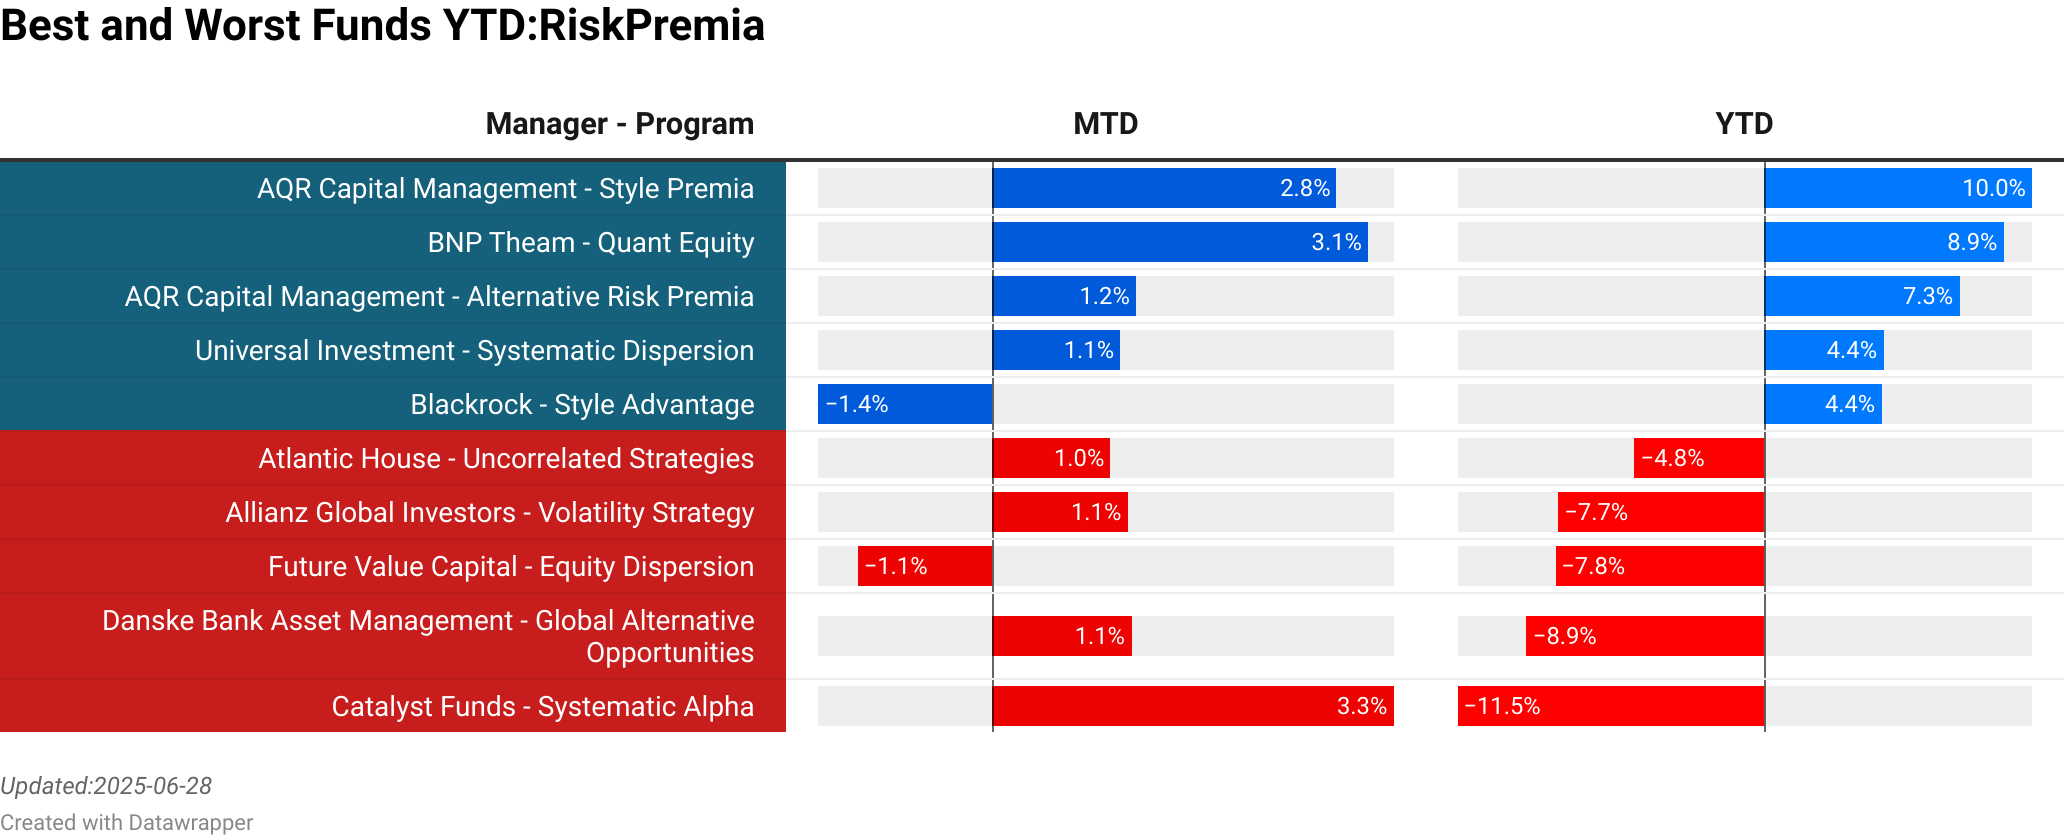
AQR Capital Management : Style Premia  :  2.83% [365.09]<br> BNP Theam : Quant Equity  :  3.09% [14.58]<br> AQR Capital Management : Alternative Risk Premia  :  1.17% [0.00]<br> Universal Investment : Systematic Dispersion  :  1.05% [53.78]<br> Blackrock : Style Advantage  :  -1.43% [142.44]<br> Atlantic House : Uncorrelated Strategies  :  0.97% [300.28]<br> Allianz Global Investors : Volatility Strategy  :  1.11% [469.74]<br> Future Value Capital : Equity Dispersion  :  -1.11% [6.53]<br> Danske Bank Asset Management : Global Alternative Opportunities  :  1.14% [842.40]<br> Catalyst Funds : Systematic Alpha  :  3.29% [0.00]<br> >

To explore the full list of Risk Premia strategies and their rankings, including dynamic updates as new data becomes available, we invite you to visit our website at the Link provided.

Crypto Strategies

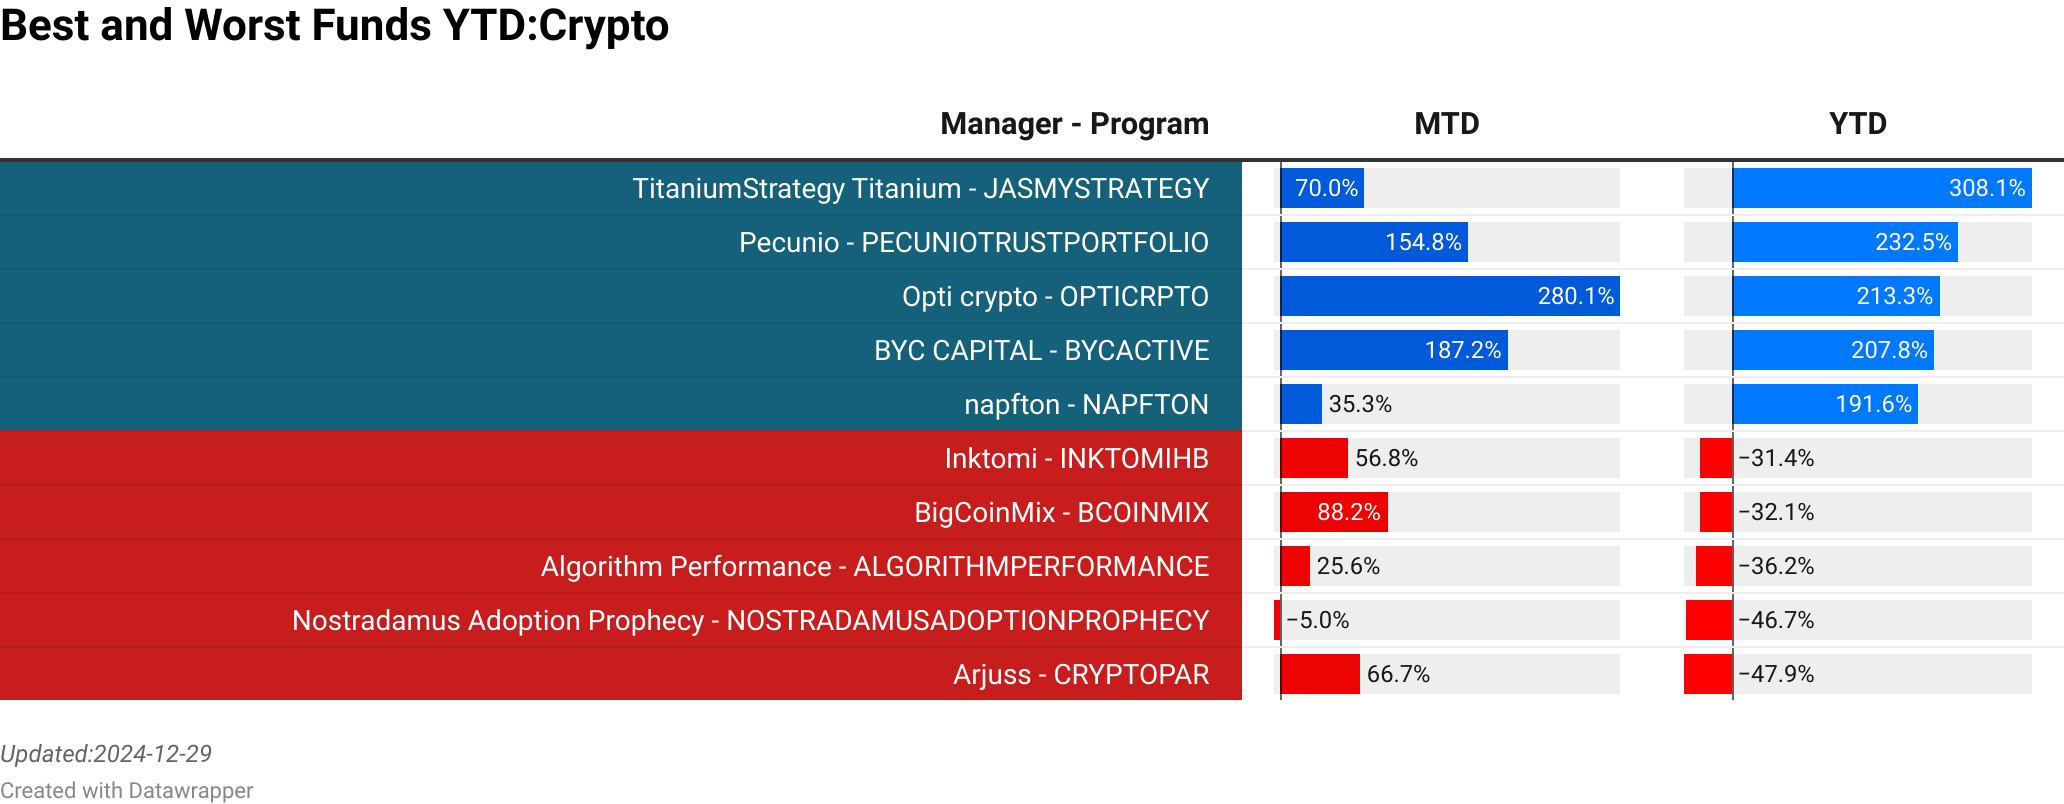
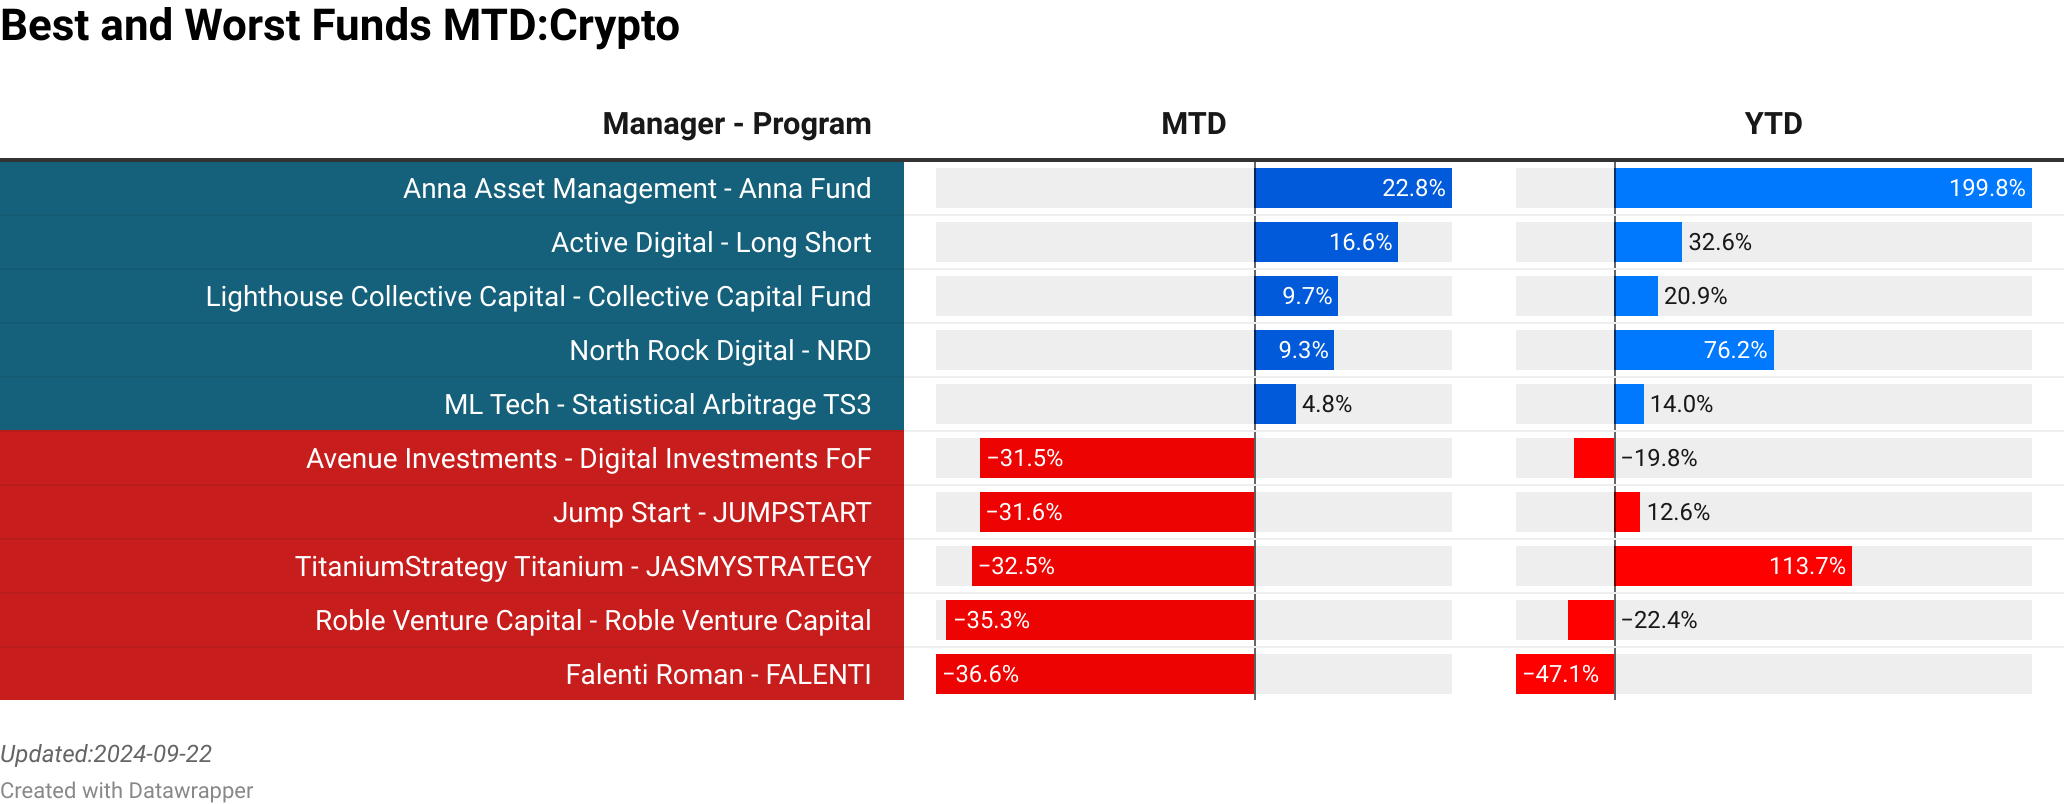
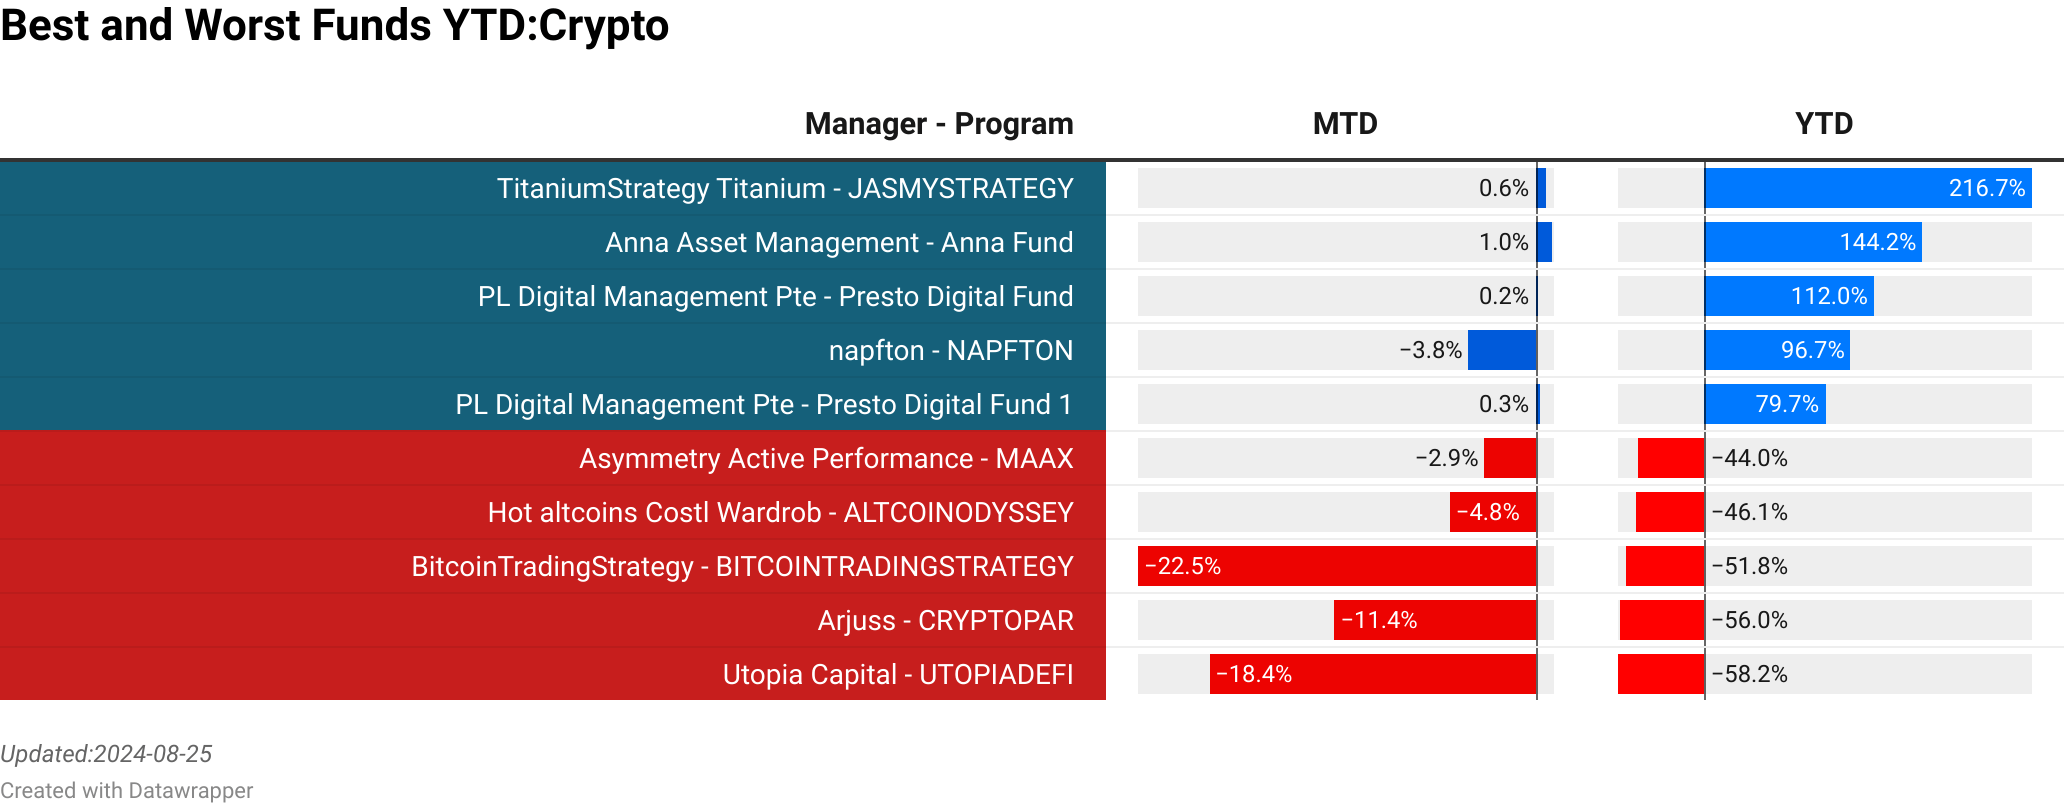
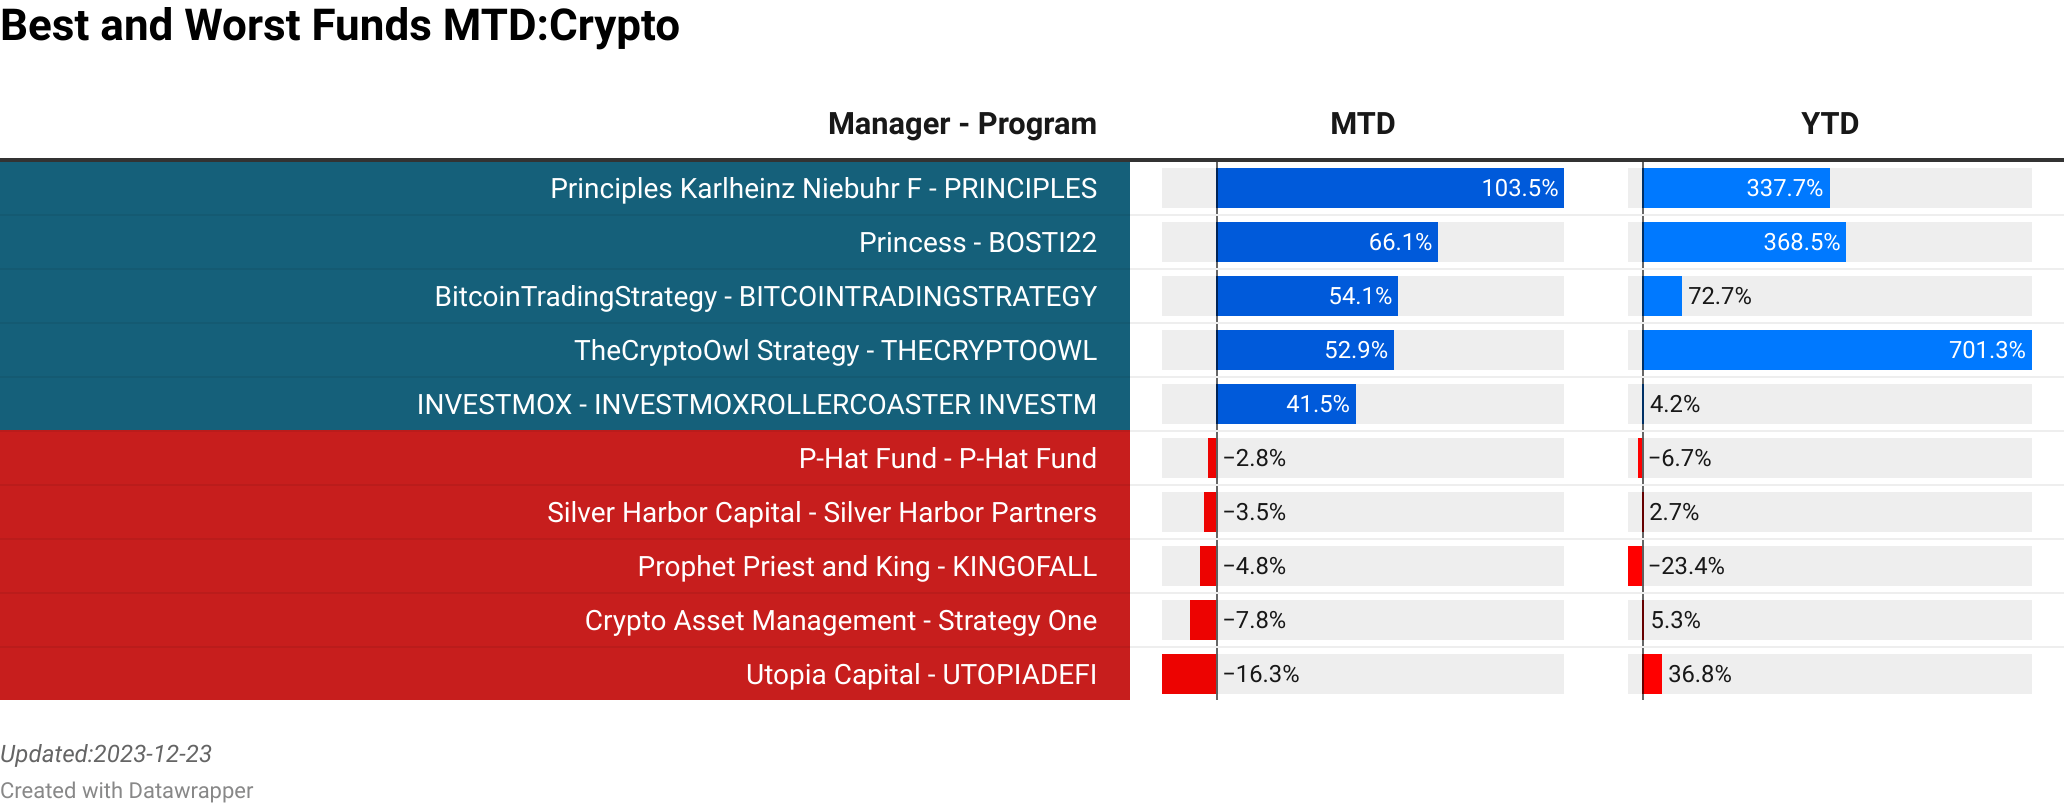
TOBAM : Bitcoin CO2 Offset  :  52.77% [42.42]<br> TheCryptoOwl Strategy : THECRYPTOOWL  :  41.76% [0.00]<br> Digital Capital Management [Iconomi] : SMARTMONEYFUND  :  39.80% [0.00]<br> Motus Capital Management : Digital Growth  :  36.24% [25.00]<br> To Mars and Beyond Moon & Beyond : MARSANDBEYOND  :  35.30% [0.00]<br> Wisdom MarkoP : W10COLL  :  -3.79% [0.00]<br> xWin : Dollar Cost Average (DCA GMX)  :  -3.87% [0.00]<br> Fusion AI : FUSIONAIXBT  :  -6.52% [0.00]<br> Anna Asset Management : Anna Fund  :  -6.81% [38.00]<br> Unfair Advantage Systems : Managed Account Program  :  -12.30% [0.00]<br> >
EdgeHill Investment Group : HADES (Short-Only) Cryptocurrency Strat  :  4.08% [14.41]<br> SDI Partners : Accredited Partner Account  :  13.04% [820.22]<br> Coincident Capital : Coincident  :  24.00% [600.00]<br> TOBAM : Bitcoin CO2 Offset  :  52.77% [42.42]<br> MeteFatih : METEFATIH  :  12.00% [0.00]<br> Dazza LT : DAZZALTHOLD  :  18.14% [0.00]<br> Asymmetric Technologies : Asymmetric Liquid Alpha  :  35.04% [59.15]<br> Pro Crypto Daytrading Group : FEELING  :  22.70% [0.00]<br> Digital Gold Crypto : DIGITALGOLD  :  -0.02% [0.00]<br> Ape Capital : RIIKODC  :  -0.02% [0.00]<br> >

To explore the full list of Risk Premia strategies and their rankings, including dynamic updates as new data becomes available, we invite you to visit our website at the Link provided.

  •  

Best’n’Worst April 25

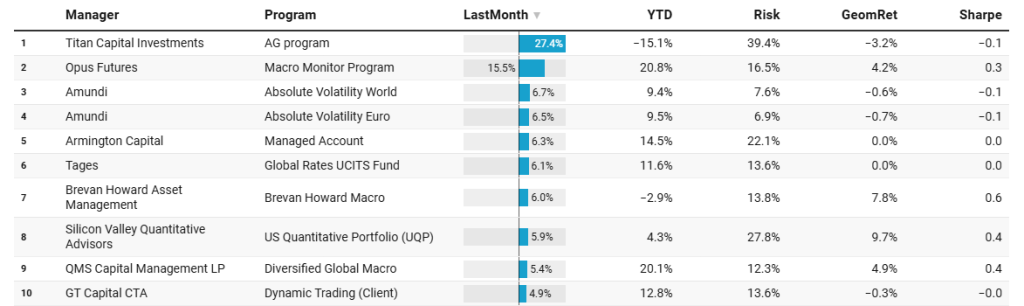
April was the crisis that wasn’t. A vicious V-shaped equity reversal created difficult trading conditions for more than one trend-based CTA strategy. We saw prior winners give back substantial amounts of their earlier profits. On the flip side, we have also seen a few non-trend, discretionary-focused managers able to profit from the crisis. Please feel free to dive deeper into the hit list for April 2025. The full list requires user registration.

CTA

Titan Capital Investments : AG program  :  27.35% [1.03]<br> Asymmetric Technologies : Asymmetric HV Master Fund  :  18.74% [4.27]<br> Opus Futures : Macro Monitor Program  :  15.51% [9.98]<br> Chelton Wealth : Balanced Compounding  :  13.45% [38.40]<br> Crescat Capital : Long/Short Fund  :  12.00% [17.87]<br> Haidar Capital Management : Jupiter Fund  :  -25.14% [813.17]<br> Melissinos Trading : Eupatrid Commodity  :  -25.47% [10.00]<br> ABR : Enhanced Short Volatility  :  -26.29% [0.90]<br> Tianyou Asset Management : Tianyou Fund  :  -31.63% [111.93]<br> Mulvaney Capital Management : Global Diversified Program  :  -40.66% [165.00]<br> >
Crescat Capital : Long/Short Fund  :  12.00% [17.87]<br> Crescat Capital : Precious Metals Fund  :  8.30% [147.21]<br> Vigo Capital : Fund  :  2.54% [1.92]<br> Friedberg Mercantile Group : Global Macro Hedge Fund  :  6.15% [409.38]<br> Veerpoint Capital : ContraCOT Program  :  11.42% [0.08]<br> Transtrend BV : Tulip Trend Fund  :  -8.00% [89.28]<br> ABR : Enhanced Short Volatility  :  -26.29% [0.90]<br> Asymmetric Technologies : Asymmetric HV Master Fund  :  18.74% [4.27]<br> Mulvaney Capital Management : Global Diversified Program  :  -40.66% [165.00]<br> Melissinos Trading : Eupatrid Commodity  :  -25.47% [10.00]<br> >

To explore the full list of CTAs and their rankings, including dynamic updates as new data becomes available, we invite you to visit our website at the Link provided.

Market Neutral

ABCA Asset Management : ABCA Opportunities  :  6.11% [117.00]<br> Parallax Volatility Advisers : Parallax Master Fund  :  5.13% [931.00]<br> Fulcrum Asset Management : Thematic Equity Market  :  3.76% [423.94]<br> AQR Capital Management : Adaptive Equity Market Neutral  :  3.63% [711.81]<br> RAM : Long Short European  :  2.26% [125.66]<br> Gondor Capital : Gondor Partners Ltd  :  -2.09% [11.50]<br> Zest : North America Pairs Trading  :  -2.56% [63.81]<br> PIMCO : PIMCO RAE Fundamental Advantage PLUS  :  -3.10% [0.00]<br> Grand Alliance Asset Management : Sino Vision Greater China Market Neutral  :  -3.81% [587.98]<br> BNP Theam : Quant Dispersion US  :  -6.62% [133.58]<br> >
AQR Capital Management : Adaptive Equity Market Neutral  :  3.63% [711.81]<br> AQR Capital Management : Equity Market Neutral  :  1.79% [1840.00]<br> ABCA Asset Management : ABCA Opportunities  :  6.11% [117.00]<br> Fulcrum Asset Management : Thematic Equity Market  :  3.76% [423.94]<br> Parallax Volatility Advisers : Parallax Master Fund  :  5.13% [931.00]<br> Scopia Capital Management : Market Neutral  :  0.61% [45.77]<br> Candriam Investors Group : Candriam Equities L ESG Market Neutral  :  -0.24% [23.71]<br> Candriam Investors Group : Equities ESG Market Neutral  :  -0.24% [23.71]<br> Neo Ivy Capital Management : Neo Ivy  :  1.81% [0.00]<br> Grand Alliance Asset Management : Sino Vision Greater China Market Neutral  :  -3.81% [587.98]<br> >

To explore the full list of Market Neutral strategies and their rankings, including dynamic updates as new data becomes available, we invite you to visit our website at the Link provided.

Equity Long Short

Alkeon : Equity Long/Short  :  12.98% [22.40]<br> Odey : Absolute Return Focus Fund  :  11.01% [105.21]<br> BNP : Environmental Absolute Return  :  9.42% [8.46]<br> FIEE SGR : Spesx Energy Transition Liquid  :  8.97% [29.46]<br> Hussman : Hussman Strategic Growth  :  8.15% [0.00]<br> Strategic Investment Advisors : Long-Term Investment Fund Natural Resources  :  -8.10% [82.56]<br> Proxy P Management : Energy Transition  :  -8.67% [26.00]<br> ABR : Dynamic Blend Equity & Volatil  :  -9.44% [0.00]<br> Fidelity : Global Contrarian Long Short  :  -11.36% [10.45]<br> Sherborne : Investors Guernsey  :  -12.91% [0.00]<br> >
EDL Capital : Global Opportunities Fund  :  7.33% [1152.00]<br> Alken : Alken Capital One  :  4.02% [175.02]<br> Hussman : Hussman Strategic Growth  :  8.15% [0.00]<br> Quantitative Investment Management : Tactical Fund  :  7.02% [416.33]<br> TIND Asset Management : TIND Discovery Fund  :  6.52% [0.00]<br> Cantor Fitzgerald : Alternative Investment Fund  :  0.33% [185.74]<br> Proxy P Management : Energy Transition  :  -8.67% [26.00]<br> Sherborne : Investors Guernsey  :  -12.91% [0.00]<br> Proxy P Management : Proxy Renewable LongShort Energy  :  -7.71% [0.00]<br> Ikarian Capital : Healthcare  :  0.37% [271.60]<br> >

To explore the full list of Equity Long Short strategies and their rankings, including dynamic updates as new data becomes available, we invite you to visit our website at the Link provided.

Event Driven

Alkeon : Equity Long/Short  :  12.98% [22.40]<br> Odey : Absolute Return Focus Fund  :  11.01% [105.21]<br> BNP : Environmental Absolute Return  :  9.42% [8.46]<br> FIEE SGR : Spesx Energy Transition Liquid  :  8.97% [29.46]<br> Hussman : Hussman Strategic Growth  :  8.15% [0.00]<br> Strategic Investment Advisors : Long-Term Investment Fund Natural Resources  :  -8.10% [82.56]<br> Proxy P Management : Energy Transition  :  -8.67% [26.00]<br> ABR : Dynamic Blend Equity & Volatil  :  -9.44% [0.00]<br> Fidelity : Global Contrarian Long Short  :  -11.36% [10.45]<br> Sherborne : Investors Guernsey  :  -12.91% [0.00]<br> >
EDL Capital : Global Opportunities Fund  :  7.33% [1152.00]<br> Alken : Alken Capital One  :  4.02% [175.02]<br> Hussman : Hussman Strategic Growth  :  8.15% [0.00]<br> Quantitative Investment Management : Tactical Fund  :  7.02% [416.33]<br> TIND Asset Management : TIND Discovery Fund  :  6.52% [0.00]<br> Cantor Fitzgerald : Alternative Investment Fund  :  0.33% [185.74]<br> Proxy P Management : Energy Transition  :  -8.67% [26.00]<br> Sherborne : Investors Guernsey  :  -12.91% [0.00]<br> Proxy P Management : Proxy Renewable LongShort Energy  :  -7.71% [0.00]<br> Ikarian Capital : Healthcare  :  0.37% [271.60]<br> >

To explore the full list of Event Driven strategies and their rankings, including dynamic updates as new data becomes available, we invite you to visit our website at the Link provided.

Fixed Income

GAM International Management : Star Global Rates  :  6.18% [191.34]<br> Lazard : Emerging Markets Debt Blend  :  3.46% [0.00]<br> Argo Capital Management : Argo Fund  :  3.45% [124.00]<br> Boussard Gavaudan : Convertible  :  2.82% [60.15]<br> Franklin Templeton - Legg Mason : Brandywine Global Fixed Income Absolute Return  :  2.59% [104.64]<br> Amundi : Quantitative Global Absolute Bond  :  -3.86% [60.17]<br> Tenax : ILS Ucits Fund  :  -5.21% [121.19]<br> Fair Oaks Capital : Income  :  -5.45% [0.00]<br> EJF Investments : Event Driven  :  -6.04% [0.00]<br> Axa IM : Volta Finance  :  -6.20% [0.00]<br> >
GAM International Management : Star Global Rates  :  6.18% [191.34]<br> Nykredit Asset Management : Nykredit MIRA Hedge Fund  :  0.57% [52.50]<br> Argo Capital Management : Argo Fund  :  3.45% [124.00]<br> Lazard : Emerging Markets Debt Blend  :  3.46% [0.00]<br> Nordea Asset Management : European Rates Opportunity  :  -0.29% [412.80]<br> Skandinaviska Kreditfonden : Scandinavian Credit Fund I  :  -1.14% [0.40]<br> Tenax : ILS Ucits Fund  :  -5.21% [121.19]<br> Acheron Capital : Life Settlement Assets  :  0.00% [0.00]<br> Amundi : Quantitative Global Absolute Bond  :  -3.86% [60.17]<br> GCP : Asset Backed Income  :  -1.51% [0.00]<br> >

To explore the full list of Event Driven strategies and their rankings, including dynamic updates as new data becomes available, we invite you to visit our website at the Link provided.

Risk Premia

BNP Theam : Quant Equity  :  4.94% [14.58]<br> BNP Theam : Quant Cross Asset High Focus  :  4.73% [350.23]<br> Universal Investment : Systematic Dispersion  :  4.32% [53.78]<br> BNP Theam : Quant Alpha Commodity  :  2.66% [54.68]<br> Trium Capital : Alternative Growth Fund  :  2.65% [67.14]<br> Allspring : Alternative Risk  :  -6.32% [0.00]<br> BNP Theam : Quant Europe Target Premium  :  -6.78% [164.95]<br> Allianz Global Investors : Volatility Strategy  :  -7.74% [469.74]<br> Danske Bank Asset Management : Global Alternative Opportunities  :  -9.05% [842.40]<br> Quantedge Capital : Quantedge Global Fund  :  -9.44% [4021.83]<br> >
AQR Capital Management : Style Premia  :  -3.91% [1320.00]<br> AQR Capital Management : Alternative Risk Premia  :  -4.91% [0.00]<br> Blackrock : Style Advantage  :  0.74% [142.44]<br> BNP Theam : Quant Equity  :  4.94% [14.58]<br> Franklin K2 : Athena Risk  :  -1.95% [113.45]<br> Candriam Investors Group : Candriam Multi Asset Premia  :  0.41% [0.00]<br> Nordea Asset Management : Nordea 1  Alpha 15 MA Fund  :  -4.14% [2194.89]<br> Allianz Global Investors : Volatility Strategy  :  -7.74% [469.74]<br> Danske Bank Asset Management : Global Alternative Opportunities  :  -9.05% [842.40]<br> Catalyst Funds : Systematic Alpha  :  -4.73% [0.00]<br> >

To explore the full list of Risk Premia strategies and their rankings, including dynamic updates as new data becomes available, we invite you to visit our website at the Link provided.

Crypto Strategies

stvgny2 : STVGNY2  :  45.25% [0.00]<br> TitaniumStrategy Titanium : JASMYSTRATEGY  :  39.72% [0.00]<br> Future Chain Index : Future Chain Index  :  38.36% [0.00]<br> BlockRock Outstandin Pac : BLOCKROCK  :  32.60% [0.00]<br> Motus Capital Management : Digital Growth  :  29.13% [25.00]<br> Asymmetric Technologies : Asymmetric Liquid Alpha  :  -13.24% [44.21]<br> Arctur DeFi : MULHACEN  :  -14.38% [0.00]<br> DutchEd Larg Calculu : DUTCHED  :  -17.70% [0.00]<br> Larg Calculu : DUTCHED2  :  -18.03% [0.00]<br> Andy Storm : CRYPTOALLIEN  :  -20.66% [0.00]<br> >
SDI Partners : Accredited Partner Account  :  13.68% [712.42]<br> Coincident Capital : Coincident  :  12.00% [458.00]<br> Fore Elite Capital Management : ForeElite Flagship Fund  :  3.11% [173.47]<br> Incrementum AG : Digital & Physical Gold  :  9.78% [26.00]<br> MeteFatih : METEFATIH  :  18.93% [0.00]<br> Ape Capital : RIIKODC  :  -0.16% [0.00]<br> Andy Storm : CRYPTOALLIEN  :  -20.66% [0.00]<br> Dazza LT : DAZZALTHOLD  :  16.89% [0.00]<br> Pro Crypto Daytrading Group : FEELING  :  20.38% [0.00]<br> Asymmetric Technologies : Asymmetric Liquid Alpha  :  -13.24% [44.21]<br> >

To explore the full list of Risk Premia strategies and their rankings, including dynamic updates as new data becomes available, we invite you to visit our website at the Link provided.

  •  

What a month – Early Performance Indication

April was a strange month. We saw dramatic moves after the US Liberation Day, which wreaked havoc in the Equity, Bond, and Currency markets. The S&P dropped 10% in a dramatic unwind of global stability, only to show a large positive day a few days later. Several of the most destabilizing policies were later walked back, delayed, or clarified as bond yields started to increase, showing increasing uncertainty. In the end, the most significant Trade Policy is the remaining Chinese tariffs where others have been modified or delayed.

At the end of the month, April showed a modest decline across most equity markets, but with dramatic intra-month volatility. Not acting provided the right decision, despite the increased uncertainty that prevailed throughout April.

Webinar Invitation: Join our Webinar / Navigating the Storm / An ODD Seminar on the 6th of May: https://streamyard.com/watch/FUSZjHbwXDyu
For a full list of panelist see our earlier post: https://nilssonhedge.com/2025/04/30/navigating-the-storm-odd-seminar/

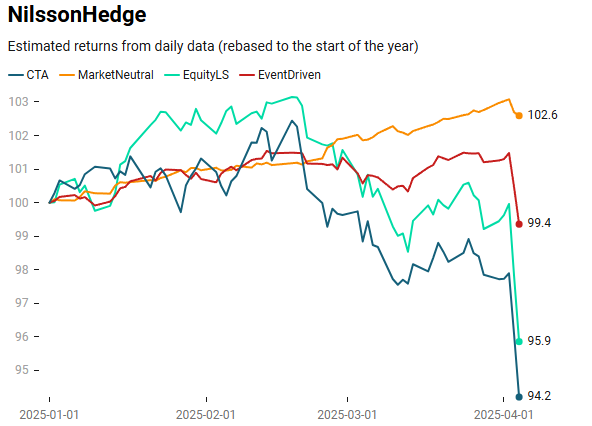
Looking across strategies in April, it seems like CTA, and especially Trend Followers, reduced equity market risk dramatically in the first few days of the correction. As the correction was ‘V’-shaped, with hindsight, this was the wrong decision. Slower strategies might have done a bit better as the frequency did not disturb the strategies.

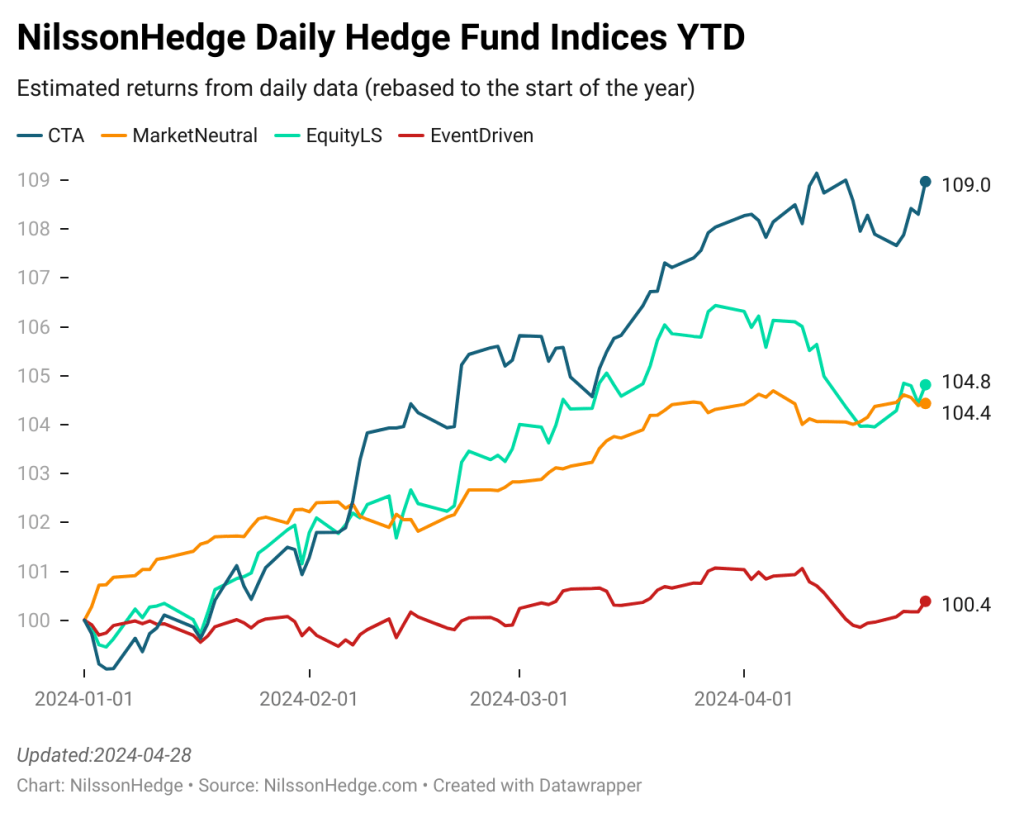
Line graph showing estimated returns from daily data for various strategies: CTA, MarketNeutral, EquityLS, and EventDriven, rebased to the start of the year, with fluctuations noted from January to May 2025.
NilssonHedge Daily Hedge Fund indices showed dramatic performance divergence

For April, based on our Daily Indices, we note that CTA diverged from the rest of the strategies that mostly kept their positions. Crypto was the exception, with some of the meme coins having dramatic positive performance.

  • Crypto: +9.3%
  • CTA: -5.2%
  • Equity LS: -0.7%
  • Event Driven: -0.1%
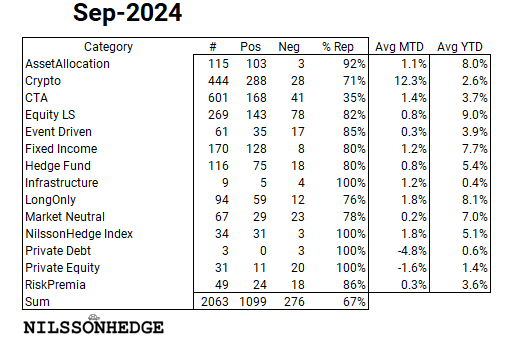
  • A table summarizing the performance of various financial strategies for April 2025, detailing the number of positive and negative outcomes, percentage representation, and average monthly and year-to-date performance.

    Acknowledging reporting biases and that we are only a few days into the month, the above results are mirrored by the daily indices, although with different magnitudes (strong results likely to be reported early). CTA at the bottom, and Crypto strategies at the top.

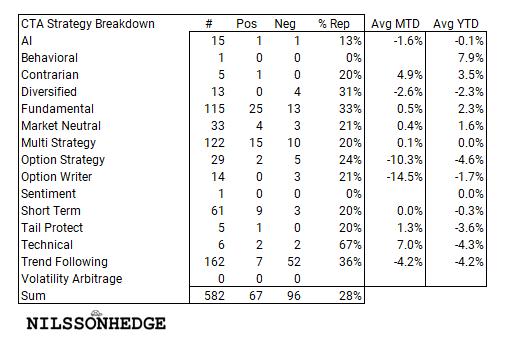
    Table displaying the breakdown of various CTA strategies, including their performance metrics such as number of positive and negative positions, average month-to-date, and year-to-date percentages.

    For CTA engaging in short volatility strategies, we saw generally negative performance with dramatic VIX spikes. We have noted that a few of the larger managers stopped reporting or shut down funds during April. Trend strategies will have a negative skew, with the results expected to decline as we get more managers.

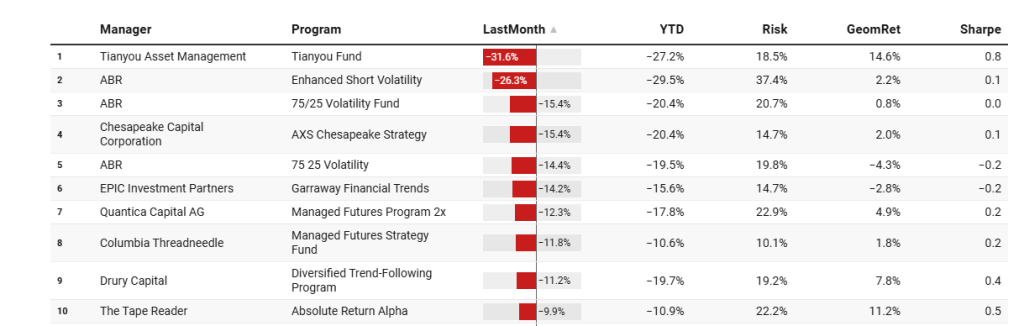
    A table showing the performance of various asset management programs for April, including manager names, program types, and percentage changes in performance.
    Table displaying performance metrics of various investment managers, including manager names, programs, last month's performance, year-to-date performance, risk levels, geometric returns, and Sharpe ratios.

    Looking at the few Managed Futures managers that have reported, we see some long volatility, tail hedge strategies, but also some of the Discretionary Macro strategies at the top of the performance rankings.

    Line graph showing the dispersion of CTA performance from January 2018 to January 2025, with lower, median, and upper lines plotted across the timeline.

    For CTA the dispersion was likely very high. And the bottom quartile manager recorded a loss that was on par with other dramatic months in the Managed Futures history. Jan 18 is still the worst over the last seven years. At least, positions are cleared out and managed are well adapted to catch on new trends as Trade Policy is further clarified.

    •  

    Navigating the Storm – ODD Seminar

    Operational Due Diligence doesn’t always sound like a particularly exciting topic. But it’s the backbone of all successful investing, especially in hedge funds. And when it’s not done well, mistakes happen. Effective ODD can help allocators sidestep all sorts of landmines, which often reveal themselves when things get stressed — like what we’re seeing now.

    A business professional in a suit is analyzing data on a tablet while seated at a desk on a boat, with stormy skies and other boats visible in the background.

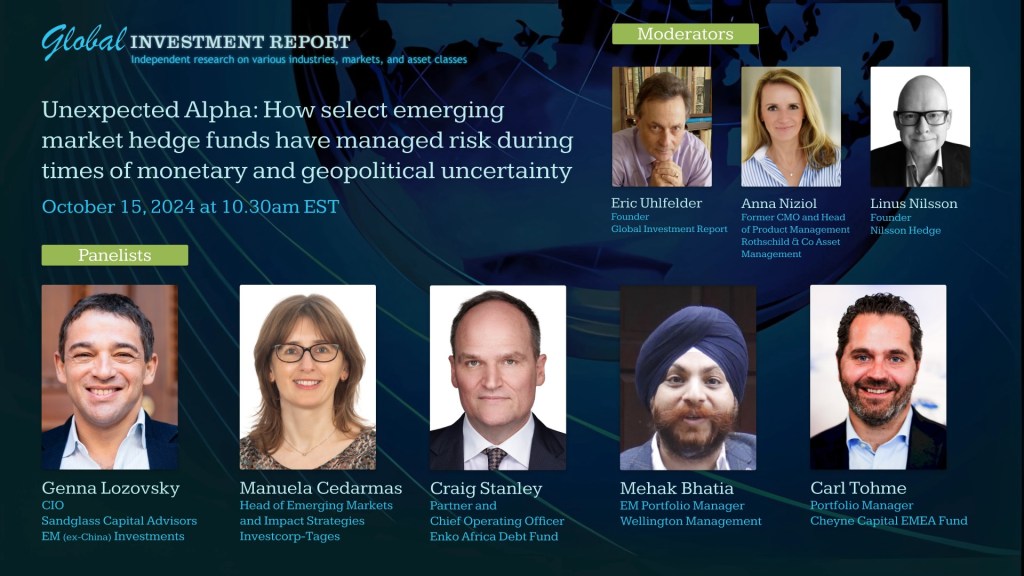
    Together with Eric Uhlfelder and Anna Niziol, we are hosting an ODD Webinar on Tuesday May 6 at 10.30 EST. We have assembled a very experienced panel of experts who don’t pull their punches.

    This group includes Olga Romanova, Director and Head of Operational Due Diligence at A&C Advisors LLC. Previously she held key operational rolls at GAM, AXA, and IAM.

    Matthew Stiling, a senior ODD analyst at Investcorp-Tages, previously worked at Kedge Capital, CQS, TwentyFour Asset Management, and Wells Fargo.

    And Nadia Salih, senior ODD analyst at Kedge Capital, worked for Cardona (now Mercer), Marwyn Capital, and GSA Capital.

    Hope you can join! Sign up here: https://streamyard.com/watch/FUSZjHbwXDyu

    •  

    Top 5 / Worst 5 Hedge Fund Strategy March 2025

    March Performance may not matter that much anymore; the defining moment will be April’s performance. For CTAs, gold-focused strategies have shone, while the average Trend-Following strategy has performed negatively. We also note several large names on the top five list.

    CTA

    Crescat Capital : Long/Short Fund  :  25.90% [13.42]<br> Moddco Capital Associates : MCA  :  21.32% [0.11]<br> Quantitative Investment Management : Global Program 3x  :  21.08% [50.75]<br> AIS Capital Management : MAAP 3-6X  :  18.56% [72.06]<br> Typhon Capital Management : Vulcan Metals Ultra Strategy  :  16.94% [0.00]<br> QTS Capital Management : Phoenix Strategy  :  -9.43% [3.00]<br> Gnomon Alpha : Global Macro Enhanced 4  :  -9.98% [60.35]<br> Simplify Asset Management : Volatility Premium  :  -10.38% [999.59]<br> Finaltis : Cyril Systematic Strategy  :  -13.23% [6.00]<br> Vivienne Investissement : MACH 3  :  -20.10% [7.76]<br> >
    Crescat Capital : Long/Short Fund  :  25.90% [13.42]<br> Crescat Capital : Precious Metals Fund  :  12.40% [121.56]<br> Vigo Capital : Fund  :  12.79% [2.06]<br> AIS Capital Management : MAAP 3-6X  :  18.56% [72.06]<br> Friedberg Mercantile Group : Global Macro Hedge Fund  :  13.80% [385.69]<br> Gnomon Alpha : Global Macro Enhanced 3  :  -7.46% [60.25]<br> Gnomon Alpha : Global Macro Enhanced 4  :  -9.98% [60.35]<br> Transtrend BV : Tulip Trend Fund  :  -3.80% [93.55]<br> Melissinos Trading : Eupatrid Commodity  :  -7.85% [10.00]<br> Moddco Capital Associates : MCA  :  21.32% [0.11]<br> >

    To explore the full list of CTAs and their rankings, including dynamic updates as new data becomes available, we invite you to visit our website at the Link provided.

    Market Neutral

    Campbell & Company : Campbell Quantitative Equities Portfolio  :  4.40% [0.00]<br> RAM : Long Short Global  :  3.11% [14.42]<br> Amber Capital : Equity Fund (UCITS)  :  2.98% [36.27]<br> Analytic Investors : Analytic US Equity Market Neutral  :  2.88% [2.07]<br> Fulcrum Asset Management : Thematic Equity Market  :  2.81% [389.30]<br> Blackrock : European Absolute Return  :  -3.24% [680.59]<br> Neo Ivy Capital Management : Neo Ivy  :  -4.50% [0.00]<br> Desjardins Global Asset Management : Alt Long Short Global Equity Market ETF  :  -4.92% [28.39]<br> Formula Growth Limited : Growth Alpha  :  -5.70% [10.80]<br> Grand Alliance Asset Management : Sino Vision Greater China Market Neutral  :  -7.22% [612.15]<br> >
    AQR Capital Management : Adaptive Equity Market Neutral  :  2.42% [404.17]<br> AQR Capital Management : Equity Market Neutral  :  2.04% [1200.00]<br> MQS Management : Equity Market Neutral Strategy  :  2.68% [60.00]<br> PIMCO : PIMCO RAE Fundamental Advantage PLUS  :  1.92% [0.00]<br> Campbell & Company : Campbell Quantitative Equities Portfolio  :  4.40% [0.00]<br> Scopia Capital Management : Market Neutral  :  -0.54% [45.04]<br> Desjardins Global Asset Management : Alt Long Short Global Equity Market ETF  :  -4.92% [28.39]<br> Formula Growth Limited : Growth Alpha  :  -5.70% [10.80]<br> Grand Alliance Asset Management : Sino Vision Greater China Market Neutral  :  -7.22% [612.15]<br> Neo Ivy Capital Management : Neo Ivy  :  -4.50% [0.00]<br> >

    To explore the full list of Market Neutral strategies and their rankings, including dynamic updates as new data becomes available, we invite you to visit our website at the Link provided.

    Equity Long Short

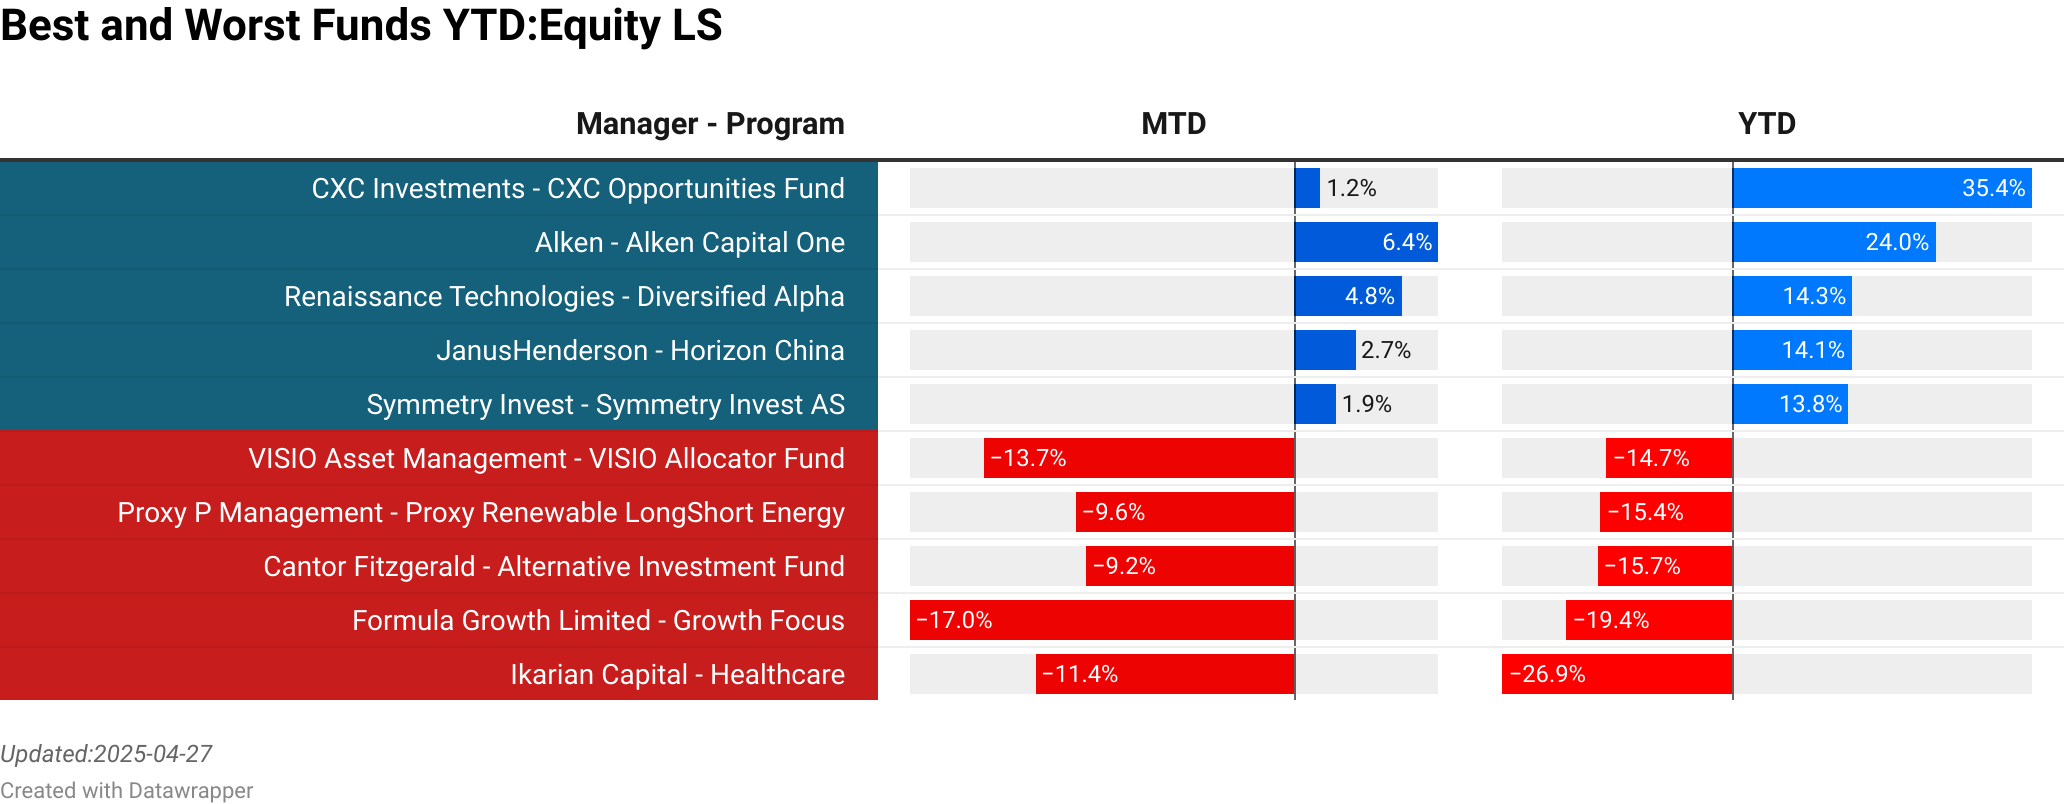
    EDL Capital : Global Opportunities Fund  :  14.19% [1079.00]<br> Quantitative Investment Management : Tactical Fund  :  11.35% [422.18]<br> Fidelity : Global Contrarian Long Short  :  8.47% [9.03]<br> Hussman : Hussman Strategic Growth  :  8.30% [0.00]<br> Forester : Forester Value  :  7.47% [0.00]<br> Pershing square : Pershing Square  :  -12.21% [0.00]<br> Polar Capital : Polar Global Technology Fund  :  -12.26% [5731.30]<br> Taika Capital : Taika Capital  :  -13.49% [0.57]<br> VISIO Asset Management : VISIO Allocator Fund  :  -13.72% [108.00]<br> Formula Growth Limited : Growth Focus  :  -17.00% [42.70]<br> >
    CXC Investments : CXC Opportunities Fund  :  1.20% [3.66]<br> Alken : Alken Capital One  :  6.43% [159.59]<br> EDL Capital : Global Opportunities Fund  :  14.19% [1079.00]<br> Renaissance Technologies : Diversified Alpha  :  4.78% [3531.60]<br> JanusHenderson : Horizon China  :  2.73% [41.77]<br> VISIO Asset Management : VISIO Allocator Fund  :  -13.72% [108.00]<br> Proxy P Management : Proxy Renewable LongShort Energy  :  -9.64% [0.00]<br> Cantor Fitzgerald : Alternative Investment Fund  :  -9.18% [185.13]<br> Formula Growth Limited : Growth Focus  :  -17.00% [42.70]<br> Ikarian Capital : Healthcare  :  -11.43% [271.60]<br> >

    To explore the full list of Equity Long Short strategies and their rankings, including dynamic updates as new data becomes available, we invite you to visit our website at the Link provided.

    Event Driven

    EDL Capital : Global Opportunities Fund  :  14.19% [1079.00]<br> Quantitative Investment Management : Tactical Fund  :  11.35% [422.18]<br> Fidelity : Global Contrarian Long Short  :  8.47% [9.03]<br> Hussman : Hussman Strategic Growth  :  8.30% [0.00]<br> Forester : Forester Value  :  7.47% [0.00]<br> Pershing square : Pershing Square  :  -12.21% [0.00]<br> Polar Capital : Polar Global Technology Fund  :  -12.26% [5731.30]<br> Taika Capital : Taika Capital  :  -13.49% [0.57]<br> VISIO Asset Management : VISIO Allocator Fund  :  -13.72% [108.00]<br> Formula Growth Limited : Growth Focus  :  -17.00% [42.70]<br> >
    CXC Investments : CXC Opportunities Fund  :  1.20% [3.66]<br> Alken : Alken Capital One  :  6.43% [159.59]<br> EDL Capital : Global Opportunities Fund  :  14.19% [1079.00]<br> Renaissance Technologies : Diversified Alpha  :  4.78% [3531.60]<br> JanusHenderson : Horizon China  :  2.73% [41.77]<br> VISIO Asset Management : VISIO Allocator Fund  :  -13.72% [108.00]<br> Proxy P Management : Proxy Renewable LongShort Energy  :  -9.64% [0.00]<br> Cantor Fitzgerald : Alternative Investment Fund  :  -9.18% [185.13]<br> Formula Growth Limited : Growth Focus  :  -17.00% [42.70]<br> Ikarian Capital : Healthcare  :  -11.43% [271.60]<br> >

    To explore the full list of Event Driven strategies and their rankings, including dynamic updates as new data becomes available, we invite you to visit our website at the Link provided.

    Fixed Income

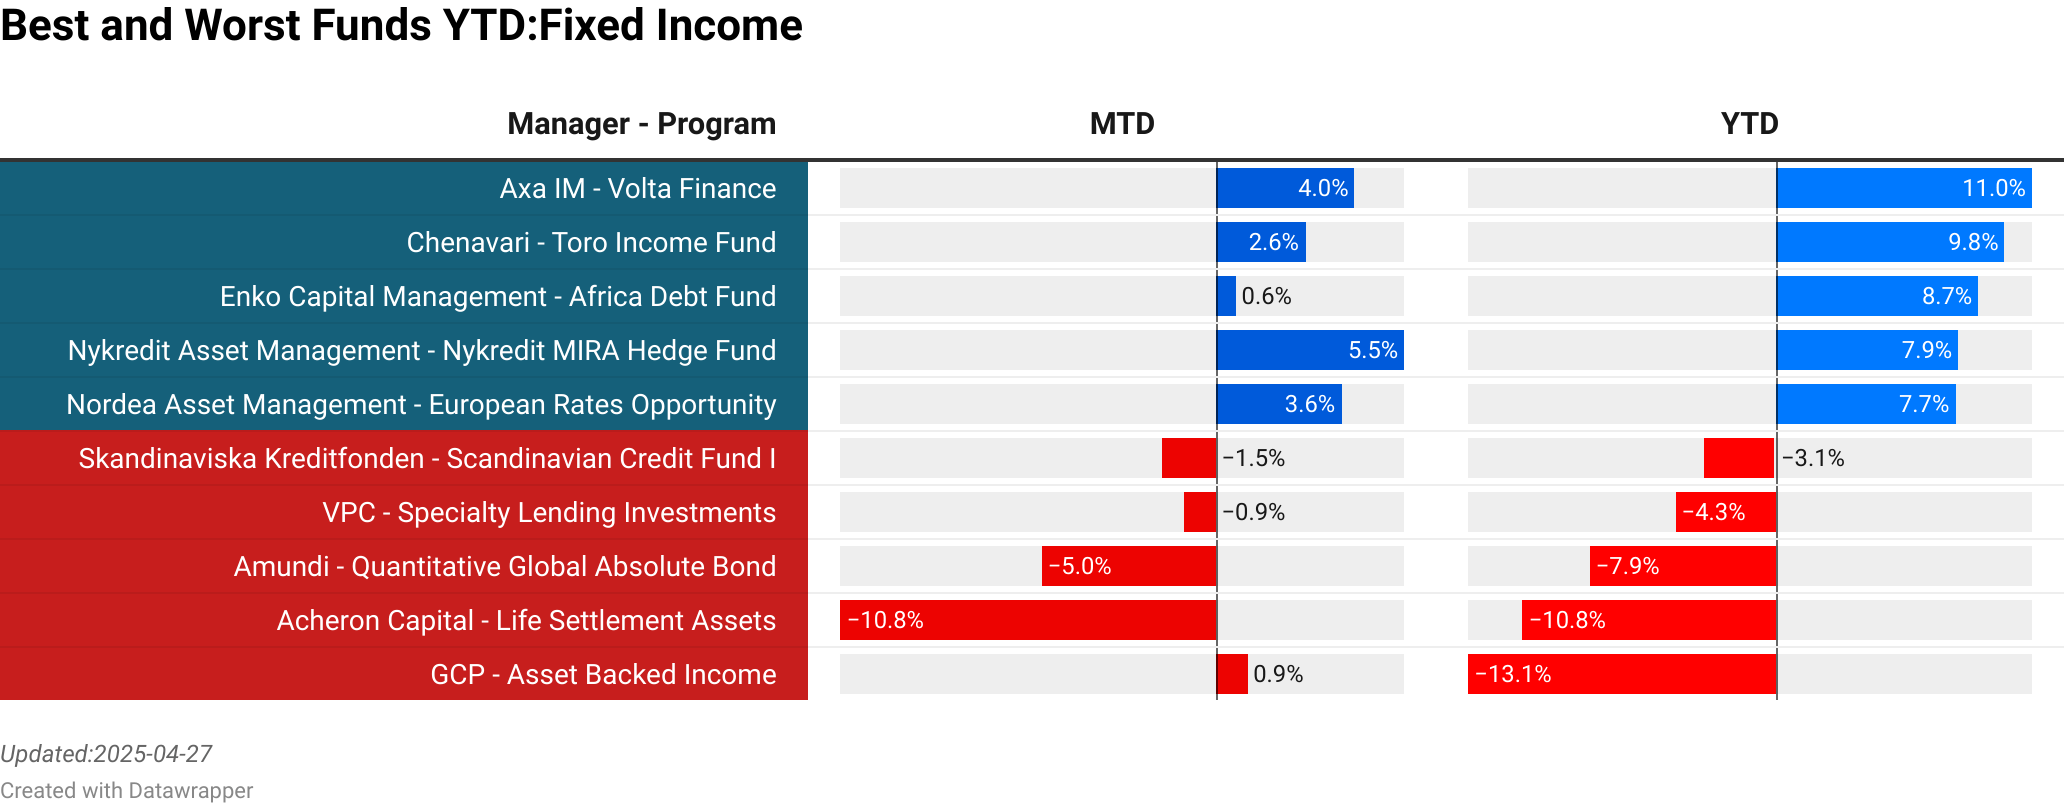
    Nykredit Asset Management : Nykredit MIRA Hedge Fund  :  5.45% [53.40]<br> EJF Investments : Event Driven  :  4.18% [0.00]<br> Axa IM : Volta Finance  :  4.01% [0.00]<br> Petersen & Partners Investment Management : PPIM Core Fixed Income  :  3.73% [124.00]<br> Nordea Asset Management : European Rates Opportunity  :  3.63% [387.60]<br> Tenax : ILS Ucits Fund  :  -2.69% [118.42]<br> Boussard Gavaudan : Convertible  :  -2.76% [49.61]<br> Capital Four Management : Capital Four Credit Opportunities Fund  :  -3.43% [278.40]<br> Amundi : Quantitative Global Absolute Bond  :  -5.01% [61.23]<br> Acheron Capital : Life Settlement Assets  :  -10.81% [0.00]<br> >
    Axa IM : Volta Finance  :  4.01% [0.00]<br> Chenavari : Toro Income Fund  :  2.58% [0.00]<br> Enko Capital Management : Africa Debt Fund  :  0.58% [1020.00]<br> Nykredit Asset Management : Nykredit MIRA Hedge Fund  :  5.45% [53.40]<br> Nordea Asset Management : European Rates Opportunity  :  3.63% [387.60]<br> Skandinaviska Kreditfonden : Scandinavian Credit Fund I  :  -1.52% [0.40]<br> VPC : Specialty Lending Investments  :  -0.88% [0.00]<br> Amundi : Quantitative Global Absolute Bond  :  -5.01% [61.23]<br> Acheron Capital : Life Settlement Assets  :  -10.81% [0.00]<br> GCP : Asset Backed Income  :  0.91% [0.00]<br> >

    To explore the full list of Event Driven strategies and their rankings, including dynamic updates as new data becomes available, we invite you to visit our website at the Link provided.

    Risk Premia

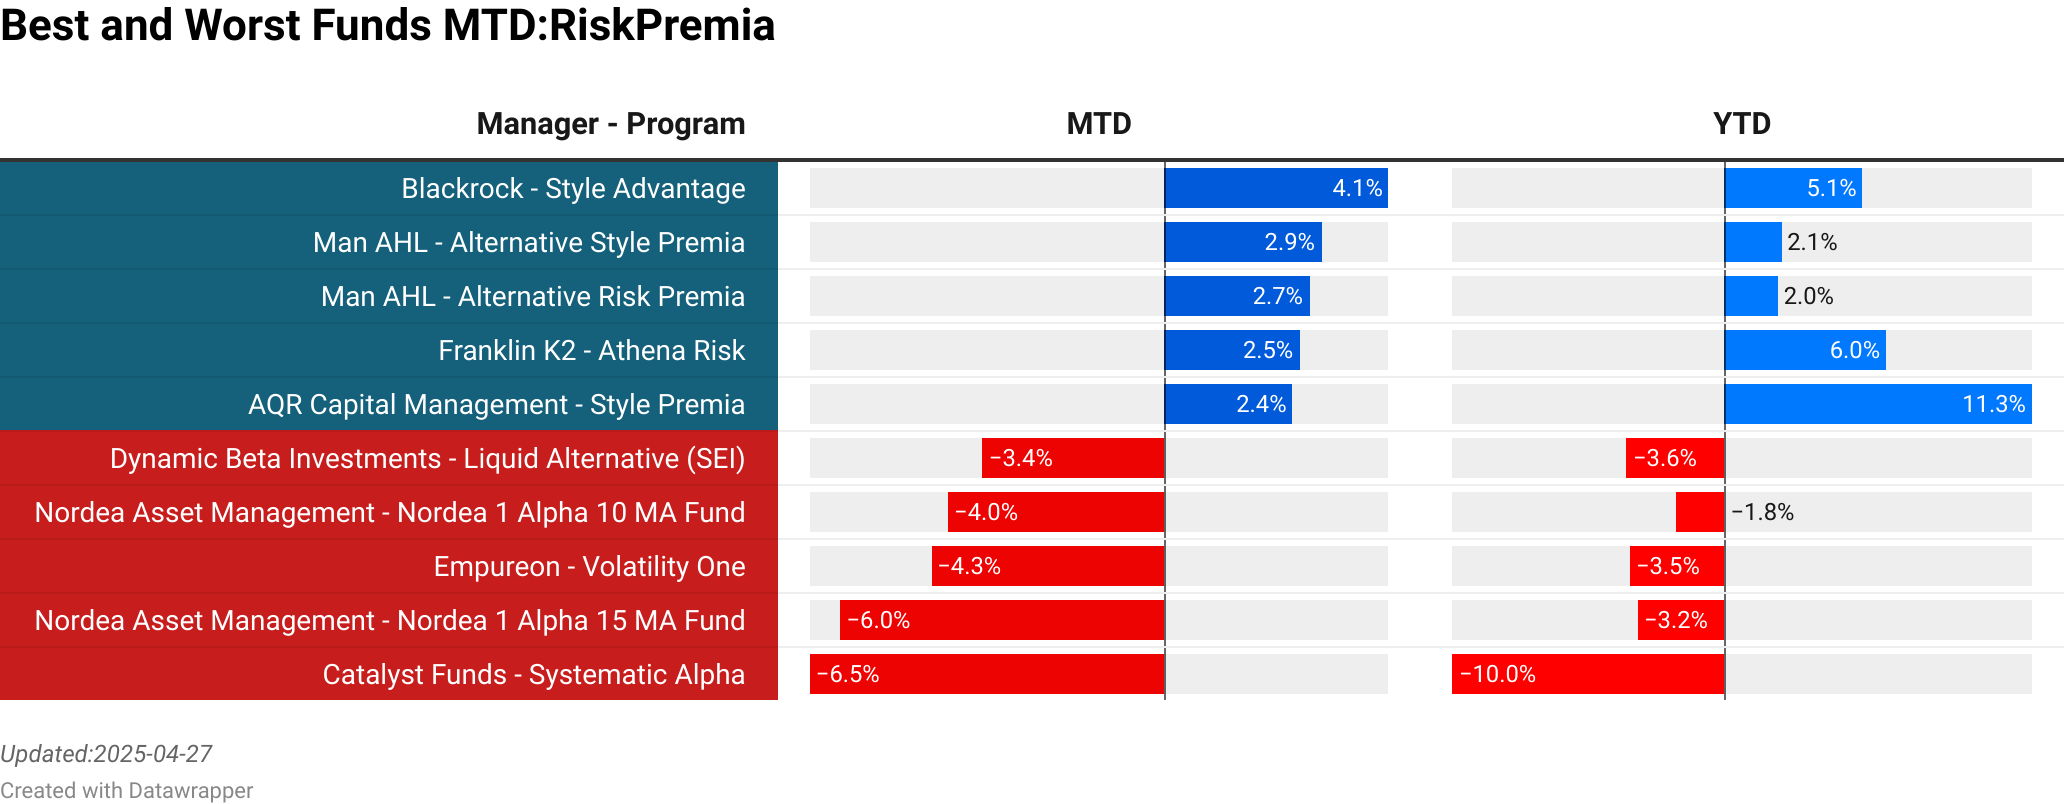
    Blackrock : Style Advantage  :  4.13% [136.89]<br> Man AHL : Alternative Style Premia  :  2.88% [302.12]<br> Man AHL : Alternative Risk Premia  :  2.66% [2543.72]<br> Franklin K2 : Athena Risk  :  2.48% [95.14]<br> AQR Capital Management : Style Premia  :  2.35% [336.01]<br> Dynamic Beta Investments : Liquid Alternative (SEI)  :  -3.35% [1431.97]<br> Nordea Asset Management : Nordea 1  Alpha 10 MA Fund  :  -3.99% [2588.65]<br> Empureon : Volatility One  :  -4.30% [400.32]<br> Nordea Asset Management : Nordea 1  Alpha 15 MA Fund  :  -5.97% [2359.87]<br> Catalyst Funds : Systematic Alpha  :  -6.53% [0.00]<br> >
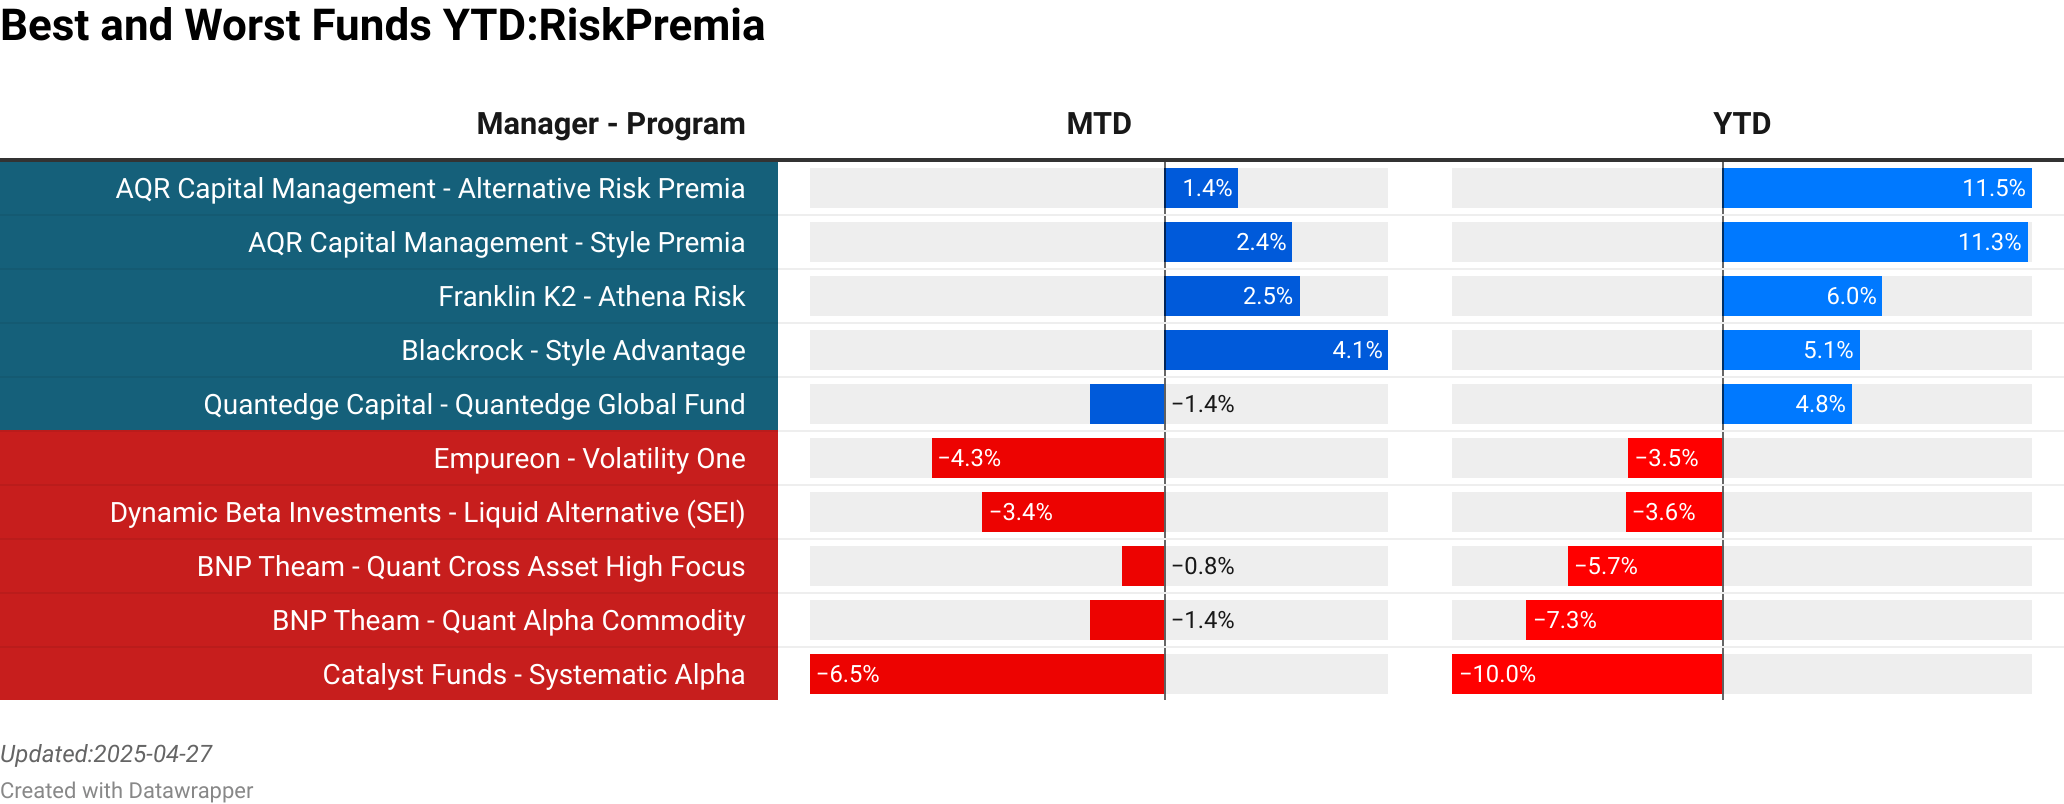
    AQR Capital Management : Alternative Risk Premia  :  1.36% [0.00]<br> AQR Capital Management : Style Premia  :  2.35% [336.01]<br> Franklin K2 : Athena Risk  :  2.48% [95.14]<br> Blackrock : Style Advantage  :  4.13% [136.89]<br> Quantedge Capital : Quantedge Global Fund  :  -1.38% [4439.92]<br> Empureon : Volatility One  :  -4.30% [400.32]<br> Dynamic Beta Investments : Liquid Alternative (SEI)  :  -3.35% [1431.97]<br> BNP Theam : Quant Cross Asset High Focus  :  -0.79% [582.23]<br> BNP Theam : Quant Alpha Commodity  :  -1.39% [72.48]<br> Catalyst Funds : Systematic Alpha  :  -6.53% [0.00]<br> >

    To explore the full list of Risk Premia strategies and their rankings, including dynamic updates as new data becomes available, we invite you to visit our website at the Link provided.

    Crypto Strategies

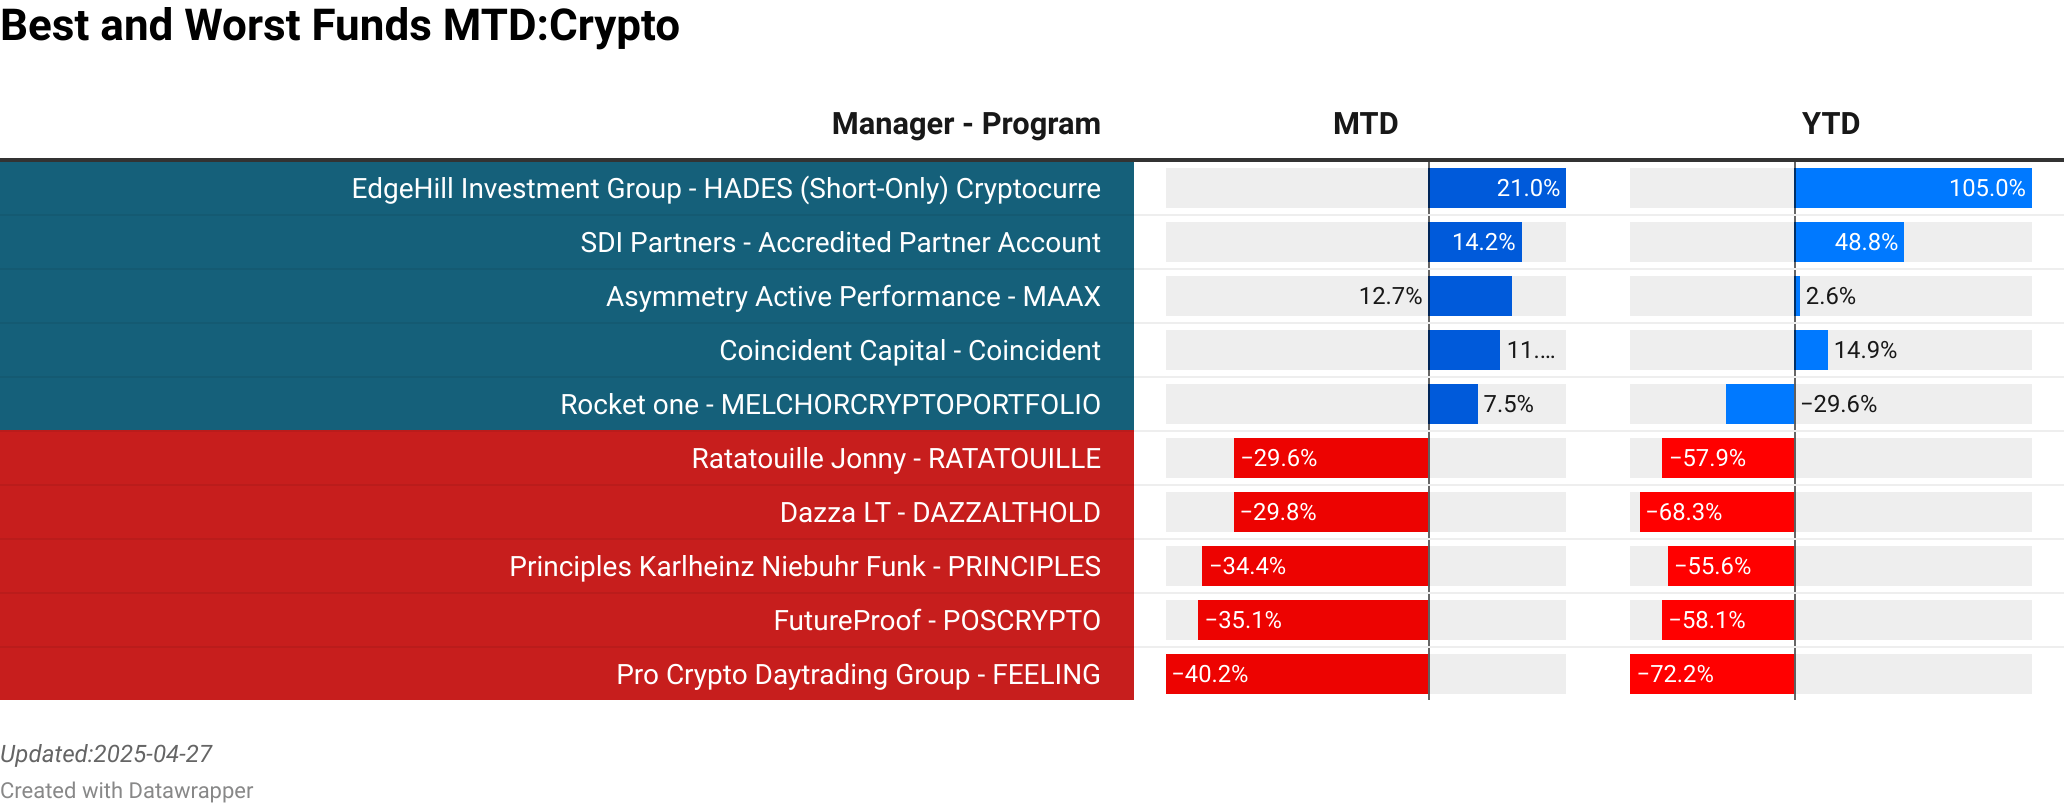
    EdgeHill Investment Group : HADES (Short-Only) Cryptocurrency Strat  :  21.04% [11.60]<br> SDI Partners : Accredited Partner Account  :  14.19% [630.74]<br> Asymmetry Active Performance : MAAX  :  12.74% [0.00]<br> Coincident Capital : Coincident  :  11.00% [400.00]<br> Rocket one : MELCHORCRYPTOPORTFOLIO  :  7.46% [0.00]<br> Ratatouille Jonny : RATATOUILLE  :  -29.64% [0.00]<br> Dazza LT : DAZZALTHOLD  :  -29.75% [0.00]<br> Principles Karlheinz Niebuhr Funk : PRINCIPLES  :  -34.39% [0.00]<br> FutureProof : POSCRYPTO  :  -35.06% [0.00]<br> Pro Crypto Daytrading Group : FEELING  :  -40.15% [0.00]<br> >
    EdgeHill Investment Group : HADES (Short-Only) Cryptocurrency Strat  :  21.04% [11.60]<br> SDI Partners : Accredited Partner Account  :  14.19% [630.74]<br> Fore Elite Capital Management : ForeElite Flagship Fund  :  7.20% [168.24]<br> Coincident Capital : Coincident  :  11.00% [400.00]<br> PL Digital Management Pte : Presto Digital Fund  :  1.87% [43.30]<br> Digital Gold Crypto : DIGITALGOLD  :  -11.65% [0.00]<br> Ape Capital : RIIKODC  :  -11.66% [0.00]<br> TitaniumStrategy Titanium : JASMYSTRATEGY  :  -22.93% [0.00]<br> Dazza LT : DAZZALTHOLD  :  -29.75% [0.00]<br> Pro Crypto Daytrading Group : FEELING  :  -40.15% [0.00]<br> >

    To explore the full list of Risk Premia strategies and their rankings, including dynamic updates as new data becomes available, we invite you to visit our website at the Link provided.

    •  

    Trade Tariffs and CTA Impact

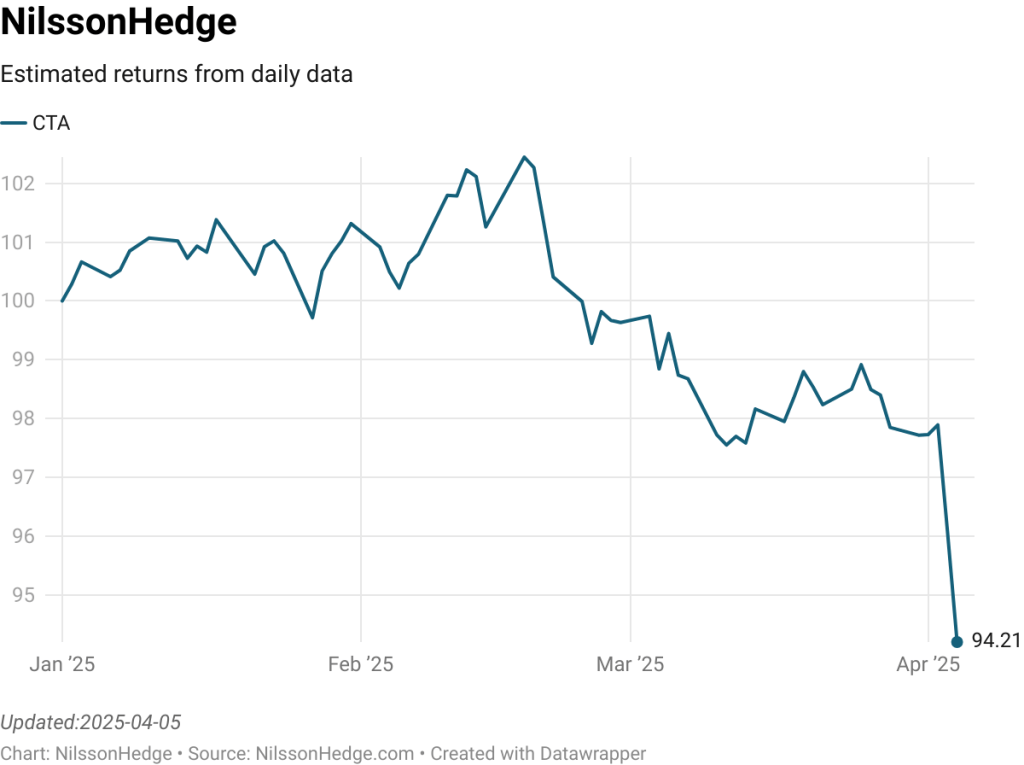
    Over the last couple of days, for obvious reasons, there have been many significant market moves. Equities and Bond yields are down massively, as markets are pricing in increasing odds of a US/Global recession. So far, it looks bleak for Trend Followers, somewhat reminiscent of the Covid Crash. Dispersion will be high in April, where stops, trading frequency, and sector allocation will determine the outcome.

    One can argue as the Trend Following space has moved to longer time frames, the daily immediate response to a crisis is no longer there.

    Pretty much all hedge fund strategies have taken a beating in the current market environment.

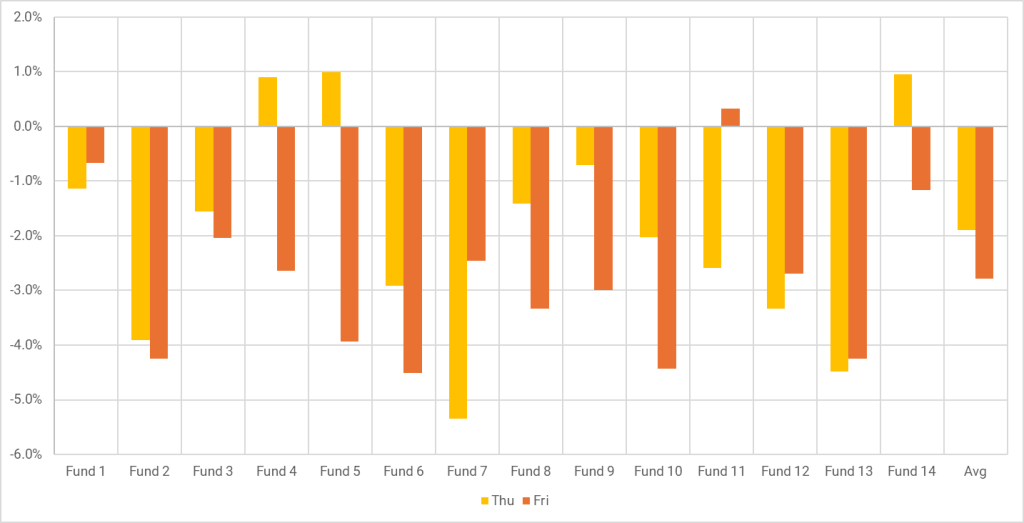
    We have limited fund data so far, but as part of the universe that we observe, both Thursday and Friday look to have been difficult for trend-biased managers. Both days were characterized by large equity moves, but also some truly large moves in Currencies (i.e. the Swiss France, and the Australian Dollar) and Commodities (e.g. Crude Oil on the back of OPEC).

    We estimate that CTAs (here low risk trend) are down 3.6% for the month, and down 5.8% for the year, including Friday the 4th. There is clearly a lot of month left, and if markets continue to sell off, there is certainly some profit potential from trends.

    Looking at individual CTA managers for Thu/Fri, very few of them managed to come out positive. Any trader making money over the two days is above average.

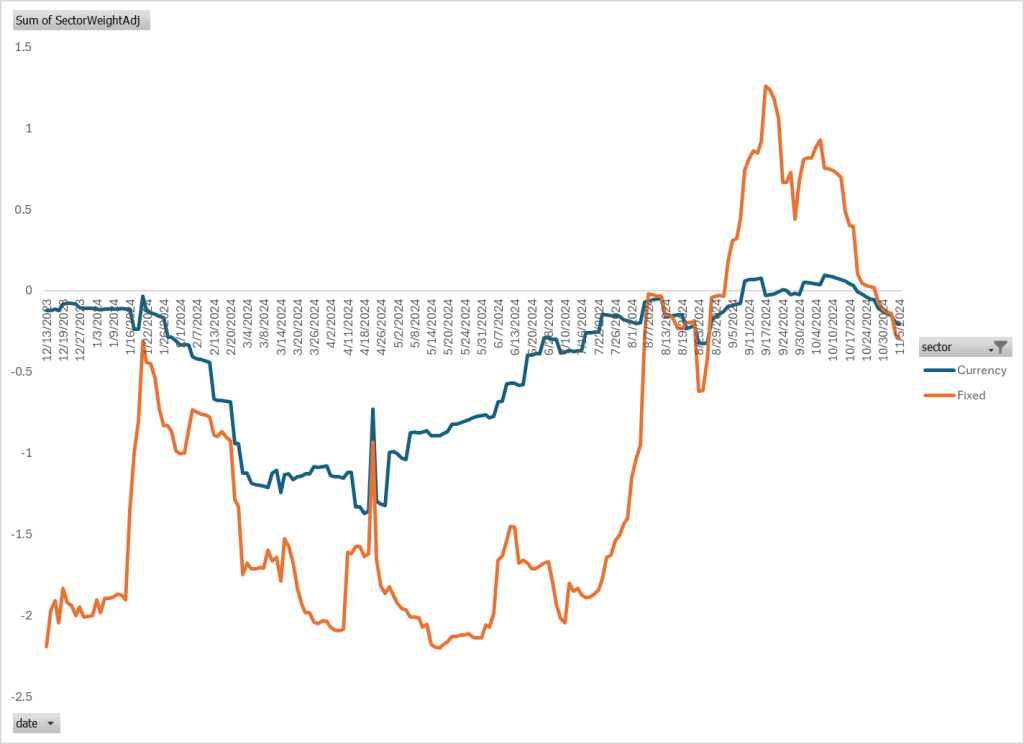
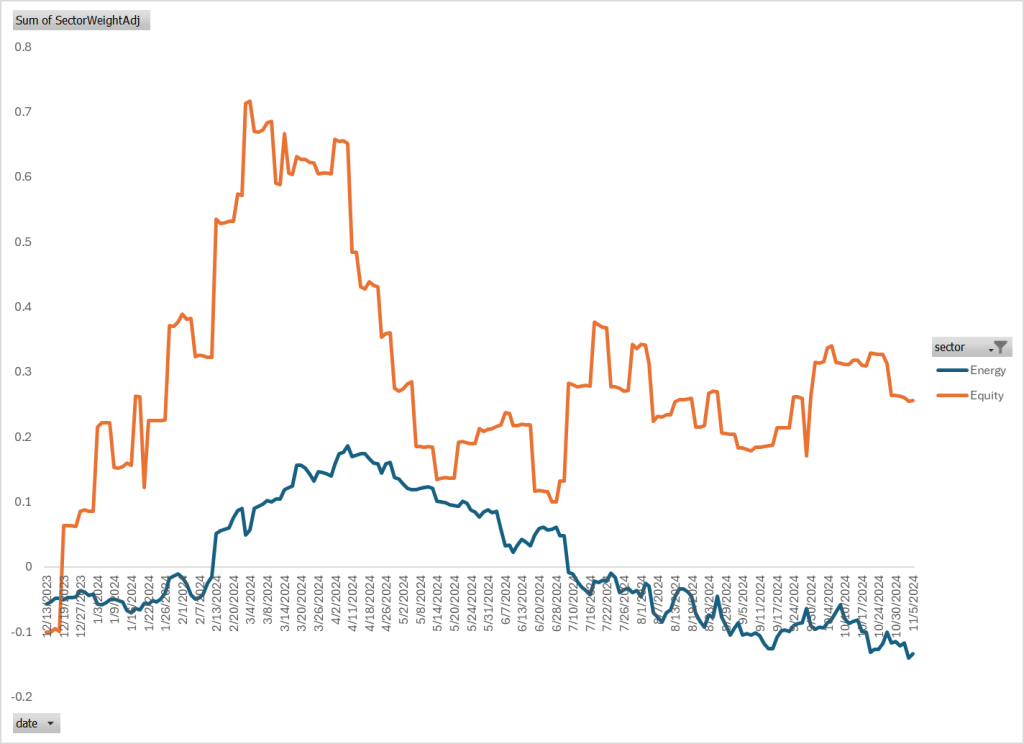
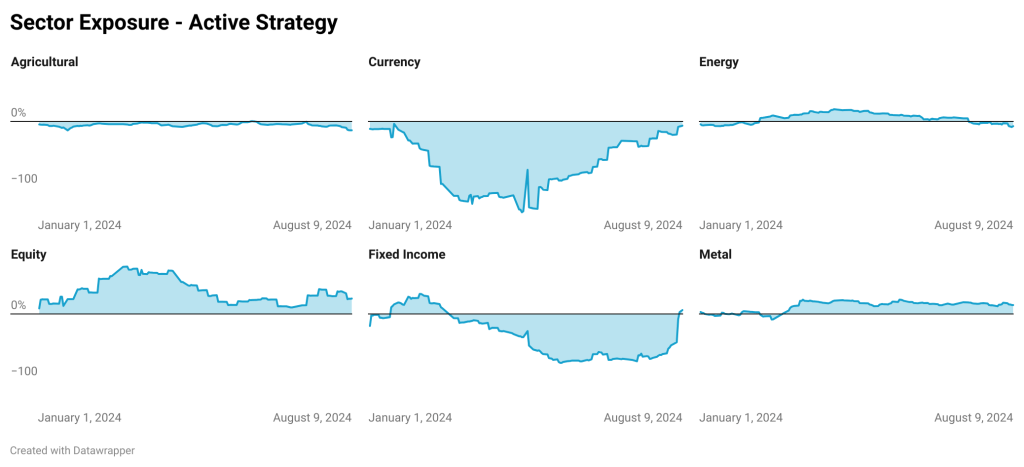
    Looking at sector data, we note that CTA got the right positions in Fixed Income, but wrong-footed in Equities and Currencies. Equity exposure has trended down but was still long about 10% on Friday’s close. Fixed Income exposure was too low to offset anything significantly.

    Should you wish to follow the drama on the Global Markets and the impact on liquid Hedge Funds, please have a look at our daily indices. It is free to download and use.

    •  

    Best’n’Worst Feb 2025

    Based on the most recent return data that we have available, we can provide a comprehensive overview of the top-performing and bottom-performing strategies for each category, taking into account both monthly and yearly results. Our analysis is based on proprietary composite data streams that we have compiled, but we must note that there is always the possibility of errors or inaccuracies in our calculations. Double check your numbers before taking that victory lap.

    CTA

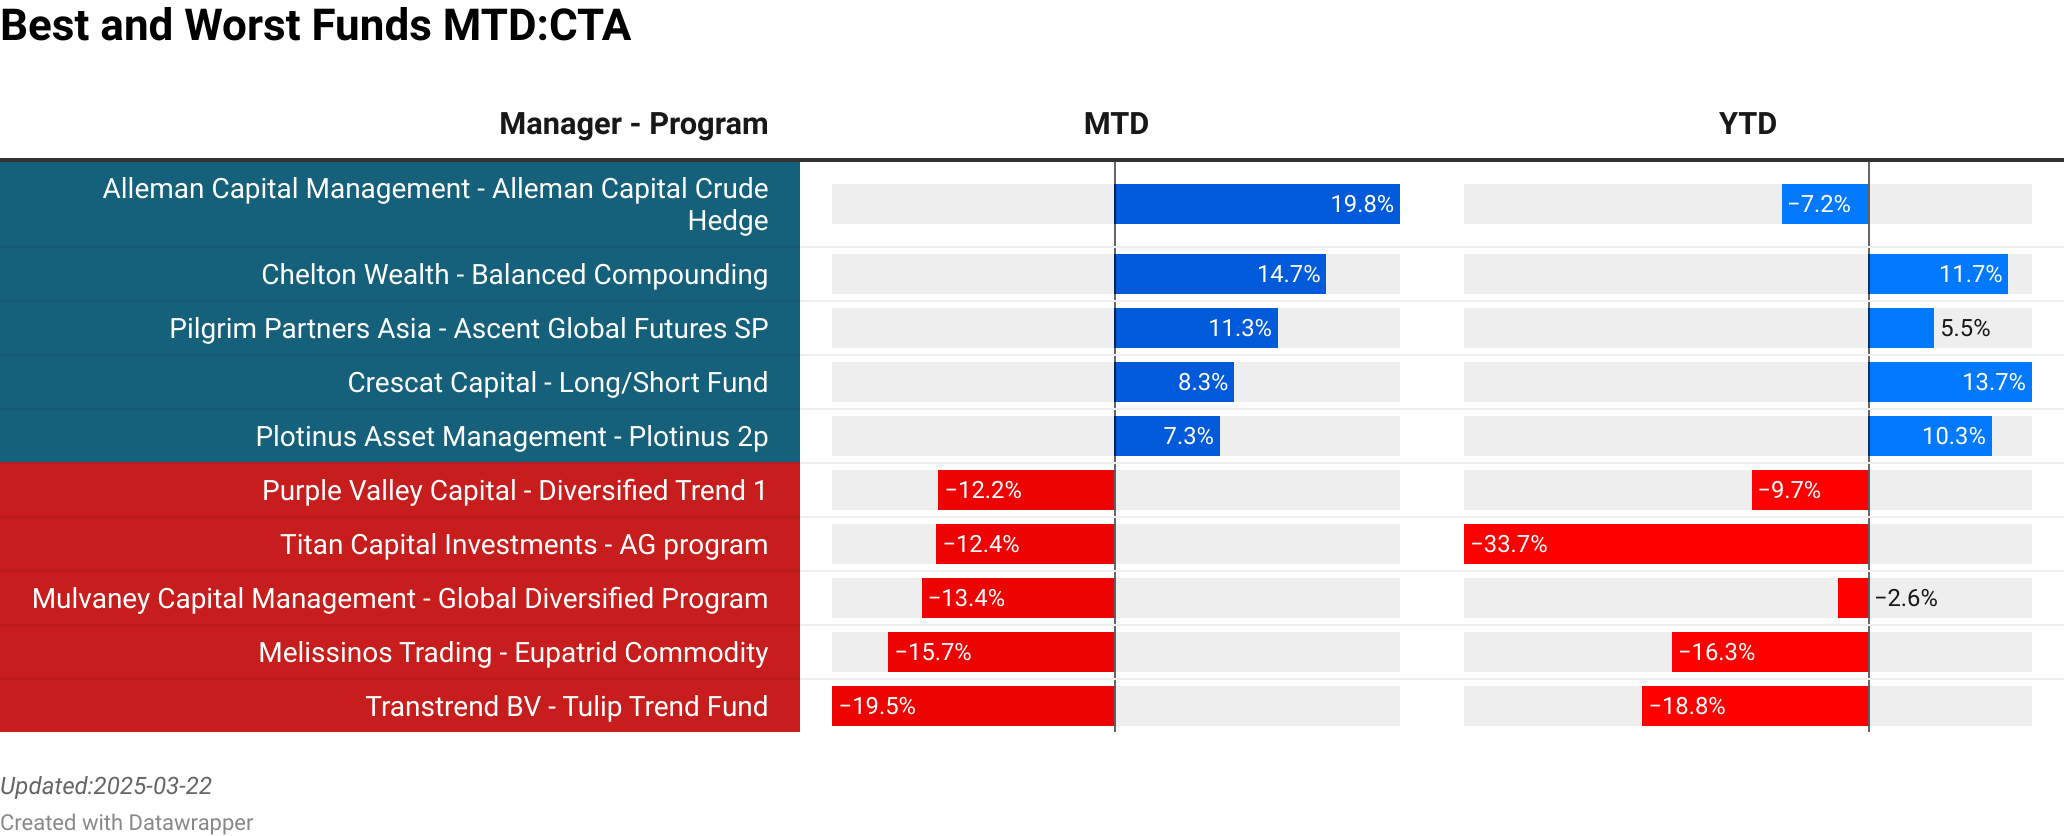
    Alleman Capital Management : Alleman Capital Crude Hedge  :  19.78% [0.07]<br> Chelton Wealth : Balanced Compounding  :  14.68% [38.40]<br> Pilgrim Partners Asia : Ascent Global Futures SP  :  11.31% [12.24]<br> Crescat Capital : Long/Short Fund  :  8.30% [12.88]<br> Plotinus Asset Management : Plotinus 2p  :  7.29% [1.53]<br> Purple Valley Capital : Diversified Trend 1  :  -12.20% [10.00]<br> Titan Capital Investments : AG program  :  -12.35% [0.81]<br> Mulvaney Capital Management : Global Diversified Program  :  -13.36% [349.00]<br> Melissinos Trading : Eupatrid Commodity  :  -15.67% [10.00]<br> Transtrend BV : Tulip Trend Fund  :  -19.53% [95.62]<br> >
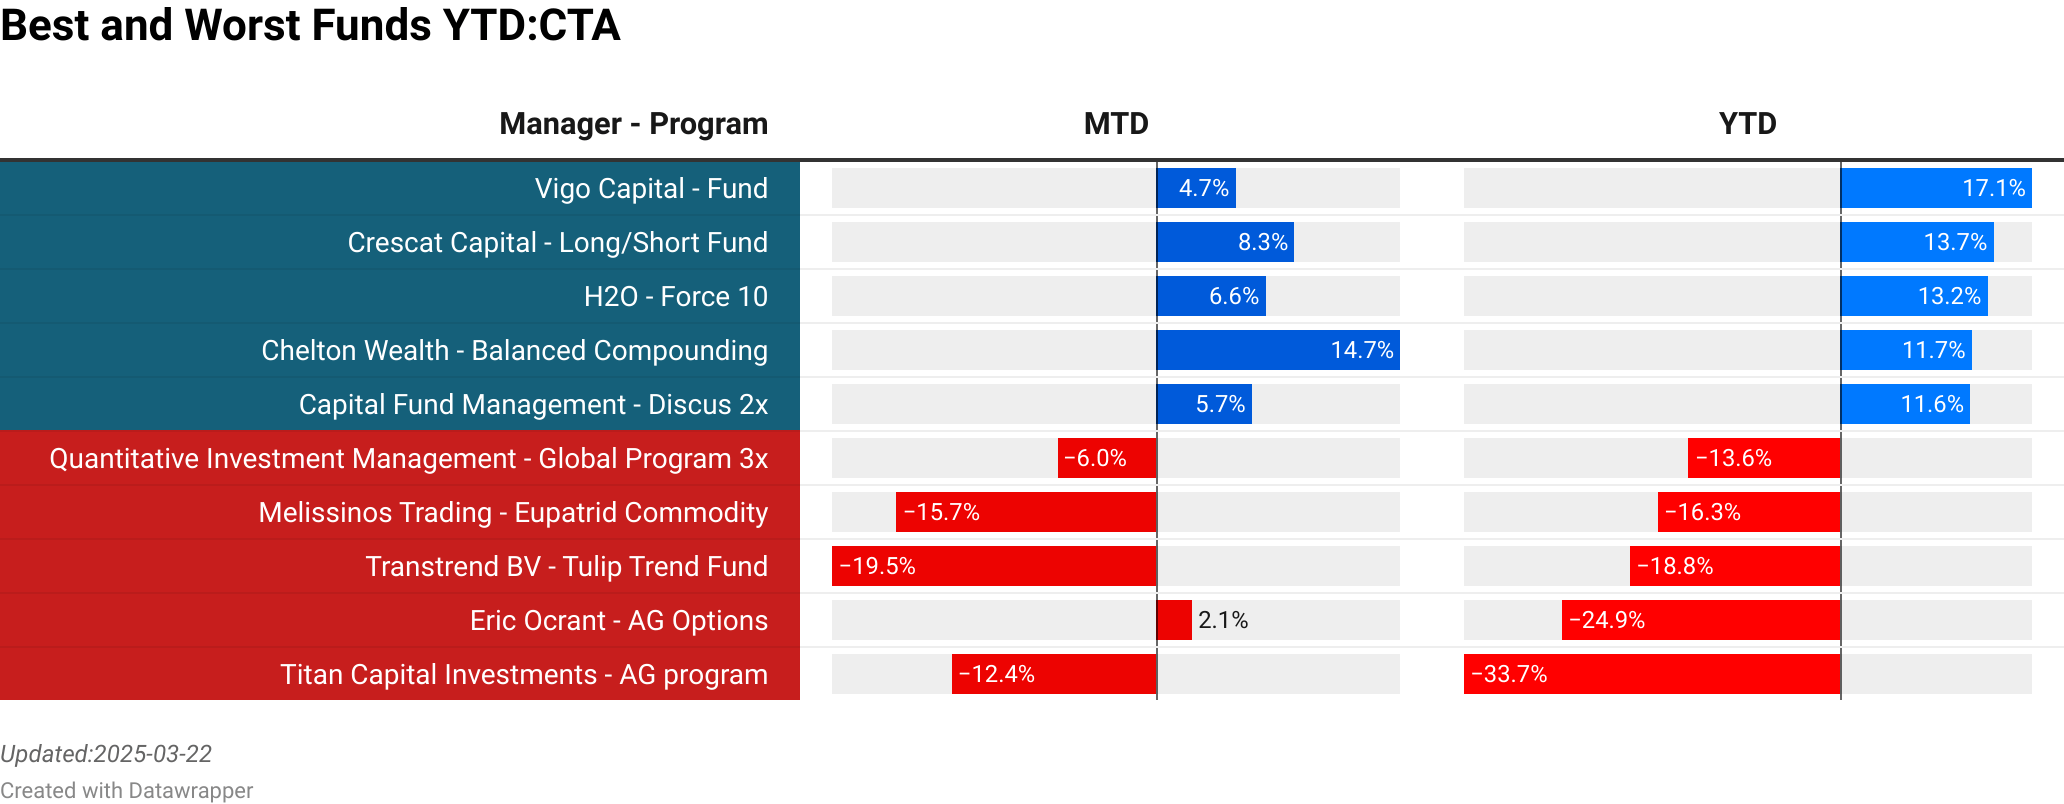
    Vigo Capital : Fund  :  4.74% [1.92]<br> Crescat Capital : Long/Short Fund  :  8.30% [12.88]<br> H2O : Force 10  :  6.55% [0.41]<br> Chelton Wealth : Balanced Compounding  :  14.68% [38.40]<br> Capital Fund Management : Discus 2x  :  5.73% [148.80]<br> Quantitative Investment Management : Global Program 3x  :  -6.01% [41.00]<br> Melissinos Trading : Eupatrid Commodity  :  -15.67% [10.00]<br> Transtrend BV : Tulip Trend Fund  :  -19.53% [95.62]<br> Eric Ocrant : AG Options  :  2.14% [0.05]<br> Titan Capital Investments : AG program  :  -12.35% [0.81]<br> >

    To explore the full list of CTAs and their rankings, including dynamic updates as new data becomes available, we invite you to visit our website at the Link provided.

    Market Neutral

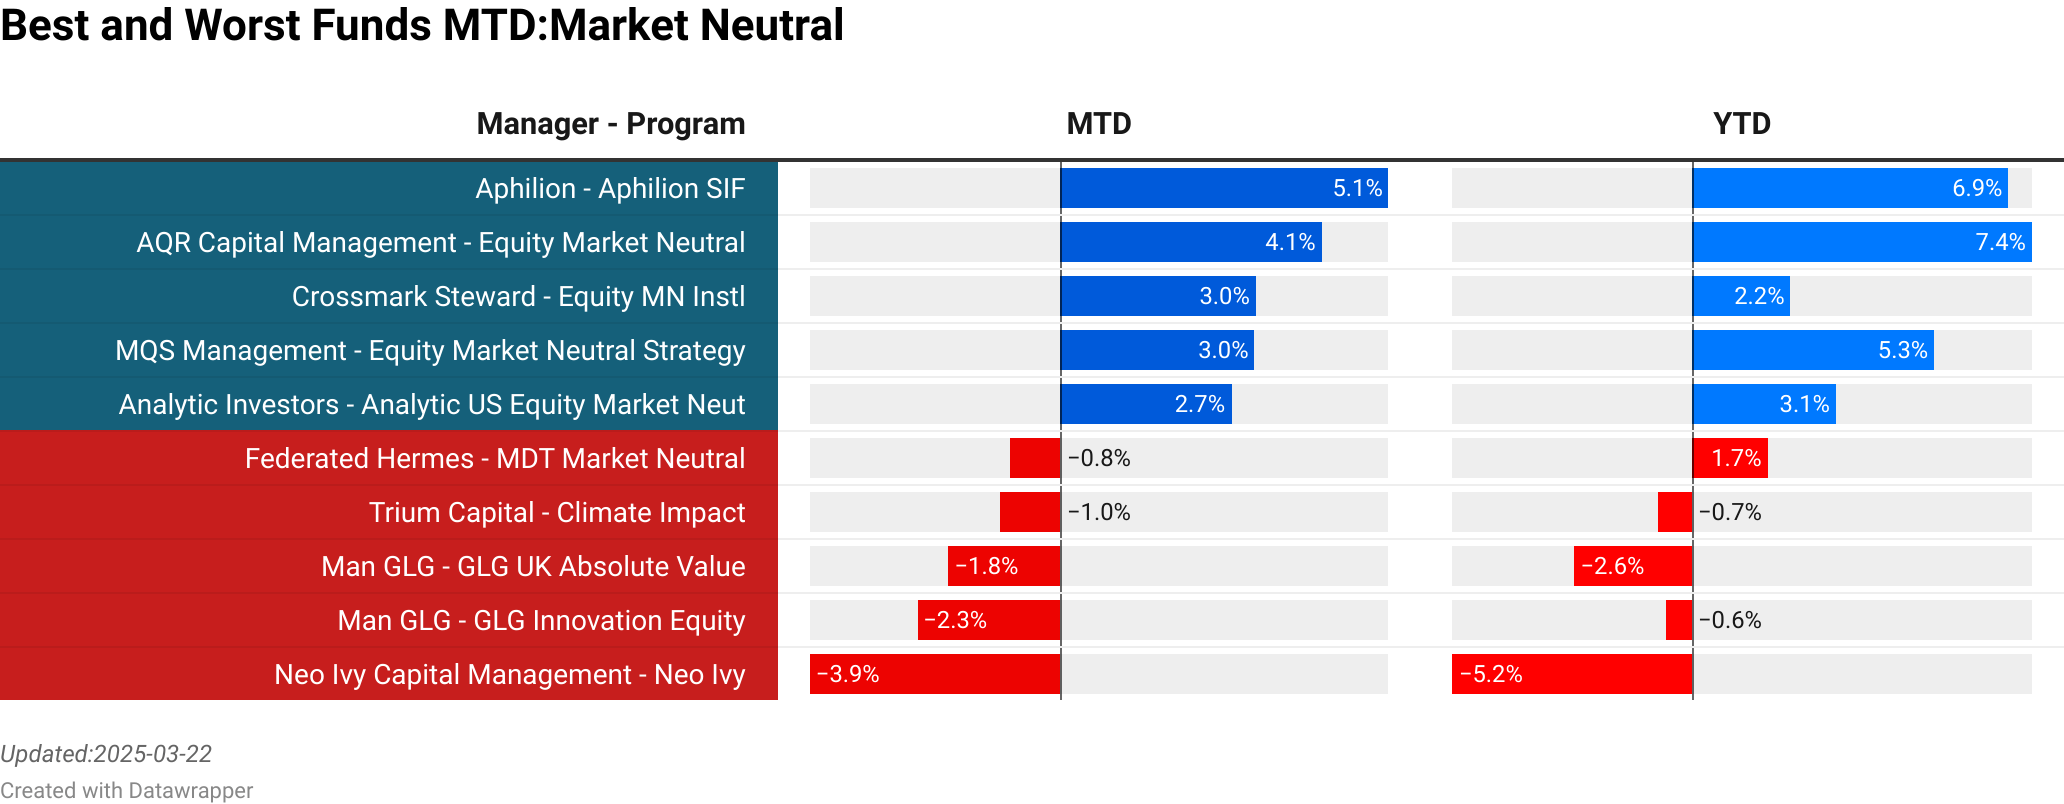
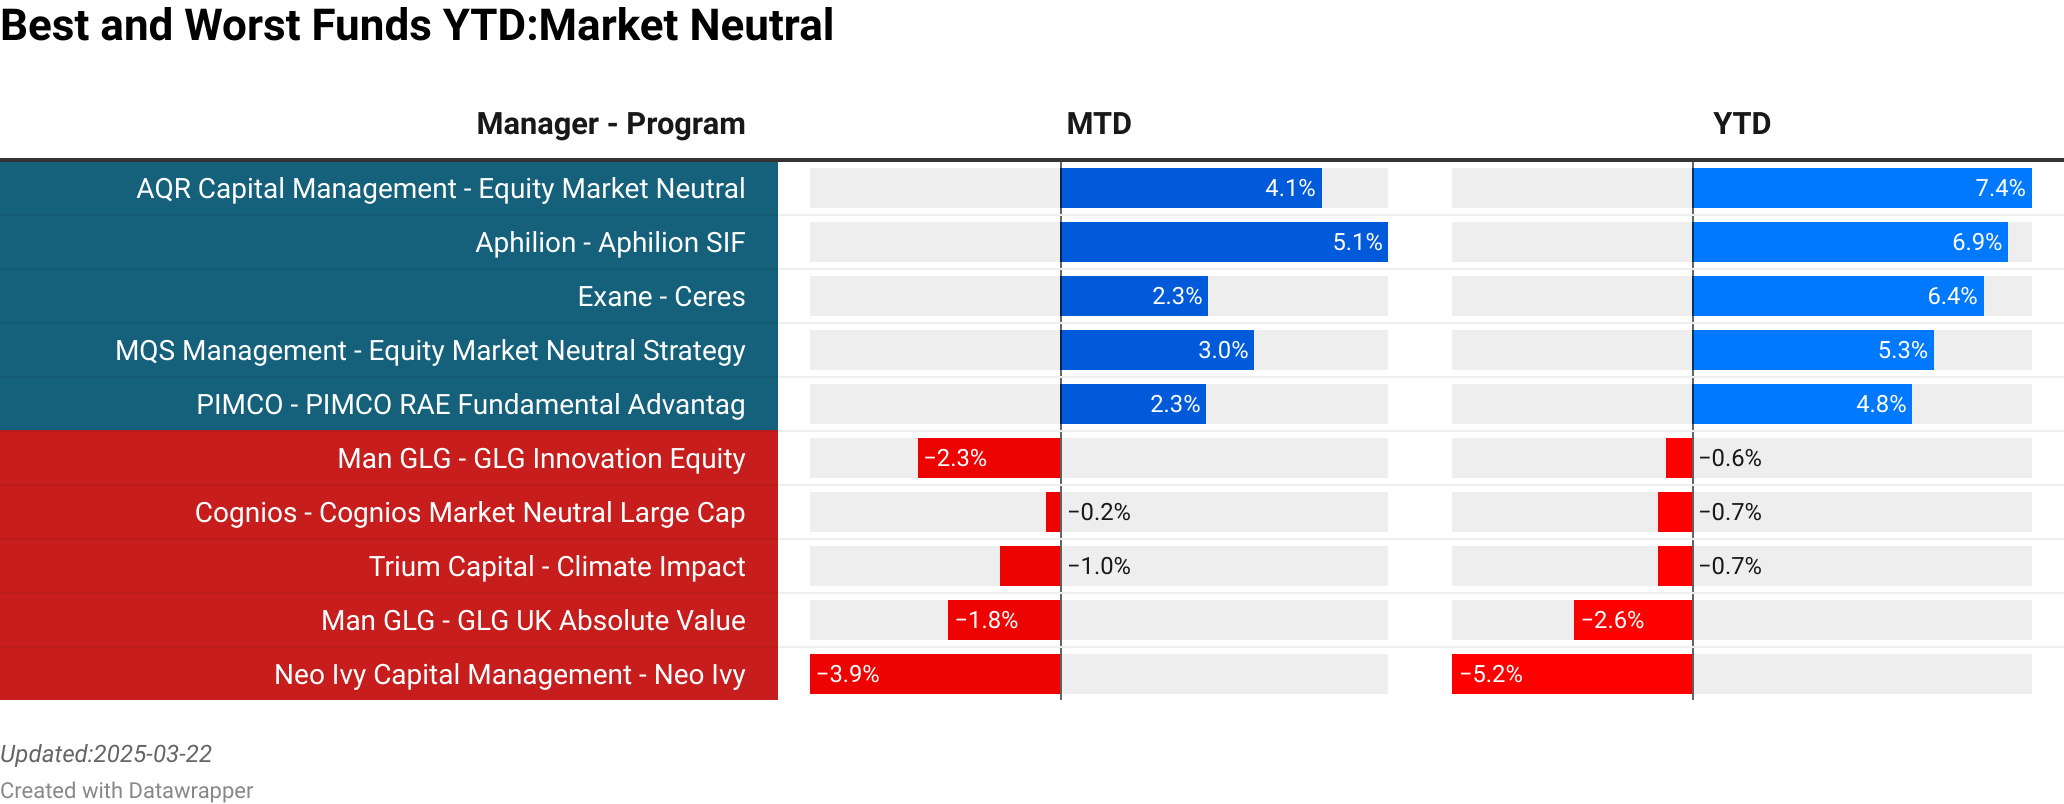
    Aphilion : Aphilion SIF  :  5.13% [44.38]<br> AQR Capital Management : Equity Market Neutral  :  4.07% [1010.00]<br> Crossmark Steward : Equity MN Instl  :  3.04% [0.00]<br> MQS Management : Equity Market Neutral Strategy  :  3.03% [60.00]<br> Analytic Investors : Analytic US Equity Market Neutral  :  2.66% [2.01]<br> Federated Hermes : MDT Market Neutral  :  -0.78% [0.00]<br> Trium Capital : Climate Impact  :  -0.96% [74.79]<br> Man GLG : GLG UK Absolute Value  :  -1.76% [581.42]<br> Man GLG : GLG Innovation Equity  :  -2.25% [63.76]<br> Neo Ivy Capital Management : Neo Ivy  :  -3.93% [0.00]<br> >
    AQR Capital Management : Equity Market Neutral  :  4.07% [1010.00]<br> Aphilion : Aphilion SIF  :  5.13% [44.38]<br> Exane : Ceres  :  2.31% [198.23]<br> MQS Management : Equity Market Neutral Strategy  :  3.03% [60.00]<br> PIMCO : PIMCO RAE Fundamental Advantage PLUS  :  2.27% [0.00]<br> Man GLG : GLG Innovation Equity  :  -2.25% [63.76]<br> Cognios : Cognios Market Neutral Large Cap  :  -0.24% [7.55]<br> Trium Capital : Climate Impact  :  -0.96% [74.79]<br> Man GLG : GLG UK Absolute Value  :  -1.76% [581.42]<br> Neo Ivy Capital Management : Neo Ivy  :  -3.93% [0.00]<br> >

    To explore the full list of Market Neutral strategies and their rankings, including dynamic updates as new data becomes available, we invite you to visit our website at the Link provided.

    Equity Long Short

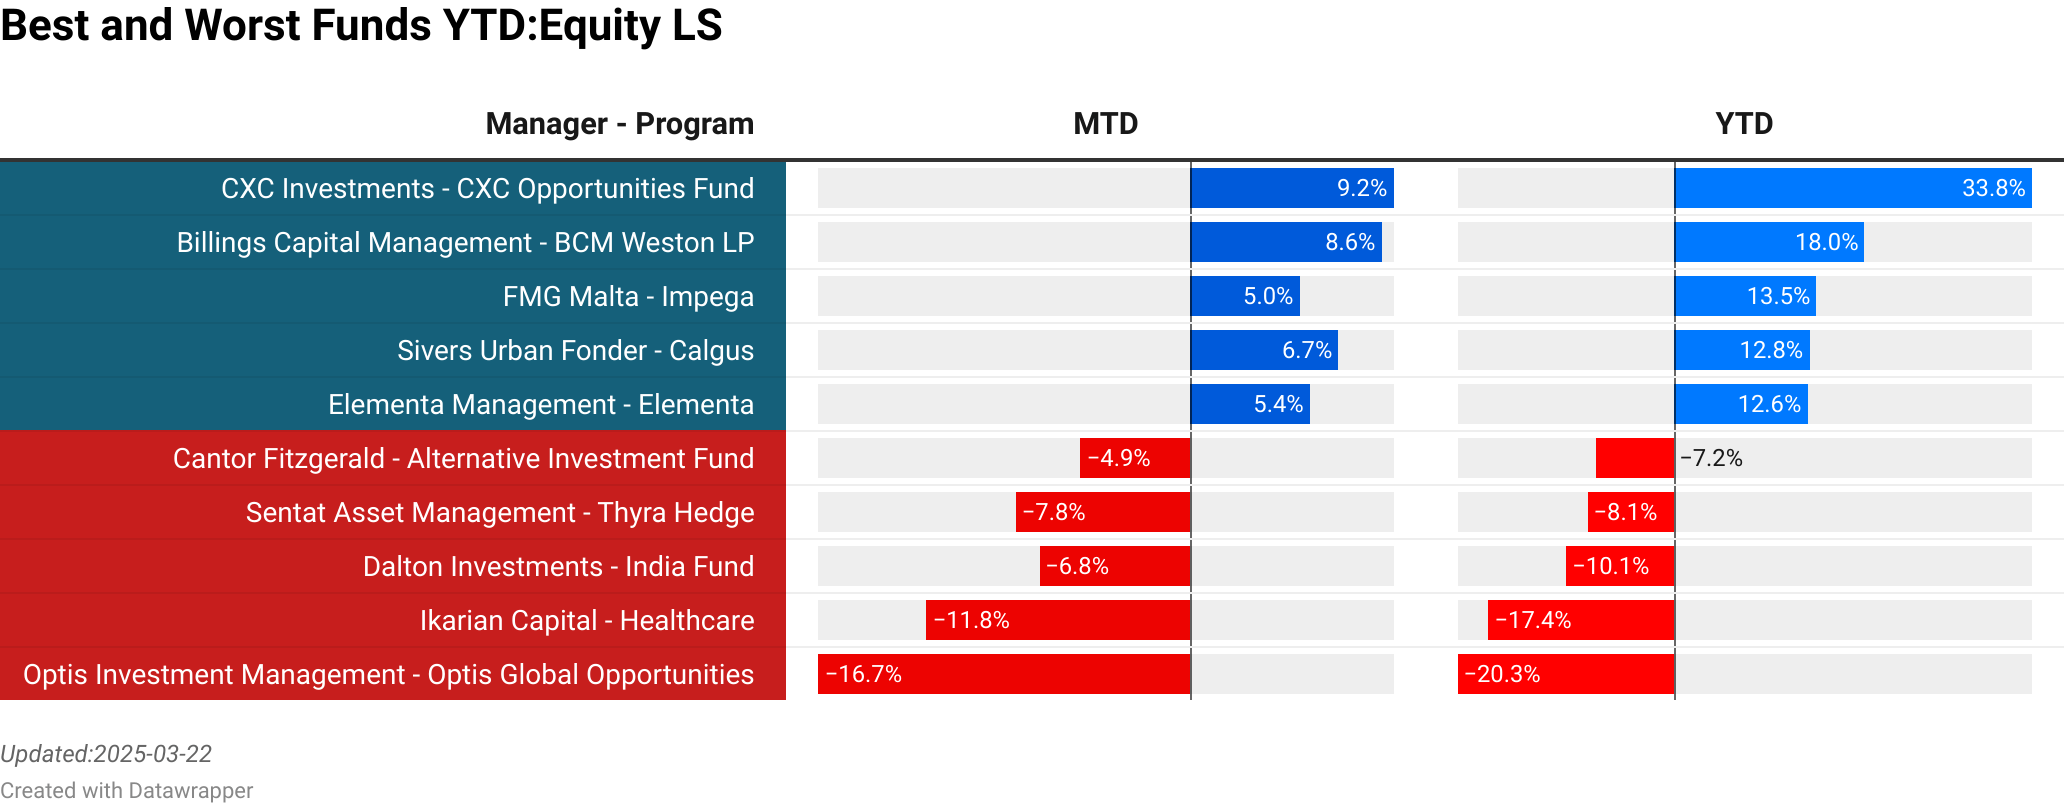
    Symmetry Invest : Symmetry Invest AS  :  10.81% [132.60]<br> CXC Investments : CXC Opportunities Fund  :  9.17% [3.60]<br> Billings Capital Management : BCM Weston LP  :  8.64% [64.00]<br> Odey : Absolute Return Focus Fund  :  7.89% [89.89]<br> Sivers Urban Fonder : Calgus  :  6.70% [28.20]<br> Welton Investment Partners : Welton Advantage  :  -8.33% [43.00]<br> Bennelong Funds Management : Bennelong Kardinia Absolute Return Fund  :  -8.89% [10.54]<br> Taika Capital : Taika Capital  :  -9.62% [0.65]<br> Ikarian Capital : Healthcare  :  -11.82% [271.60]<br> Optis Investment Management : Optis Global Opportunities  :  -16.67% [176.20]<br> >
    CXC Investments : CXC Opportunities Fund  :  9.17% [3.60]<br> Billings Capital Management : BCM Weston LP  :  8.64% [64.00]<br> FMG Malta : Impega  :  4.95% [0.00]<br> Sivers Urban Fonder : Calgus  :  6.70% [28.20]<br> Elementa Management : Elementa  :  5.41% [27.20]<br> Cantor Fitzgerald : Alternative Investment Fund  :  -4.89% [203.81]<br> Sentat Asset Management : Thyra Hedge  :  -7.81% [26.80]<br> Dalton Investments : India Fund  :  -6.76% [40.60]<br> Ikarian Capital : Healthcare  :  -11.82% [271.60]<br> Optis Investment Management : Optis Global Opportunities  :  -16.67% [176.20]<br> >

    To explore the full list of Equity Long Short strategies and their rankings, including dynamic updates as new data becomes available, we invite you to visit our website at the Link provided.

    Event Driven

    Symmetry Invest : Symmetry Invest AS  :  10.81% [132.60]<br> CXC Investments : CXC Opportunities Fund  :  9.17% [3.60]<br> Billings Capital Management : BCM Weston LP  :  8.64% [64.00]<br> Odey : Absolute Return Focus Fund  :  7.89% [89.89]<br> Sivers Urban Fonder : Calgus  :  6.70% [28.20]<br> Welton Investment Partners : Welton Advantage  :  -8.33% [43.00]<br> Bennelong Funds Management : Bennelong Kardinia Absolute Return Fund  :  -8.89% [10.54]<br> Taika Capital : Taika Capital  :  -9.62% [0.65]<br> Ikarian Capital : Healthcare  :  -11.82% [271.60]<br> Optis Investment Management : Optis Global Opportunities  :  -16.67% [176.20]<br> >
    CXC Investments : CXC Opportunities Fund  :  9.17% [3.60]<br> Billings Capital Management : BCM Weston LP  :  8.64% [64.00]<br> FMG Malta : Impega  :  4.95% [0.00]<br> Sivers Urban Fonder : Calgus  :  6.70% [28.20]<br> Elementa Management : Elementa  :  5.41% [27.20]<br> Cantor Fitzgerald : Alternative Investment Fund  :  -4.89% [203.81]<br> Sentat Asset Management : Thyra Hedge  :  -7.81% [26.80]<br> Dalton Investments : India Fund  :  -6.76% [40.60]<br> Ikarian Capital : Healthcare  :  -11.82% [271.60]<br> Optis Investment Management : Optis Global Opportunities  :  -16.67% [176.20]<br> >

    To explore the full list of Event Driven strategies and their rankings, including dynamic updates as new data becomes available, we invite you to visit our website at the Link provided.

    Fixed Income

    Stratobridge Asset Management : Stratobridge Master Fund  :  5.50% [0.00]<br> Axa IM : Volta Finance  :  5.39% [0.00]<br> Fair Oaks Capital : Income  :  3.60% [0.00]<br> EJF Investments : Event Driven  :  3.53% [0.00]<br> BioPharma : BioPharma Credit  :  3.33% [0.00]<br> TRG Management (The Rohatyn Group) : TRG Emerging & Frontier Equities Fund  :  -0.91% [0.00]<br> Acheron Capital : Life Settlement Assets  :  -1.33% [0.00]<br> Skandinaviska Kreditfonden : Scandinavian Credit Fund I  :  -1.58% [388.90]<br> VPC : Specialty Lending Investments  :  -5.26% [0.00]<br> GCP : Asset Backed Income  :  -12.07% [0.00]<br> >
    Stratobridge Asset Management : Stratobridge Master Fund  :  5.50% [0.00]<br> Enko Capital Management : Africa Debt Fund  :  3.33% [812.50]<br> RBC GAM : BlueBay Event Driven Credit Fund  :  0.01% [267.56]<br> Chenavari : Toro Income Fund  :  2.47% [0.00]<br> Axa IM : Volta Finance  :  5.39% [0.00]<br> Saba Capital : Carry Neutral Tail Hedge Fund  :  0.01% [997.00]<br> CQS : New City High Yield Fund  :  1.56% [0.00]<br> Skandinaviska Kreditfonden : Scandinavian Credit Fund I  :  -1.58% [388.90]<br> VPC : Specialty Lending Investments  :  -5.26% [0.00]<br> GCP : Asset Backed Income  :  -12.07% [0.00]<br> >

    To explore the full list of Event Driven strategies and their rankings, including dynamic updates as new data becomes available, we invite you to visit our website at the Link provided.

    Risk Premia

    AQR Capital Management : Alternative Risk Premia  :  5.52% [0.00]<br> AQR Capital Management : Style Premia  :  5.04% [1310.00]<br> Nordea Asset Management : Nordea 1  Alpha 15 MA Fund  :  2.99% [3421.20]<br> Allspring : Alternative Risk  :  2.51% [0.00]<br> Nordea Asset Management : Nordea 1  Alpha 10 MA Fund  :  2.14% [3753.60]<br> Trium Capital : Alternative Growth Fund  :  -1.29% [90.66]<br> Mount Lucas Management Corporation : AlphaCentric Symmetry Strategy  :  -1.76% [0.00]<br> Man AHL : Alternative Risk Premia  :  -1.92% [0.00]<br> LGT Capital Partners : LGT Risk Premia  :  -2.46% [651.59]<br> Catalyst Funds : Systematic Alpha  :  -6.78% [0.00]<br> >
    AQR Capital Management : Alternative Risk Premia  :  5.52% [0.00]<br> AQR Capital Management : Style Premia  :  5.04% [1310.00]<br> Quantedge Capital : Quantedge Global Fund  :  -0.82% [4504.23]<br> Allspring : Alternative Risk  :  2.51% [0.00]<br> Nordea Asset Management : Nordea 1  Alpha 15 MA Fund  :  2.99% [3421.20]<br> Mount Lucas Management Corporation : AlphaCentric Symmetry Strategy  :  -1.76% [0.00]<br> Man AHL : Alternative Risk Premia  :  -1.92% [0.00]<br> Danske Bank Asset Management : Global Alternative Opportunities  :  -1.23% [962.40]<br> LGT Capital Partners : LGT Risk Premia  :  -2.46% [651.59]<br> Catalyst Funds : Systematic Alpha  :  -6.78% [0.00]<br> >

    To explore the full list of Risk Premia strategies and their rankings, including dynamic updates as new data becomes available, we invite you to visit our website at the Link provided.

    Crypto Strategies

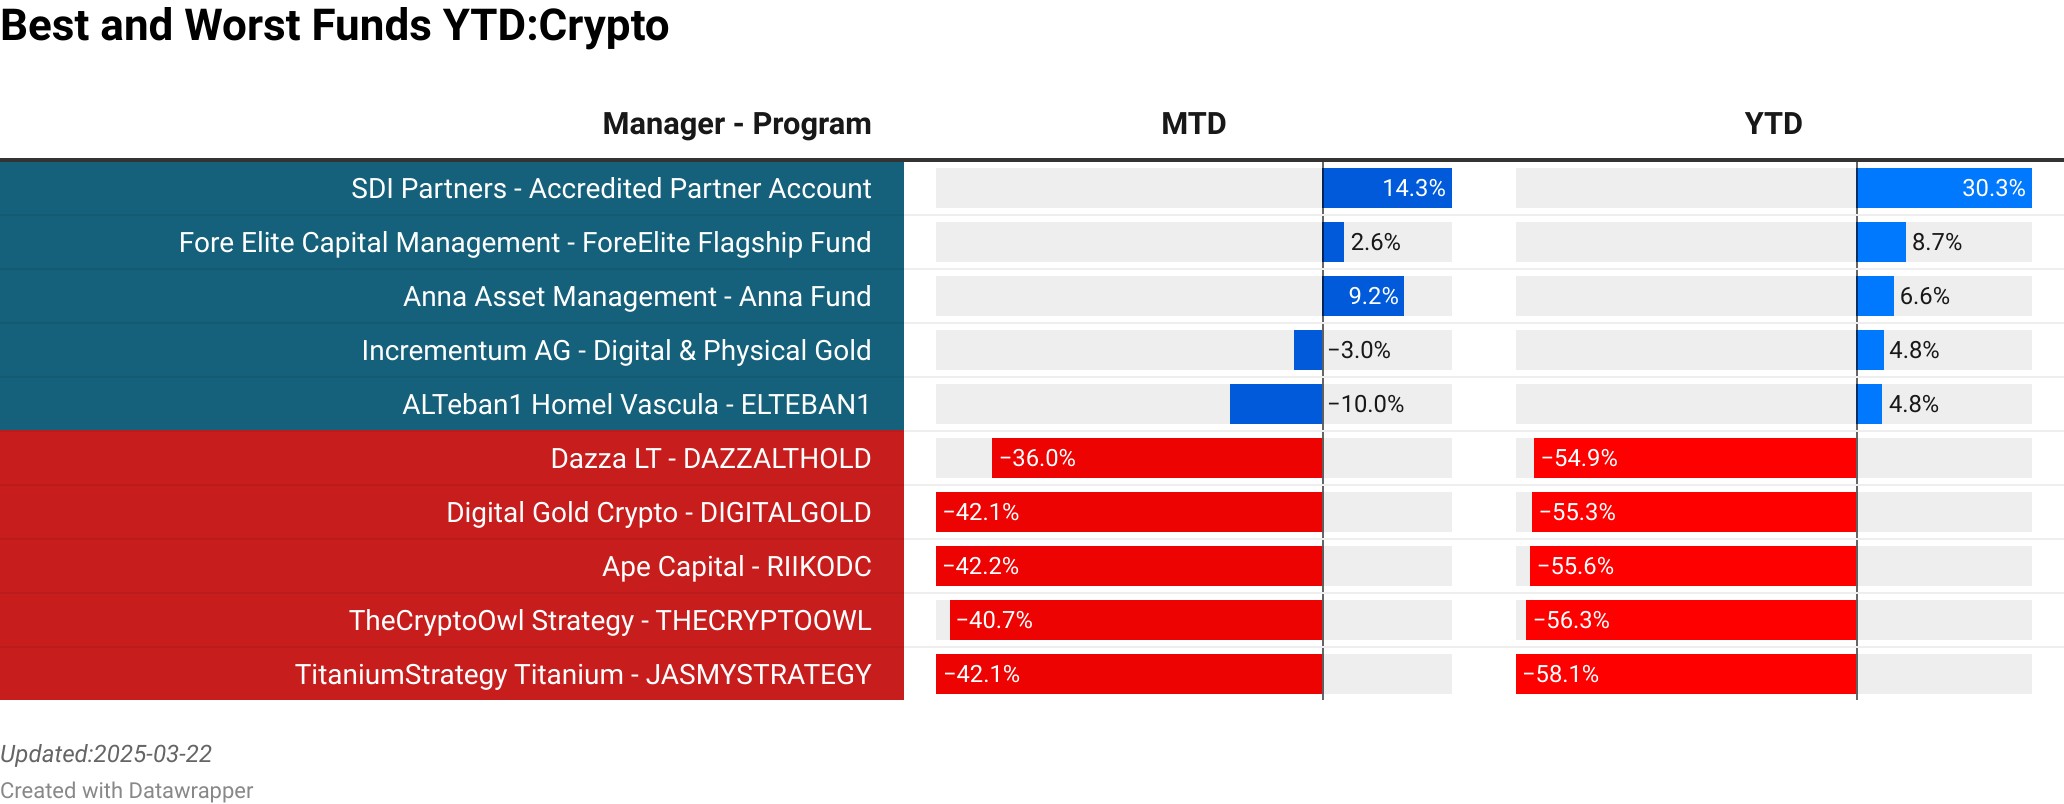
    SDI Partners : Accredited Partner Account  :  14.33% [541.64]<br> Active Digital : Long Short  :  9.92% [20.00]<br> Anna Asset Management : Anna Fund  :  9.18% [42.80]<br> Stylus Capital : Crypto Momentum Fund  :  4.42% [0.00]<br> ANB Investments US : Digital Assets Quantitative Fund BTC  :  4.20% [0.00]<br> Astraeus : ASTRAEUS  :  -41.56% [0.00]<br> Dmx AI Dmx : DMXCRYPTO  :  -41.96% [0.00]<br> TitaniumStrategy Titanium : JASMYSTRATEGY  :  -42.06% [0.00]<br> Digital Gold Crypto : DIGITALGOLD  :  -42.14% [0.00]<br> Ape Capital : RIIKODC  :  -42.17% [0.00]<br> >
    SDI Partners : Accredited Partner Account  :  14.33% [541.64]<br> Fore Elite Capital Management : ForeElite Flagship Fund  :  2.58% [156.95]<br> Anna Asset Management : Anna Fund  :  9.18% [42.80]<br> Incrementum AG : Digital & Physical Gold  :  -3.03% [27.70]<br> ALTeban1 Homel Vascula : ELTEBAN1  :  -10.02% [0.00]<br> Dazza LT : DAZZALTHOLD  :  -35.95% [0.00]<br> Digital Gold Crypto : DIGITALGOLD  :  -42.14% [0.00]<br> Ape Capital : RIIKODC  :  -42.17% [0.00]<br> TheCryptoOwl Strategy : THECRYPTOOWL  :  -40.68% [0.00]<br> TitaniumStrategy Titanium : JASMYSTRATEGY  :  -42.06% [0.00]<br> >

    To explore the full list of Risk Premia strategies and their rankings, including dynamic updates as new data becomes available, we invite you to visit our website at the Link provided.

    •  

    Global Investment Report

    2025 Update and Outlook

    A revealing discussion of how the most intriguing hedge funds performed last year and a look at the opportunities and risks that lay ahead.

    Hi Eric, hope your year ended well and good to reconnect.  Looking at your year-end wrap-up, there’s clearly a lot to talk about. Let’s start with what were the key takeaways from how your Top 50 hedge funds performed last year?

    person standing on floating boat between houses

    Good to reconnect Linus…I ended 2024 over the ocean heading to Italy. When I returned back to the States in late January, I found myself in a very different country from the one I had departed. More about that later.

    There were several compelling takeaways from my year-end report.

    To remind folks who may not know about my Top 50 hedge funds, at the beginning of every year I survey the industry to find the most consistently performing broad strategy hedge funds that have at least five years of performance and are managing at least $300 million. They all need to straddle performance hurdles for each of the past five years.

    I then rank the highest performers over the trailing 5 years through 2023.

    Throughout 2024, I tracked how these funds performed quarter over quarter. This latest report provides final full-year 2024 performance numbers of these 50 hedge funds.

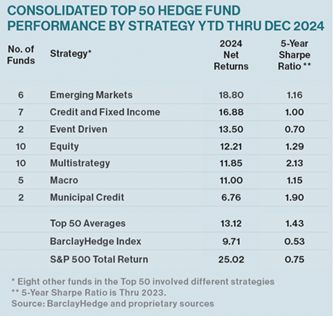
    Collectively in 2024, the 50 (up 13.1%) kept pace with their 3- and 5-year annualized returns (12.3% and 13.7%), and their average returns since inception — with a mean fund age of 15 years (11.4%). More than 80% of the funds have qualified for the 2025 survey.

    Are you concerned that your 50 significantly trailed the US market?

    No.

    The market has been on a crazy good run, outpacing its historic rate of return by 100% over each of the past two years. The last time the market had multiple 20+% years was followed by the Tech Wreck.

    Even if such a correction doesn’t happen this time, alternatives are not meant to keep pace with a hyper market. They target more even returns.

    Most investors should maintain significant market exposure. The Top 50 targets steadier, less volatile returns that over time closely track the market. The 5-year annualized returns of the 50 thru 2023, for instance, was 13.7%, just two percentages less than the market and these funds delivered these gains with a lot less risk.

    When you dig deeper, what else did you find about the 50’s performance?

    As we’ve been discussing recently, the big surprise was six emerging market funds that made the cut and were the best performing strategy from wire to wire through December 2024.

    Two funds, Sandglass and Enko (both credit managers who had joined us in our EM webinar last fall) actually delivered market-beating returns. 

    That always makes me wonder whether this year they’ll give back some of these gains, especially since they massively outperformed their annualized rates of return. So I asked the PMs that question.

    They anticipate more restrained but positive returns in 2025 because their active management approach targets relatively short-term idiosyncratic investments supported by EM being in an attractive phase of the debt cycle.

    That said, I would still be skeptical. Both of these funds have seen drawdowns of 20%. However, these funds have each been around for a decade and ostensibly have stayed true to an effective investment process that has delivered consistent returns. Enko, in fact, has never had a down year.  

    Any other funds stand out?

    Mudrick Distressed had one of the most remarkable turnarounds I’ve ever seen. I interviewed the manager, Jason Mudrick, in last year’s report because he is one of just a dozen funds that have made my survey since I started the current methodology in 2019 when The Wall Street Journal published my report.

    His fund was launched in 2009 and has been generating annualized returns of 10% through 2023.

    However, 2024 started off rough for Mudrick, having been down more than 8% in the first quarter. But the fund ended the year up 32% because of a series of effective investments that ranged from debt for equity to a senior secured convertible issue that benefited from a favorable judicial ruling and then a buyout offer.

    Is the fund at risk of mean reversion this year?

    Over its 16 years, the fund has had three distinct years of 20+% returns and each was then followed by more modest positive gains. Being an idiosyncratic investor that embraces a disciplined investment process suggests that Mudrick knows how to sustain returns after a strong year. It certainly doesn’t hurt with $5.5 trillion in junk bonds overhanging the distressed market and likely offering plenty of opportunities from which to invest.

    Sounds like credit was a leading strategy in your Top 50.  Did any other strategy stand out?

    Hedged equity, multistrategy, and macro jointly averaged around 12%. These are decent returns for underlying funds that have delivered long-term consistency across all markets.

    In these groups, the big names did shine. Citadel Tactical Trading (equity) returned 22.3%. Point 72 (multistrategy) delivered gains of 18.6%. And macro trader D.E. Shaw Oculus soared by more than 36%. All these funds significantly outperformed their historical rates of return.

    Any other surprises?

    Yes, and they were on the downside. Waha MENA equity, like Mudrick Distressed, has regularly made the Top 50. Mohamed El Jamal’s Abu Dhabi-based fund had ascended to the No. 6 ranking with trailing 5-year annualized returns through 2023 of 20.6%. But it struggled all last year, gaining just 1.6%.

    Making this doubly surprising was that El Jamal’s Waha EM Credit fund racked up gains of 18.4% last year.

    The other big underperformer was noted activist Starboard Value. The fund has been around for more than two decades with annualized returns of 13.5%. It managed a gain of just 4.2% in 2024.

    You mentioned returning home in January to a different America. What do you mean?

    Despite the pandemic, supply chain shocks, inflation, rising interest rates, and war, the US economy has been remarkably resilient. But the new administration is stressing it in new ways that no one has ever seen before.

    We’re seeing the administration break foundational rules and norms. Congress seems OK ceding over its policy and budgetary authority without regard to process or consequences. We’ll soon see what the courts think given the many challenges being brought against Trump and if the administration will abide by unfavorable court rulings.

    The Supreme Court’s very recent decision to hear a case where lower Federal courts ruled the administration had to pay foreign aid contractors who have already completed work will be a bell-weather decision.

    What other risks do you see?

    I think it’s too early to interpret 2025 data points. But collectively, many are pointing in the wrong direction. That includes from inflation and consumer sentiment, insider-selling, and Europe’s significant outperformance over US stocks.

    We’ll need to watch if and how far these trends evolve.

    For sure it hasn’t been profitable to bet against the US. But there’s no reference point to gauge the effect of what’s going on right now.

    Do you think the new administration’s actions will directly affect the economy and markets?

    When not done methodically, I think most folks are concerned how significant Federal job cuts will affect performance of key government infrastructure that supports all facets of US life—business as well as family. This ranges from health and human services, law enforcement, the collection and enforcement of taxes, air travel and consumer protection to how states and cities govern, down to basic civil rights. And when these cuts are geographically concentrated in places like Virginia, they will immediately slow local spending.

    If these actions proceed, they will also likely end up transferring costs to state governments, most of which are unable to handle the added financial burden.

    Lars Christensen is a well-regarded Danish economist who I interviewed several years. In assessing what’s going on, he sees, “a historically unprecedented administrative collapse at the top of the American state. The financial markets will react strongly to this”.

    And internationally?

    There’s widespread agreement that significant tariffs will probably restart inflation and threaten the Fed’s decision (and the ECB’s) to cut rates any further. If this happens, growth will likely slow.

    The President is challenging key European alliances and support for Ukraine. This will shake things up. Demanding in-kind mineral payments from Ukraine for continued assistance is to ignore the cost the country is paying in blood, property, and treasure for defending itself and the West from Russian aggression. Ukraine will need these resources to rebuild its economy.

    (Conversely, it’s noteworthy that the Trump administration is not discussing Russian war reparations to Ukraine.)

    If Europe decides to fast track expansion of its arms industry, this will redirect spending inwardly and away from the US. Germany’s next Prime Minister Friedrich Merz just said, “The absolute priority will be to strengthen Europe as quickly as possible so that, step by step, we can really achieve independence from the US.”

    If Europe decides to fast track expansion of its arms industry, this will redirect spending inwardly and away from the US. Germany’s next Prime Minister Friedrich Merz just said, “The absolute priority will be to strengthen Europe as quickly as possible so that, step by step, we can really achieve independence from the US.”

    Bret Stephens of the New York Times summed things up this way:

    “But if it’s a financial payback that the Trump administration seeks, the best place to get it is to seize, in collaboration with our European partners, Russia’s frozen assets and put them into an account by which Ukraine could pay for American-made arms. If the United States won’t do this, the Europeans should: Let the Ukrainians rely for their arms on Dassault, Saab, Rheinmetall, BAE Systems and other European defense contractors and see how that goes over with the “America First”-ers. Hopefully that could serve as another spur to Europeans to invest, as quickly and heavily as they can, in their depleted militaries, not simply to strengthen NATO but also to hedge against its end.”

    What are your sources telling you about all this?

    On the record, everyone I’ve been speaking with is putting on confident faces. But privately, many are baffled and are just hoping that common sense prevails.  I don’t see that happening because Trump this time has intentionally surrounded himself with folks who either aren’t experts in their fields or unwilling to challenge his thinking.

    I suspect if there isn’t a return to more thoughtful policies and norms, investors may begin to reduce risk taking which could in turn further slow growth.

    Citadel’s Ken Griffin, a key Trump ally, says, “it’s a difficult time to invest because of the policy uncertainty that goes on with this (administrative) transformation.”

    Thanks Eric, good to have you here again. You can find more of Eric’s writing here.

    •  

    Best’n’Worst Jan 2025 Edition

    While the year is still young, we have compiled the best and worst strategies for January 2025. Please do not infer too much from this single data point. Some strategies are continuing to deliver impressive returns (the recent Cocoa reversal may have changed those numbers…). Some prior losers delivered impressive results in January.

    Our analysis is based on proprietary composite data streams. NilssonHedge is responsible for the compilation. We must note that there is always the possibility of errors or inaccuracies in our calculations.

    CTA

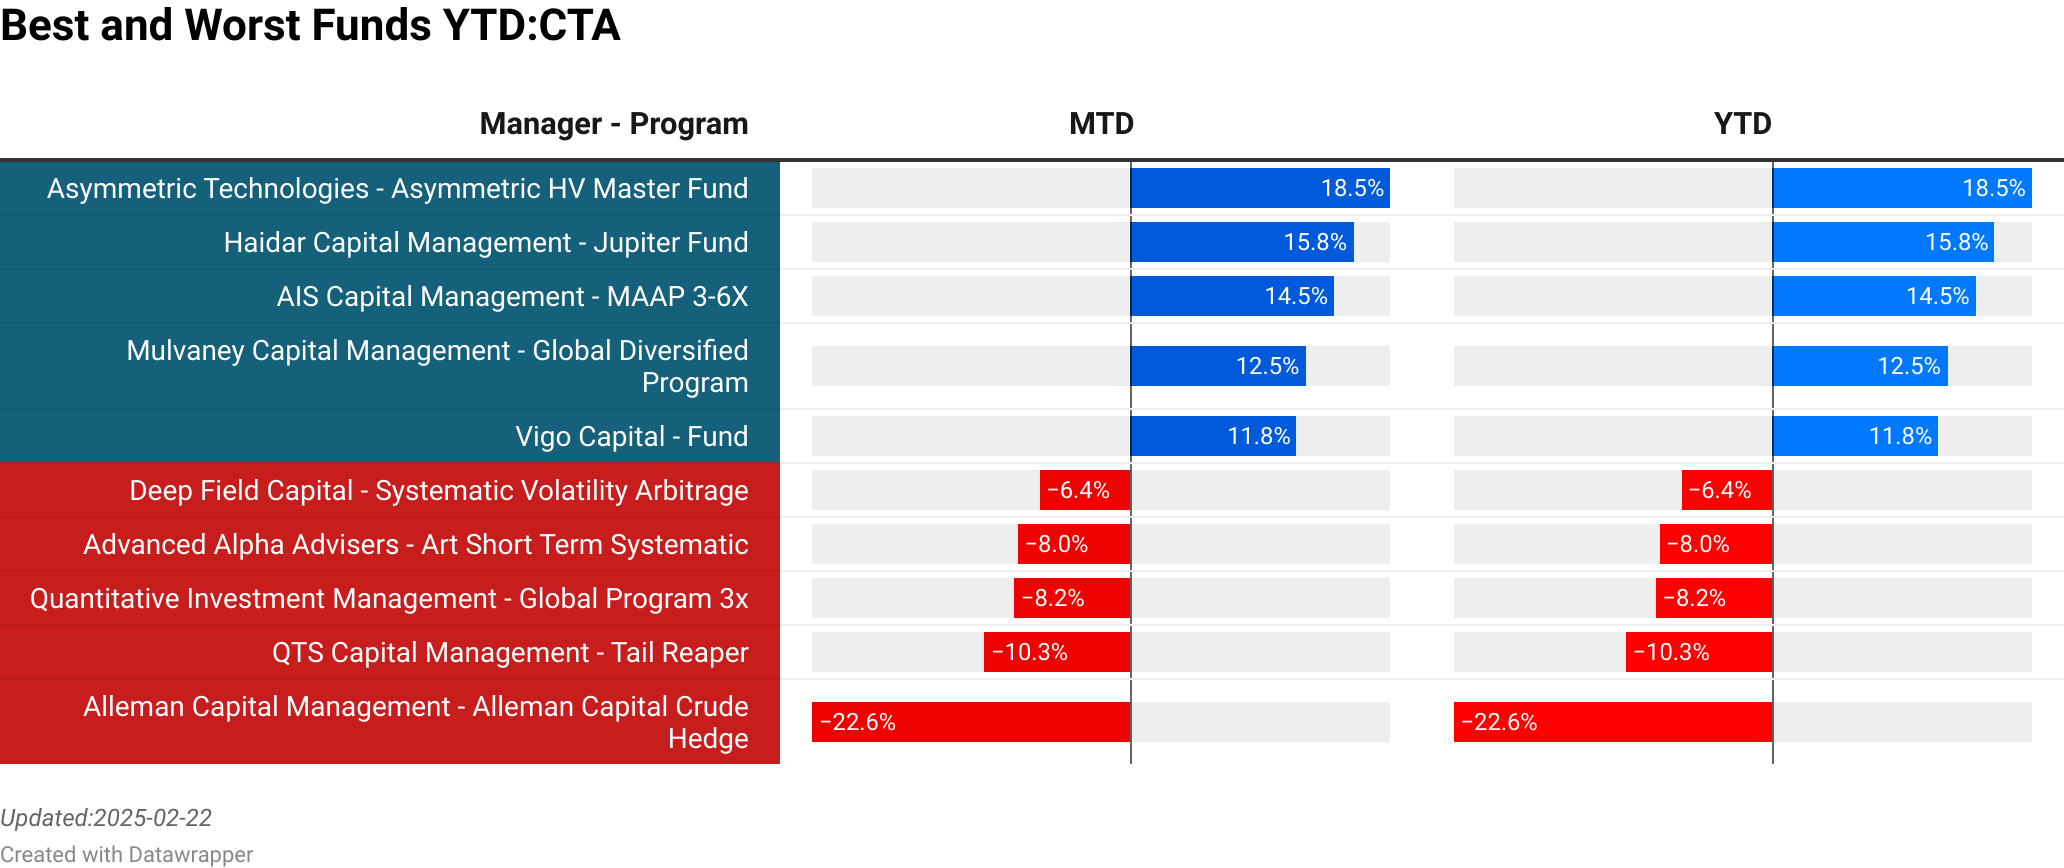
    Asymmetric Technologies : Asymmetric HV Master Fund  :  18.49% [5.88]<br> Haidar Capital Management : Jupiter Fund  :  15.84% [745.83]<br> AIS Capital Management : MAAP 3-6X  :  14.49% [62.46]<br> Mulvaney Capital Management : Global Diversified Program  :  12.45% [397.00]<br> Vigo Capital : Fund  :  11.84% [1.73]<br> Deep Field Capital : Systematic Volatility Arbitrage  :  -6.41% [17.00]<br> Advanced Alpha Advisers : Art Short Term Systematic  :  -7.95% [6.50]<br> Quantitative Investment Management : Global Program 3x  :  -8.21% [43.15]<br> QTS Capital Management : Tail Reaper  :  -10.33% [5.70]<br> Alleman Capital Management : Alleman Capital Crude Hedge  :  -22.56% [0.02]<br> >

    To explore the full list of CTAs and their rankings, including dynamic updates as new data becomes available, we invite you to visit our website at the Link provided.

    Market Neutral

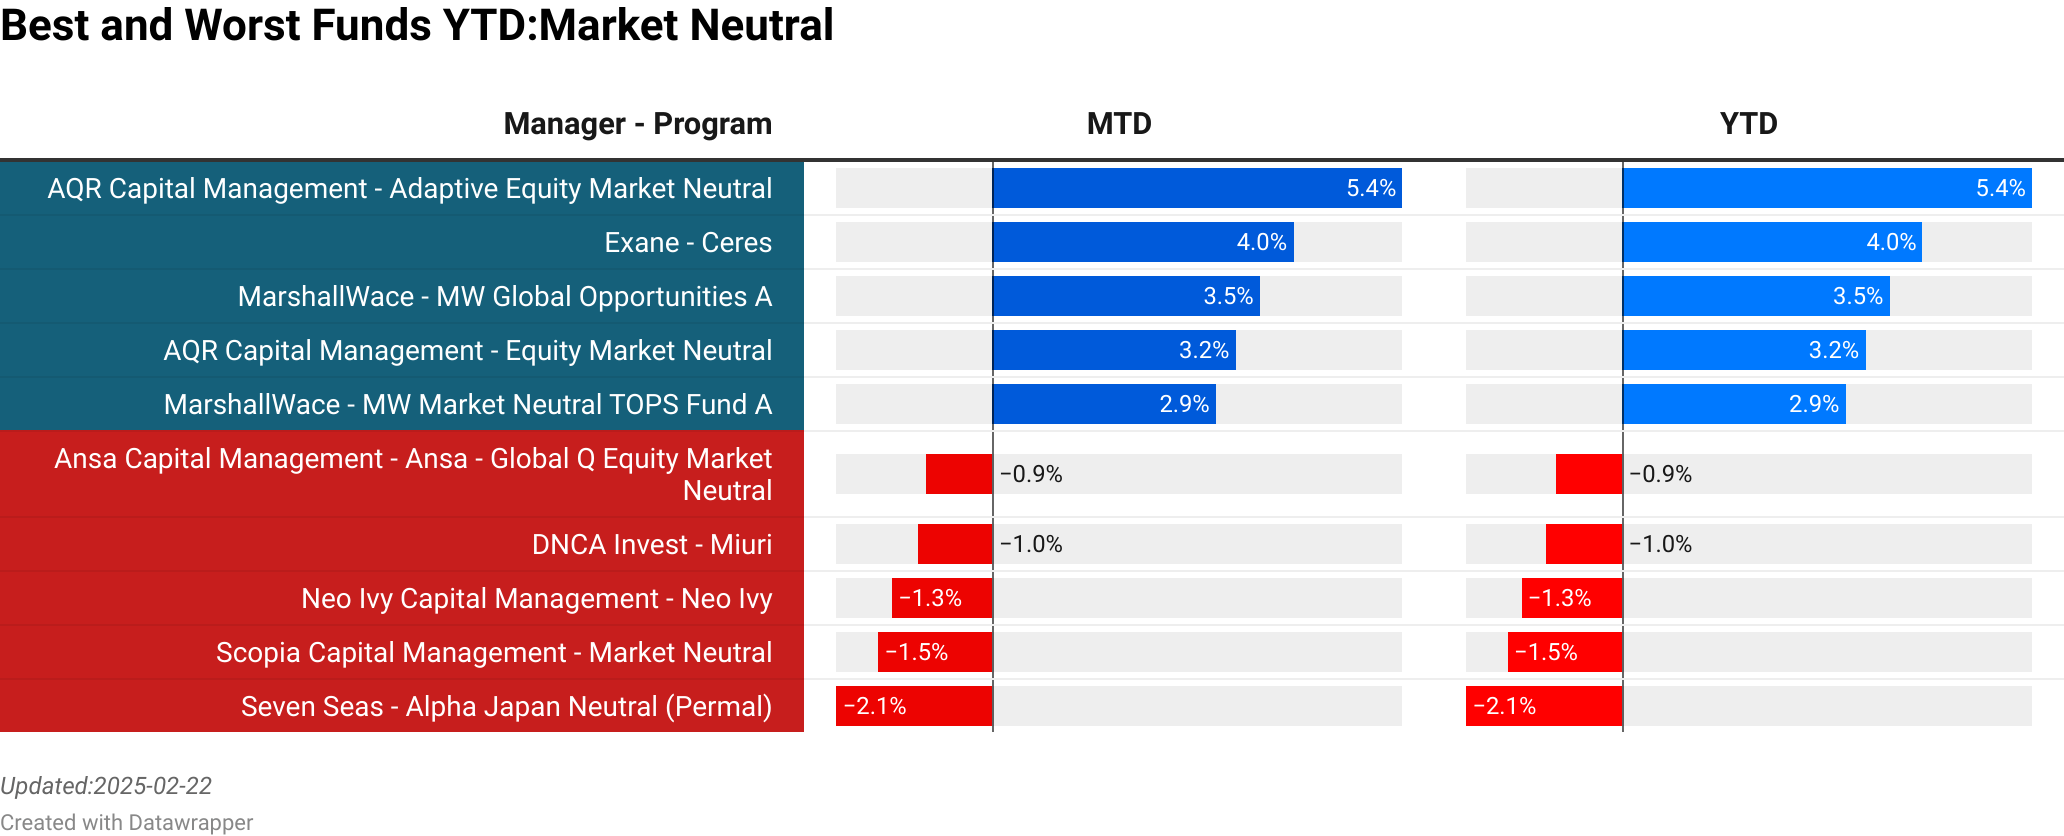
    AQR Capital Management : Adaptive Equity Market Neutral  :  5.40% [404.17]<br> Exane : Ceres  :  3.96% [208.67]<br> MarshallWace : MW Global Opportunities A  :  3.52% [4424.13]<br> AQR Capital Management : Equity Market Neutral  :  3.19% [1010.00]<br> MarshallWace : MW Market Neutral TOPS Fund A EUR  :  2.94% [0.00]<br> Ansa Capital Management : Ansa - Global Q Equity Market Neutral  :  -0.89% [60.77]<br> DNCA Invest : Miuri  :  -1.00% [170.81]<br> Neo Ivy Capital Management : Neo Ivy  :  -1.33% [0.00]<br> Scopia Capital Management : Market Neutral  :  -1.51% [45.04]<br> Seven Seas : Alpha Japan Neutral (Permal)  :  -2.06% [17.01]<br> >

    To see the complete list of Market Neutral strategies and their rankings, along with updates as new data comes in, please visit our website at the Link.

    Equity Long Short

    CXC Investments : CXC Opportunities Fund  :  22.55% [3.31]<br> Brasil Capital : Brasil Capital Equity Hedge Fund  :  11.57% [60.10]<br> Pershing square : Pershing Square  :  10.07% [0.00]<br> Incline Global Management : Incline Global Fund  :  9.74% [152.00]<br> HELSINKI CAPITAL PARTNERS : HCP Focus Fund  :  9.35% [20.40]<br> Optis Investment Management : Optis Global Opportunities  :  -4.38% [211.90]<br> Quantitative Investment Management : Tactical Fund  :  -4.52% [356.35]<br> Proxy P Management : Proxy Renewable LongShort Energy  :  -4.75% [25.00]<br> Odey : Absolute Return Focus Fund  :  -5.44% [82.98]<br> Ikarian Capital : Healthcare  :  -6.43% [271.60]<br> >

    To explore the full list of Equity Long Short strategies and their rankings, including dynamic updates as new data becomes available, we invite you to visit our website at the Link provided.

    Event Driven

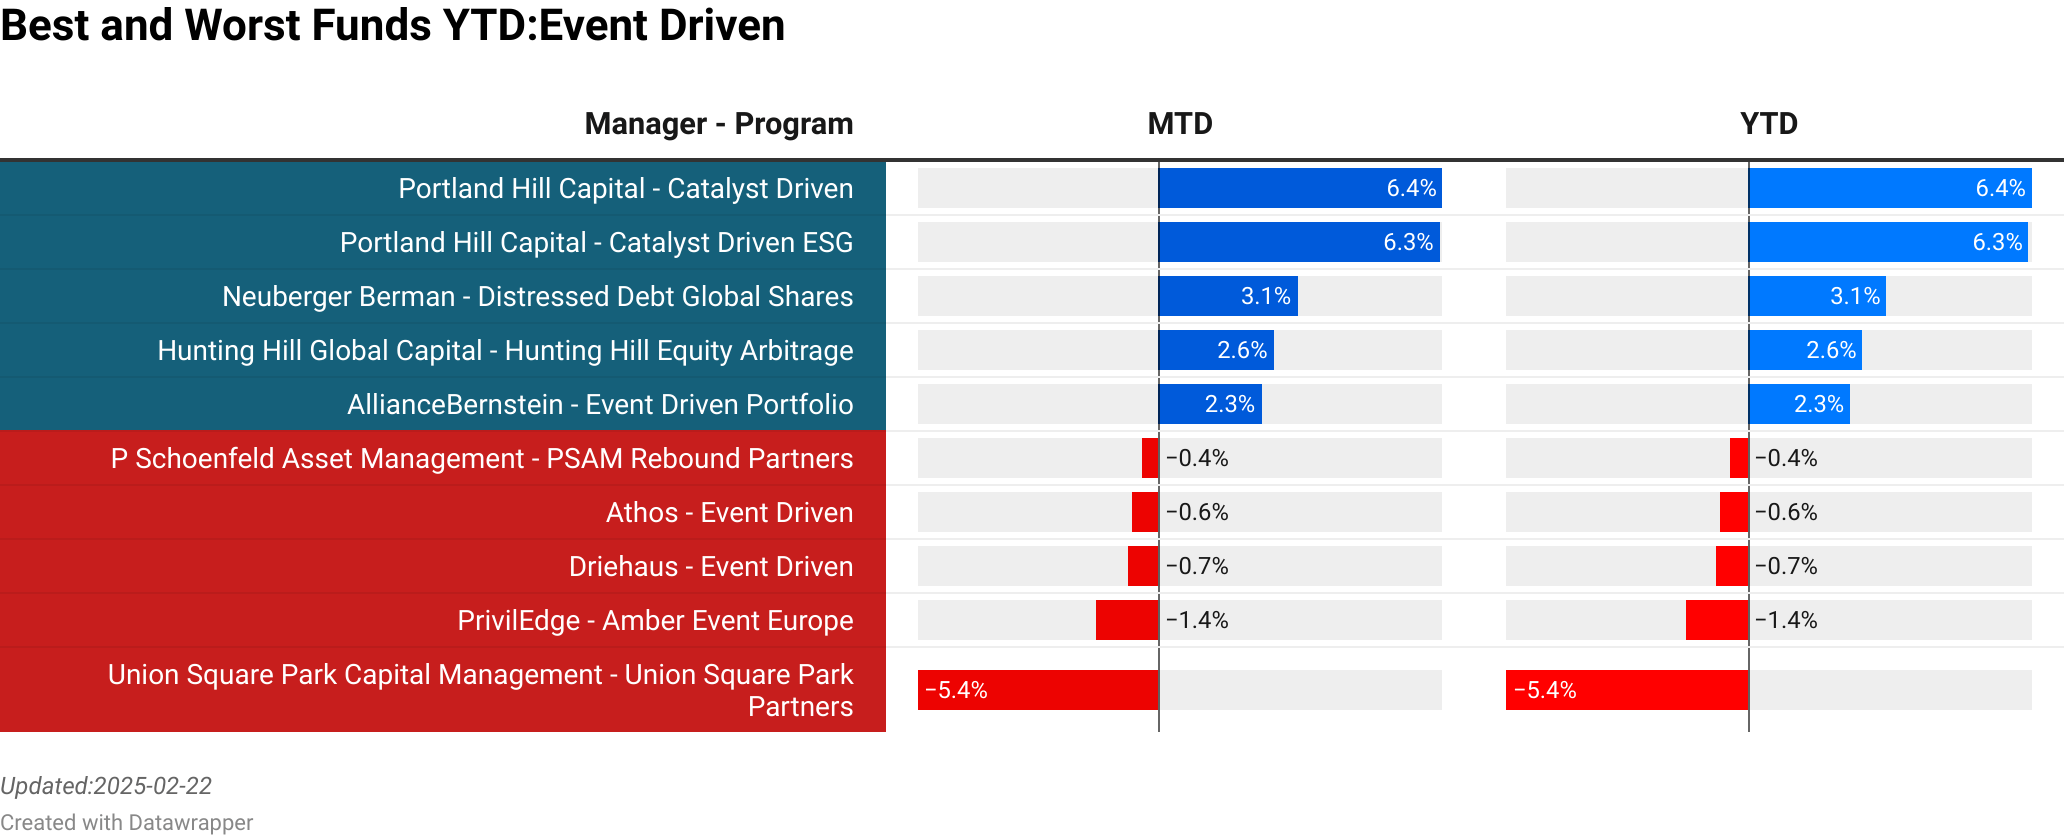
    CXC Investments : CXC Opportunities Fund  :  22.55% [3.31]<br> Brasil Capital : Brasil Capital Equity Hedge Fund  :  11.57% [60.10]<br> Pershing square : Pershing Square  :  10.07% [0.00]<br> Incline Global Management : Incline Global Fund  :  9.74% [152.00]<br> HELSINKI CAPITAL PARTNERS : HCP Focus Fund  :  9.35% [20.40]<br> Optis Investment Management : Optis Global Opportunities  :  -4.38% [211.90]<br> Quantitative Investment Management : Tactical Fund  :  -4.52% [356.35]<br> Proxy P Management : Proxy Renewable LongShort Energy  :  -4.75% [25.00]<br> Odey : Absolute Return Focus Fund  :  -5.44% [82.98]<br> Ikarian Capital : Healthcare  :  -6.43% [271.60]<br> >

    To explore the full list of Event Driven strategies and their rankings, including dynamic updates as new data becomes available, we invite you to visit our website at the Link provided.

    Fixed Income

    Bradesco Asset Management : Fixed Income  :  9.20% [0.00]<br> Argo Capital Management : Argo Fund  :  5.34% [105.00]<br> GAM International Management : Star Global Rates  :  5.09% [210.54]<br> Enko Capital Management : Africa Debt Fund  :  4.60% [885.50]<br> Chenavari : Toro Income Fund  :  4.48% [0.00]<br> Owl Creek Asset Management : Owl Creek Credit Opportunities Fund  :  -1.20% [529.00]<br> EJF Investments : Event Driven  :  -1.66% [0.00]<br> Duet Asset Management : Duet EM Frontier Fund  :  -1.95% [175.00]<br> GCP : Asset Backed Income  :  -2.10% [0.00]<br> BioPharma : BioPharma Credit  :  -2.98% [0.00]<br> >

    To explore the full list of Event Driven strategies and their rankings, including dynamic updates as new data becomes available, we invite you to visit our website at the Link provided.

    Risk Premia

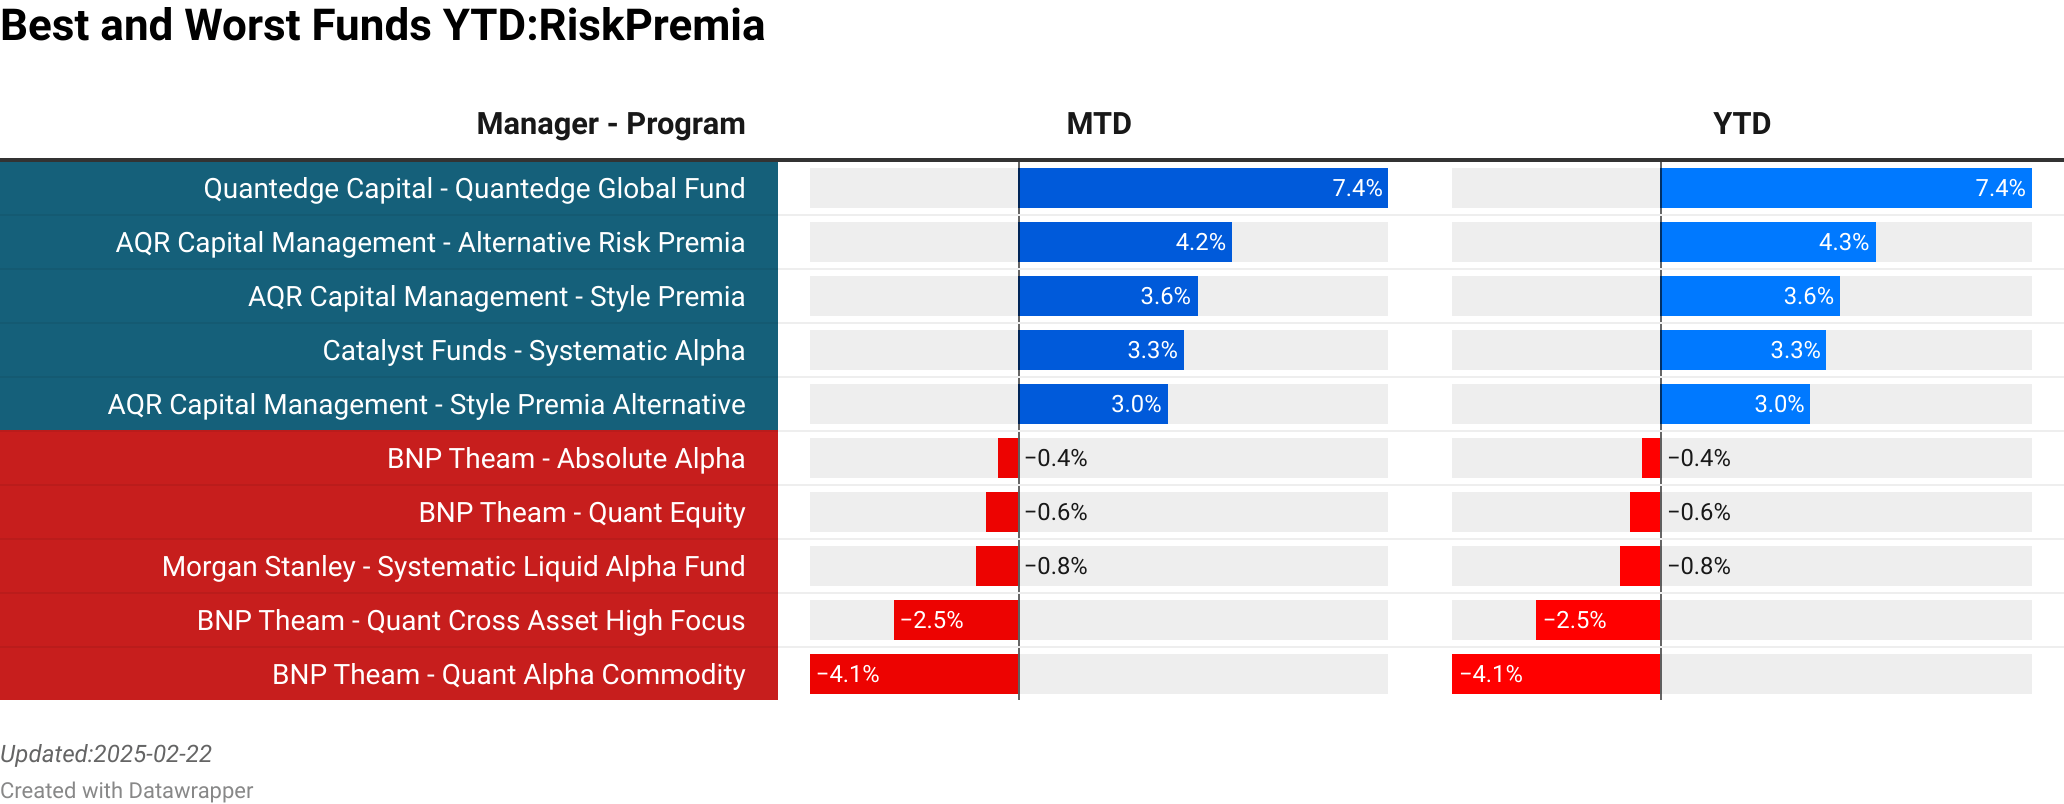
    Quantedge Capital : Quantedge Global Fund  :  7.35% [4537.48]<br> AQR Capital Management : Alternative Risk Premia  :  4.24% [0.00]<br> AQR Capital Management : Style Premia  :  3.55% [336.01]<br> Catalyst Funds : Systematic Alpha  :  3.28% [0.00]<br> AQR Capital Management : Style Premia Alternative  :  2.96% [1310.00]<br> BNP Theam : Absolute Alpha  :  -0.39% [13.24]<br> BNP Theam : Quant Equity  :  -0.63% [14.99]<br> Morgan Stanley : Systematic Liquid Alpha Fund  :  -0.81% [85.64]<br> BNP Theam : Quant Cross Asset High Focus  :  -2.46% [582.23]<br> BNP Theam : Quant Alpha Commodity  :  -4.12% [72.48]<br> >

    To explore the full list of Risk Premia strategies and their rankings, including dynamic updates as new data becomes available, we invite you to visit our website at the Link provided.

    Crypto Strategies

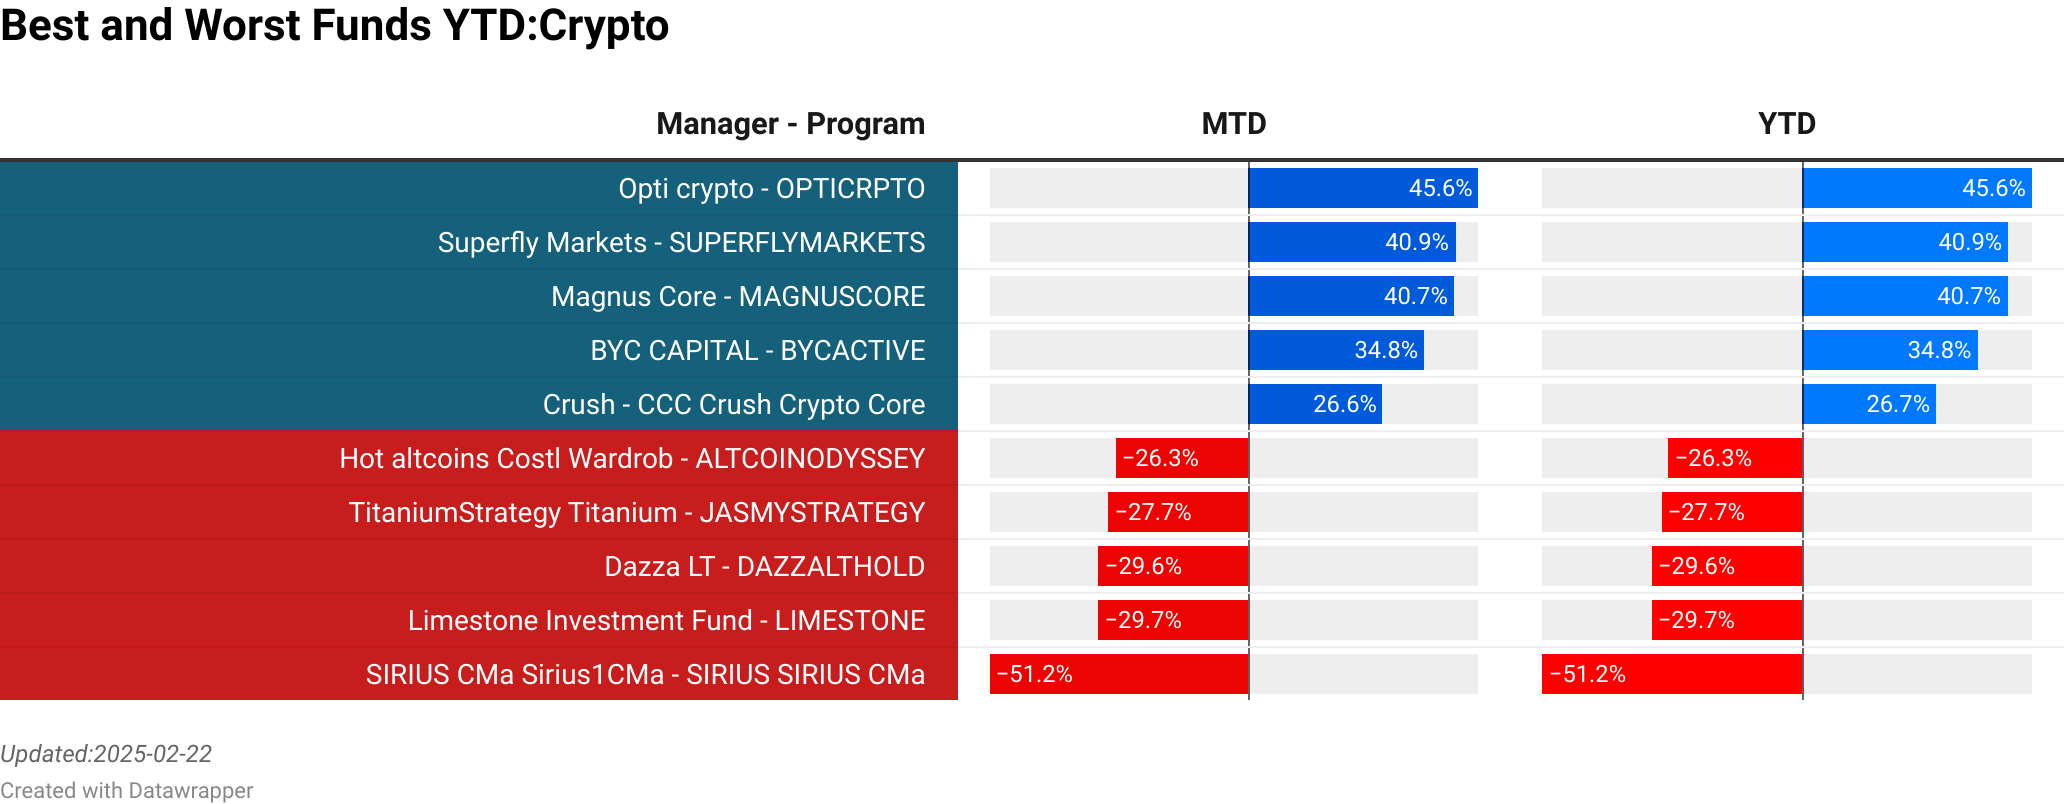
    Opti crypto : OPTICRPTO  :  45.61% [0.00]<br> Superfly Markets : SUPERFLYMARKETS  :  40.90% [0.00]<br> Magnus Core : MAGNUSCORE  :  40.67% [0.00]<br> BYC CAPITAL : BYCACTIVE  :  34.81% [0.00]<br> Crush : CCC Crush Crypto Core  :  26.64% [0.00]<br> Hot altcoins Costl Wardrob : ALTCOINODYSSEY  :  -26.26% [0.00]<br> TitaniumStrategy Titanium : JASMYSTRATEGY  :  -27.68% [0.00]<br> Dazza LT : DAZZALTHOLD  :  -29.59% [0.00]<br> Limestone Investment Fund : LIMESTONE  :  -29.65% [0.00]<br> SIRIUS CMa Sirius1CMa : SIRIUS SIRIUS CMa  :  -51.19% [0.00]<br> >

    To explore the full list of Risk Premia strategies and their rankings, including dynamic updates as new data becomes available, we invite you to visit our website at the Link provided.

    •  

    The NilssonHedge Indices are fully reconstituted

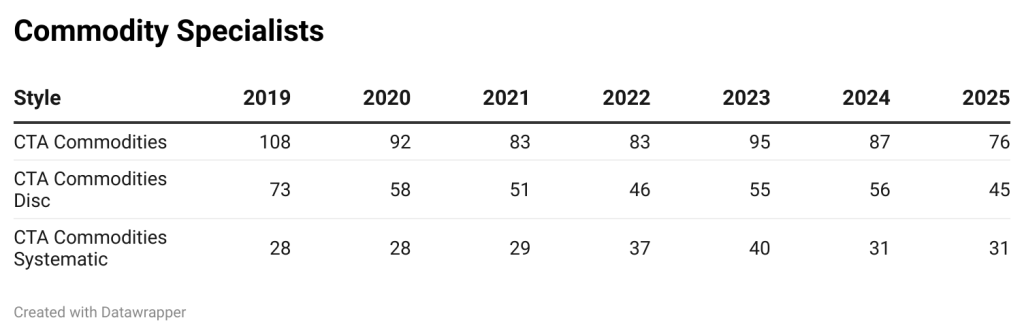
    Behind the scenes, we have reconstituted our indices, adding new members to all of them. Both the ones that are on the website, and the indices that are only available via the download options (e.g. a further breakdown of Commodity Specialists). Each index has fully disclosed members that can be viewed on our website.

    While we observe an increasing number of managers in most of the indices, we also note a decline in the managers that are part of the diversified CTA index. We believe we track a significant part of the managers, but that were delays in reporting final numbers. Our current count of CTAs reporting is back to 600+ in the main database. However, the method to construct the indices remains strict, we only include managers where we have December data at the end of January.

    A trend that seems to be more substantial, is the decline of commodity specialists. These have to a larger degree been insourced by various multi-managers/pod shops. In particular, Systematic Commodity managers had a difficult year as several ‘Alternative’ market managers got whipsawed in the less liquid markets.

    Indices can be downloaded for free here (you need to be registered): https://nilssonhedge.com/my-account/free-data/

    The collection of returns and managers continues to grow. Currently, we have 587k monthly return observations sourced from over 15k unique sources.

    •  

    Top Performing Investment Strategies for 2024

    We have the most recent return data available and are able to sum up 2024. With this data, we can provide a comprehensive overview of the top-performing and bottom-performing strategies for each category. This overview takes into account both monthly and yearly results. Our analysis relies on proprietary composite data streams that we have compiled. However, we must note that there is always the possibility of errors or inaccuracies in our calculations.

    If you have a strategy that is not part of our database, please ensure that we have it before Friday the 31st so that it can become available in our database, please ensure that we have it before Friday the 31st so that it can be included for inclusion in our indices.

    CTA

    Quantitative Investment Management : Global Program 3x  :  17.80% [40.63]<br> Advanced Alpha Advisers : Art Short Term Systematic  :  14.21% [8.20]<br> Mulvaney Capital Management : Global Diversified Program  :  12.76% [352.00]<br> EMC Capital Advisors : Tactical Commodity  :  8.81% [4.48]<br> EMC Capital Advisors : EMC Classic Program  :  8.65% [31.10]<br> Opus Futures : Macro Monitor Program  :  -9.46% [17.35]<br> QQFund.com : Alpha Beta Program  :  -10.02% [9.72]<br> Gnomon Alpha : Global Macro Enhanced 3  :  -16.15% [62.38]<br> Gnomon Alpha : Global Macro Enhanced 4  :  -21.59% [62.38]<br> Asymmetric Technologies : Asymmetric HV Master Fund  :  -31.75% [4.97]<br> >
    Alleman Capital Management : Alleman Capital Crude Hedge  :  3.10% [0.02]<br> Mulvaney Capital Management : Global Diversified Program  :  12.76% [352.00]<br> Advanced Alpha Advisers : Art Short Term Systematic  :  14.21% [8.20]<br> Polar Star Management : Polar Star Spectrum Fund Limited  :  3.87% [162.00]<br> Gold Dragon Worldwide Asset Management Limited : Seahawk China Dynamic Macro Fund  :  5.40% [497.77]<br> Astute Capital Group : Pulse Program  :  2.89% [3.86]<br> Opus Futures : Macro Monitor Program  :  -9.46% [17.35]<br> Haidar Capital Management : Jupiter Fund  :  -4.35% [818.27]<br> Glenhaven Capital : Glenhaven Global II  :  5.48% [3.48]<br> Vigo Capital : Fund  :  -0.78% [1.75]<br> >

    To explore the full list of CTAs and their rankings, please visit our website. It includes dynamic updates as new data becomes available.

    Market Neutral

    AQR Capital Management : Adaptive Equity Market Neutral  :  2.80% [279.76]<br> Blackrock : Asia-Pacific Diversified  :  2.71% [134.14]<br> AQR Capital Management : Equity Market Neutral  :  2.14% [768.85]<br> Scopia Capital Management : Market Neutral  :  2.14% [48.48]<br> Aphilion : Aphilion SIF  :  1.97% [40.34]<br> Fortem Capital : Absolute Return  :  -1.88% [208.70]<br> MarshallWace : ESG Market Neutral  :  -2.25% [1313.58]<br> PIMCO : PIMCO RAE Fundamental Advantage PLUS  :  -2.83% [0.00]<br> MarshallWace : MW Global Opportunities A  :  -4.08% [4655.95]<br> Neo Ivy Capital Management : Neo Ivy  :  -4.13% [0.00]<br> >
    Aphilion : Aphilion SIF  :  1.97% [40.34]<br> Blackrock : Asia-Pacific Diversified  :  2.71% [134.14]<br> AQR Capital Management : Equity Market Neutral  :  2.14% [768.85]<br> MarshallWace : MW Market Neutral TOPS Fund A EUR  :  0.91% [0.00]<br> JPMorgan : Europe Equity Absolute  :  0.92% [683.07]<br> Nanjia Capital Limited : Cyrus  :  0.00% [12.86]<br> Ansa Capital Management : Ansa - Global Q Equity Market Neutral  :  -1.37% [69.44]<br> Sandbar : Global Equity Market Neutral (Lumyna)  :  -0.76% [13.79]<br> PIMCO : PIMCO RAE Fundamental Advantage PLUS  :  -2.83% [0.00]<br> LGT Capital Partners : LGT Sustainable Equity Market  :  1.07% [46.48]<br> >

    To explore the full list of Market Neutral strategies and their rankings, we invite you to visit our website. It includes dynamic updates as new data becomes available. Visit the Link provided.

    Equity Long Short

    Covalis Capital : Covalis Capital Enhanced Fund  :  9.85% [978.21]<br> Redwood Partners : Redwood  :  8.53% [15.40]<br> Alken : Alken Capital One  :  6.08% [122.02]<br> TIND Asset Management : TIND Discovery Fund  :  5.58% [0.00]<br> Origo Fonder : Origo Quest 1  :  5.46% [35.90]<br> Pensum Asset Management : Global Opportunities  :  -8.63% [14.80]<br> Brasil Capital : Brasil Capital Equity Hedge Fund  :  -9.48% [87.00]<br> Toews : Toews Tactical Opportunity  :  -9.77% [0.00]<br> Rhenman & Partners Asset Management : Rhenman Healthcare Equity LS  :  -9.78% [978.00]<br> Trek Capital Management : Reindeer Trek  :  -9.85% [16.00]<br> >
    FMG Malta : Impega  :  3.08% [0.00]<br> HELSINKI CAPITAL PARTNERS : HCP Focus Fund  :  -2.14% [18.00]<br> Contour Asset Management : Tech Long/Short (Schroders)  :  2.97% [184.59]<br> Counterpoint : Counterpoint Tactical Equity  :  -2.30% [0.00]<br> CXC Investments : CXC Opportunities Fund  :  -3.82% [2.04]<br> Odey : Absolute Return Focus Fund  :  -3.90% [89.59]<br> Proxy P Management : Proxy Renewable LongShort Energy  :  -3.48% [25.00]<br> Cleaves Asset Management : Cleaves Shipping Fund  :  -4.31% [0.00]<br> BNP : Environmental Absolute Return  :  -2.01% [11.14]<br> Brasil Capital : Brasil Capital Equity Hedge Fund  :  -9.48% [87.00]<br> >

    To explore the full list of Equity Long Short strategies and their rankings, please visit our website. It includes dynamic updates as new data becomes available.

    Event Driven

    Covalis Capital : Covalis Capital Enhanced Fund  :  9.85% [978.21]<br> Redwood Partners : Redwood  :  8.53% [15.40]<br> Alken : Alken Capital One  :  6.08% [122.02]<br> TIND Asset Management : TIND Discovery Fund  :  5.58% [0.00]<br> Origo Fonder : Origo Quest 1  :  5.46% [35.90]<br> Pensum Asset Management : Global Opportunities  :  -8.63% [14.80]<br> Brasil Capital : Brasil Capital Equity Hedge Fund  :  -9.48% [87.00]<br> Toews : Toews Tactical Opportunity  :  -9.77% [0.00]<br> Rhenman & Partners Asset Management : Rhenman Healthcare Equity LS  :  -9.78% [978.00]<br> Trek Capital Management : Reindeer Trek  :  -9.85% [16.00]<br> >
    FMG Malta : Impega  :  3.08% [0.00]<br> HELSINKI CAPITAL PARTNERS : HCP Focus Fund  :  -2.14% [18.00]<br> Contour Asset Management : Tech Long/Short (Schroders)  :  2.97% [184.59]<br> Counterpoint : Counterpoint Tactical Equity  :  -2.30% [0.00]<br> CXC Investments : CXC Opportunities Fund  :  -3.82% [2.04]<br> Odey : Absolute Return Focus Fund  :  -3.90% [89.59]<br> Proxy P Management : Proxy Renewable LongShort Energy  :  -3.48% [25.00]<br> Cleaves Asset Management : Cleaves Shipping Fund  :  -4.31% [0.00]<br> BNP : Environmental Absolute Return  :  -2.01% [11.14]<br> Brasil Capital : Brasil Capital Equity Hedge Fund  :  -9.48% [87.00]<br> >

    To explore the full list of Event Driven strategies and their rankings, you can visit our website. This includes dynamic updates as new data becomes available. We invite you to check the website at the Link provided.

    Fixed Income

    Axa IM : Volta Finance  :  11.41% [0.00]<br> Nykredit Asset Management : Nykredit EVIRA Hedge Fund  :  8.89% [0.50]<br> Chenavari : Toro Income Fund  :  7.21% [0.00]<br> EJF Investments : Event Driven  :  5.26% [0.00]<br> Enko Capital Management : Africa Debt Fund  :  5.00% [753.80]<br> Bramshill : Income Performance  :  -2.42% [182.98]<br> Fisch Asset Management : Convertible Global Dynamic  :  -2.51% [0.00]<br> Azimut : Long Term Credit Opportunities  :  -3.13% [270.36]<br> GCP : Asset Backed Income  :  -3.18% [0.00]<br> GAM International Management : Star Global Rates  :  -4.04% [222.19]<br> >
    Blackstone : Loan Financing  :  0.27% [0.00]<br> Chenavari : Toro Income Fund  :  7.21% [0.00]<br> GCP : Asset Backed Income  :  -3.18% [0.00]<br> Axa IM : Volta Finance  :  11.41% [0.00]<br> EJF Investments : Event Driven  :  5.26% [0.00]<br> Saba Capital : Carry Neutral Tail Hedge Fund  :  -0.41% [968.00]<br> Lazard : Emerging Markets Debt Blend  :  -2.29% [0.00]<br> GAM International Management : Star Global Rates  :  -4.04% [222.19]<br> Skandinaviska Kreditfonden : Scandinavian Credit Fund I  :  0.94% [388.90]<br> VPC : Specialty Lending Investments  :  4.26% [0.00]<br> >

    To explore the full list of Event Driven strategies and their rankings, including dynamic updates as new data becomes available, please visit our website. You can find the details at the Link provided.

    R

    Crypto Strategies

    Motus Capital Management : Digital Growth  :  34.55% [30.00]<br> Shariah Index Crypto Ummah : HALALINDEX  :  19.45% [0.00]<br> Majors rotation system : MRTSTRATEGY  :  19.34% [0.00]<br> Propips Florian Michel Alain Uguen : PROPIPS  :  18.37% [0.00]<br> Pecunio : PECUNIOTRUSTFUND  :  18.20% [0.00]<br> tilitonga : TILITONGA  :  -30.49% [0.00]<br> Divine Investing : DIVINEINVESTING  :  -30.81% [0.00]<br> Pecunio : PECUNIOTRUSTPORTFOLIO  :  -34.36% [0.00]<br> Limestone Investment Fund : LIMESTONE  :  -34.81% [0.00]<br> Principles Karlheinz Niebuhr Funk : PRINCIPLES  :  -37.26% [0.00]<br> >
    TitaniumStrategy Titanium : JASMYSTRATEGY  :  -13.99% [0.00]<br> Opti crypto : OPTICRPTO  :  7.50% [0.00]<br> PL Digital Management Pte : Presto Digital Fund  :  14.26% [35.49]<br> Magnus Core : MAGNUSCORE  :  4.39% [0.00]<br> BYC CAPITAL : BYCACTIVE  :  -3.11% [0.00]<br> Divine Investing : DIVINEINVESTING  :  -30.81% [0.00]<br> Hot altcoins Costl Wardrob : ALTCOINODYSSEY  :  -30.45% [0.00]<br> Inktomi : INKTOMIHB  :  -23.42% [0.00]<br> Algorithm Performance : ALGORITHMPERFORMANCE  :  -24.29% [0.00]<br> Arjuss : CRYPTOPAR  :  -21.43% [0.00]<br> >

    To explore the full list of Risk Premia strategies and their rankings, please visit our website. There are dynamic updates as new data becomes available. We invite you to visit our website at the Link provided.

    •  

    Become an Index member

    We are rapidly approaching the end of January and the cut-off point for our indices. If you would like your strategy to be part of the constituents for 2025, please ensure we get your numbers before the 31st. Less than ten days left.

    Our indices are free to use (in stark contrast to some of our competitors) and are fully transparent with disclosed constituents. We strive to provide the best estimate of several Hedge Fund strategies, and sub-strategies within each group. This year, we are also publishing additional Crypto Strategies (Market Neutral, Digital Asset Allocators, and Crypto L/S). These indices have been part of the index distribution pack for some time.

    Index Data can be downloaded here (you need to be logged in): https://nilssonhedge.com/my-account/free-data/

    NilssonHedge Indices
    NilssonHedge Indices

    Feel free to explore the different indices, and we are looking forward to including your strategy in the 2025 cohort.

    •  

    Hedge Funds November 2024: Top Performers Revealed

    Based on the most recent return data that we have available, we can provide a comprehensive overview of the top-performing and bottom-performing strategies for each category, taking into account both monthly and yearly results. Our analysis is based on proprietary composite data streams that we have compiled, but we must note that there is always the possibility of errors or inaccuracies in our calculations.

    CTA

    Alleman Capital Management : Alleman Capital Crude Hedge  :  4.46% [0.02]<br> Mulvaney Capital Management : Global Diversified Program  :  6.99% [313.00]<br> Advanced Alpha Advisers : Art Short Term Systematic  :  1.92% [8.20]<br> Polar Star Management : Polar Star Spectrum Fund Limited  :  9.78% [156.00]<br> Asymmetric Technologies : Asymmetric HV Master Fund  :  36.75% [5.72]<br> Cayler Capital : Systematic Energy Diversified  :  -0.30% [14.50]<br> Arion Investment Management : Arion Copper Arbitrage  :  3.16% [14.00]<br> SMN Investment Services : Structural Alpha Trend  :  -7.40% [73.18]<br> Comhla : Artemis  :  1.30% [0.54]<br> Vigo Capital : Fund  :  -0.34% [1.76]<br> >

    To explore the full list of CTAs and their rankings, including dynamic updates as new data becomes available, we invite you to visit our website at the Link provided.

    Market Neutral

    Seven Seas : Alpha Japan Neutral (Permal)  :  5.05% [22.11]<br> AQR Capital Management : Equity Market Neutral  :  3.81% [722.97]<br> BNP Theam : Quant Dispersion US  :  3.77% [112.72]<br> AQR Capital Management : Adaptive Equity Market Neutral  :  3.14% [279.76]<br> Blackrock : Asia-Pacific Diversified  :  3.09% [134.14]<br> Meriti Capital : Meriti Neutral  :  -1.57% [0.00]<br> Vanguard : Vanguard Market Neutral  :  -1.69% [0.00]<br> Neo Ivy Capital Management : Neo Ivy  :  -1.79% [0.00]<br> Ansa Capital Management : Ansa - Global Q Equity Market Neutral  :  -3.53% [69.44]<br> Crossmark Steward : Equity MN Instl  :  -3.84% [0.00]<br> >
    Aphilion : Aphilion SIF  :  1.99% [38.24]<br> AQR Capital Management : Equity Market Neutral  :  3.81% [722.97]<br> Blackrock : Asia-Pacific Diversified  :  3.09% [134.14]<br> Gotham : Gotham Neutral  :  -0.62% [0.00]<br> Federated Hermes : MDT Market Neutral  :  0.21% [0.00]<br> Ansa Capital Management : Ansa - Global Q Equity Market Neutral  :  -3.53% [69.44]<br> Pictet Asset Management : Agora  :  0.85% [75.59]<br> Nanjia Capital Limited : Cyrus  :  0.00% [12.86]<br> Sandbar : Global Equity Market Neutral (Lumyna)  :  -0.37% [13.79]<br> LGT Capital Partners : LGT Sustainable Equity Market  :  -1.25% [46.48]<br> >

    To explore the full list of Market Neutral strategies and their rankings, including dynamic updates as new data becomes available, we invite you to visit our website at the Link provided.

    Equity Long Short

    Caldwell & Orkin : Caldwell & Orkin - Gator Capital L/S  :  13.81% [0.00]<br> HELSINKI CAPITAL PARTNERS : HCP Focus Fund  :  12.26% [19.20]<br> Toews : Toews Tactical Opportunity  :  10.03% [0.00]<br> Alpha DNA : Small Cap Hedged  :  9.82% [3.88]<br> Argonaut : Absolute Return  :  9.57% [198.36]<br> Chinaamc : China Growth  :  -5.33% [5.00]<br> Cederberg Capital : Greater China (Banor)  :  -6.61% [94.97]<br> Cleaves Asset Management : Cleaves Shipping Fund  :  -7.00% [0.00]<br> Accendo Capital : Accendo Capital  :  -8.10% [146.40]<br> Fidelity : Global Contrarian Long Short  :  -11.39% [11.66]<br> >
    HELSINKI CAPITAL PARTNERS : HCP Focus Fund  :  12.26% [19.20]<br> FMG Malta : Impega  :  6.38% [0.00]<br> Caldwell & Orkin : Caldwell & Orkin - Gator Capital L/S  :  13.81% [0.00]<br> CXC Investments : CXC Opportunities Fund  :  7.04% [2.08]<br> Counterpoint : Counterpoint Tactical Equity  :  5.68% [0.00]<br> Cleaves Asset Management : Cleaves Shipping Fund  :  -7.00% [0.00]<br> Proxy P Management : Proxy Renewable LongShort Energy  :  2.06% [35.00]<br> Adrigo Asset Management : Adrigo Small  & Midcap LS  :  -1.35% [24.00]<br> Fidelity : Global Contrarian Long Short  :  -11.39% [11.66]<br> BNP : Environmental Absolute Return  :  -3.59% [11.14]<br> >

    To explore the full list of Equity Long Short strategies and their rankings, including dynamic updates as new data becomes available, we invite you to visit our website at the Link provided.

    Event Driven

    Caldwell & Orkin : Caldwell & Orkin - Gator Capital L/S  :  13.81% [0.00]<br> HELSINKI CAPITAL PARTNERS : HCP Focus Fund  :  12.26% [19.20]<br> Toews : Toews Tactical Opportunity  :  10.03% [0.00]<br> Alpha DNA : Small Cap Hedged  :  9.82% [3.88]<br> Argonaut : Absolute Return  :  9.57% [198.36]<br> Chinaamc : China Growth  :  -5.33% [5.00]<br> Cederberg Capital : Greater China (Banor)  :  -6.61% [94.97]<br> Cleaves Asset Management : Cleaves Shipping Fund  :  -7.00% [0.00]<br> Accendo Capital : Accendo Capital  :  -8.10% [146.40]<br> Fidelity : Global Contrarian Long Short  :  -11.39% [11.66]<br> >
    HELSINKI CAPITAL PARTNERS : HCP Focus Fund  :  12.26% [19.20]<br> FMG Malta : Impega  :  6.38% [0.00]<br> Caldwell & Orkin : Caldwell & Orkin - Gator Capital L/S  :  13.81% [0.00]<br> CXC Investments : CXC Opportunities Fund  :  7.04% [2.08]<br> Counterpoint : Counterpoint Tactical Equity  :  5.68% [0.00]<br> Cleaves Asset Management : Cleaves Shipping Fund  :  -7.00% [0.00]<br> Proxy P Management : Proxy Renewable LongShort Energy  :  2.06% [35.00]<br> Adrigo Asset Management : Adrigo Small  & Midcap LS  :  -1.35% [24.00]<br> Fidelity : Global Contrarian Long Short  :  -11.39% [11.66]<br> BNP : Environmental Absolute Return  :  -3.59% [11.14]<br> >

    To explore the full list of Event Driven strategies and their rankings, including dynamic updates as new data becomes available, we invite you to visit our website at the Link provided.

    Fixed Income

    Blackstone : Loan Financing  :  10.42% [0.00]<br> Fair Oaks Capital : Income  :  5.14% [0.00]<br> Acheron Capital : Life Settlement Assets  :  4.16% [0.00]<br> GCP : Asset Backed Income  :  4.01% [0.00]<br> Vontobel Asset Management : Twenty Four Income Fund  :  3.30% [0.00]<br> Nordea Asset Management : European Rates Opportunity  :  -1.72% [399.60]<br> Petersen & Partners Investment Management : PPIM Core Fixed Income  :  -1.75% [124.00]<br> Nordea Asset Management : Nordic Rates Opportunity  :  -2.02% [46.80]<br> GAM International Management : Star Global Rates  :  -3.66% [222.19]<br> VPC : Specialty Lending Investments  :  -11.72% [0.00]<br> >
    Blackstone : Loan Financing  :  10.42% [0.00]<br> GCP : Asset Backed Income  :  4.01% [0.00]<br> Chenavari : Toro Income Fund  :  2.19% [0.00]<br> EJF Investments : Event Driven  :  1.89% [0.00]<br> Norselab : Real Estate Credit Opportunities  :  0.93% [155.60]<br> GAM International Management : Star Emerging Market  :  -0.41% [5.09]<br> Lazard : Emerging Markets Debt Blend  :  -0.52% [0.00]<br> Legg Mason : Western Asset Macro Opp  :  0.00% [270.85]<br> Skandinaviska Kreditfonden : Scandinavian Credit Fund I  :  -0.09% [388.90]<br> VPC : Specialty Lending Investments  :  -11.72% [0.00]<br> >

    To explore the full list of Event Driven strategies and their rankings, including dynamic updates as new data becomes available, we invite you to visit our website at the Link provided.

    Risk Premia

    Mount Lucas Management Corporation : AlphaCentric Symmetry Strategy  :  5.58% [0.00]<br> SharpeMachine : Eagle Vision  :  5.33% [0.17]<br> Oxeye Capital Management : Oxeye (BOPS) 5X  :  4.48% [4.47]<br> Neuberger Berman : US Equity Put Write  :  3.63% [552.83]<br> Nordea Asset Management : Nordea 1  Alpha 15 MA Fund  :  3.59% [3678.00]<br> Morgan Stanley : Systematic Liquid Alpha Fund  :  -0.42% [89.12]<br> BNP Theam : Quant Cross Asset High Focus  :  -0.43% [616.11]<br> Lumyna : Merrill Lynch MCLX  :  -1.42% [264.64]<br> BNP Theam : Quant Alpha Commodity  :  -2.07% [79.87]<br> Quadriga : Stable Return  :  -6.20% [4.89]<br> >
    AQR Capital Management : Style Premia  :  0.16% [329.07]<br> AQR Capital Management : Style Premia Alternative  :  0.91% [1190.00]<br> AQR Capital Management : Alternative Risk Premia  :  2.07% [0.00]<br> Neuberger Berman : US Equity Put Write  :  3.63% [552.83]<br> Blackrock : Style Advantage  :  0.56% [123.31]<br> Schroders : Isf Alternative Risk  :  0.02% [261.34]<br> Santander : Global Volatility  :  0.00% [22.83]<br> BNP Theam : Quant Alpha Commodity  :  -2.07% [79.87]<br> BNP Theam : Quant Cross Asset High Focus  :  -0.43% [616.11]<br> Quadriga : Stable Return  :  -6.20% [4.89]<br> >

    To explore the full list of Risk Premia strategies and their rankings, including dynamic updates as new data becomes available, we invite you to visit our website at the Link provided.

    Crypto Strategies

    Opti crypto : OPTICRPTO  :  280.0% [0.00]<br> Magnus Core : MAGNUSCORE  :  263.1% [0.00]<br> BYC CAPITAL : BYCACTIVE  :  187.2% [0.00]<br> Digital Revolution : DIGITALREVOLUTION  :  179.8% [0.00]<br> Pecunio : PECUNIOTRUSTPORTFOLIO  :  154.8% [0.00]<br> Fore Elite Capital Management : ForeElite Flagship Fund  :  -0.04% [146.82]<br> Pecunio : PCC Pecun.io Cryptocurrency  :  -0.93% [0.00]<br> LibertyRoad Capital : BTC Active Treasury  :  -1.25% [42.00]<br> Nostradamus Adoption Prophecy : NOSTRADAMUSADOPTIONPROPHECY  :  -4.97% [0.00]<br> ML Tech : Statistical Arbitrage TS3  :  -7.65% [8.00]<br> >
    TitaniumStrategy Titanium : JASMYSTRATEGY  :  69.96% [0.00]<br> Pecunio : PECUNIOTRUSTPORTFOLIO  :  154.8% [0.00]<br> Opti crypto : OPTICRPTO  :  280.0% [0.00]<br> BYC CAPITAL : BYCACTIVE  :  187.2% [0.00]<br> napfton : NAPFTON  :  35.33% [0.00]<br> Inktomi : INKTOMIHB  :  56.78% [0.00]<br> BigCoinMix : BCOINMIX  :  88.21% [0.00]<br> Algorithm Performance : ALGORITHMPERFORMANCE  :  25.58% [0.00]<br> Nostradamus Adoption Prophecy : NOSTRADAMUSADOPTIONPROPHECY  :  -4.97% [0.00]<br> Arjuss : CRYPTOPAR  :  66.65% [0.00]<br> >

    To explore the full list of Risk Premia strategies and their rankings, including dynamic updates as new data becomes available, we invite you to visit our website at the Link provided.

    •  

    Global Investment Report – Summing up 2024

    AN ELECTION RALLY SENDS STOCKS TO NEW HIGHS IN THE SHADOW OF RISING UNCERTAINTY ABOUT WHAT’S TO COME

    If you want to jump directly to the final update of the year of Global Investment Survey of hedge funds please click this link.

    1. Key takeaways from this quarter’s report
    2. Top-performing strategies in 2024 through September
    3. The market going into 2025—opportunities and risks
    4. November election and what it may mean for economies, markets, and hedge funds
    5. When a truly consistent fund manager suddenly fails

    Hi Eric…a few things have happened since we last convened. But let’s start with what was the leading takeaway from this quarter’s report?

    While the market has soared past its trailing three- and five-year annualized returns through 2023, the Top 50 is on pace to generate returns consistent with those two periods.

    The S&P 500 TR was up more than 22% over the first nine months of the year, and that was before the rally that followed Trump’s win in November. If the market ends the year up 30%, which it may do, that would be twice its five-year annualized returns and three times its three-year returns. Historically, that kind of deviation is usually accompanied by a correction at some point.

    (Since 1960, the last time the S&P delivered multiyear 20+% returns was right before the Tech Wreck.)

    HIgher deviation was also evident in the average hedge fund performance, which was up 9.5% through September. Three-year annualized returns through 2023 were 3.4% and five-year returns was 6.30%. And the average correlation with the market over that long-period was 0.91.

    When 2024 performance is included in that calculation, the average hedge fund will likely show even greater market correlation.

    That’s the last thing LPs should want out of an alternative investment because it suggests a lack of independent investing which won’t provide much shelter when the rally falters.

    The Top 50 was up 9.2%. That puts it on pace to track with its three- and five-year returns. This kind of consistency is the thesis behind the creation of the Top 50—not to deliver outsized gains but to find funds that remain steady through all kinds of economic and market conditions.

    The Top 50 five-year correlation at the end of 2023 was a far more appealing 0.31, which this year’s performance will likely sustain.

    Does anything else stand out? I have noted that you have a relatively large number of emerging market managers on your list.

    Yes.

    The second takeaway was the continued outperformance of the six emerging market managers who made this year’s survey—the most that ever qualified. The group’s 13.3% return made it the top-performing strategy in the Top 50.

    Moreover, two of the four best performing funds YTD were EM: No. 33-ranked Sandglass Capital (EM credit) was up 24.2%; Top-ranked Peconic Grenadier (equity long/short) generated gains of 18.6%; 15th-ranked DE Shaw Oculus (macro) was up 16.1%; and 18th-ranked Enko Africa Debt (EM credit) rallied 15.9%.

    Our recent EM webinar involving some of the top managers in the space, including the likes of Wellington Management and Cheyne Capital, highlighted this remarkable source of unexpected Alpha.  And Bloomberg responded to our findings by publishing articles on two of our Top 50 EM managers.

    Do you feel that the market will rally through the first half of 2025, bringing hedge funds along for the ride?

    The safe answer is Yes, at least over the next quarter or two.

    There is a great deal of enthusiasm driven by the Republican sweep of the elections and the sentiment that policies, from regulations to taxes, will be benefitting businesses.

    The present trajectory of the economy has been remarkably steady and sustainable. Adding any kind of accelerant runs the chance of altering the balance between growth and declining inflation which has enabled the Fed to cut interest rates.

    But Trump’s agenda is introducing a whole series of risks that may bring more uncertainty and volatility. It’s worth considering just four of his signature proposals.

    The likely introduction of a broad range of tariffs introduces a new untested risk that most economists don’t favor and which will ultimately be paid for by end consumers. This means prices will rise.

    Reducing regulations and market oversight may unleash M&A activity to boost share prices. But unconstrained deal-making will consolidate industry ownership, reducing competition, increasing pricing power and inflationary risks.

    If US Government again ignores climate and environmental risks that are evident around the globe in order to stimulate more growth, then they these risks will intensify and cause environmental, economic and inflationary problems.

    And there have been discussions about rolling back several of Biden’s major legislative accomplishments: infrastructure, chips and green energy initiatives. These are long-term financial commitments that benefit the entire country and may be providing the lift that has sustained growth while economists anticipated recession. Removing such important stimuli (much of which is essential) could be like proverbially pulling the rug out from under the economy.
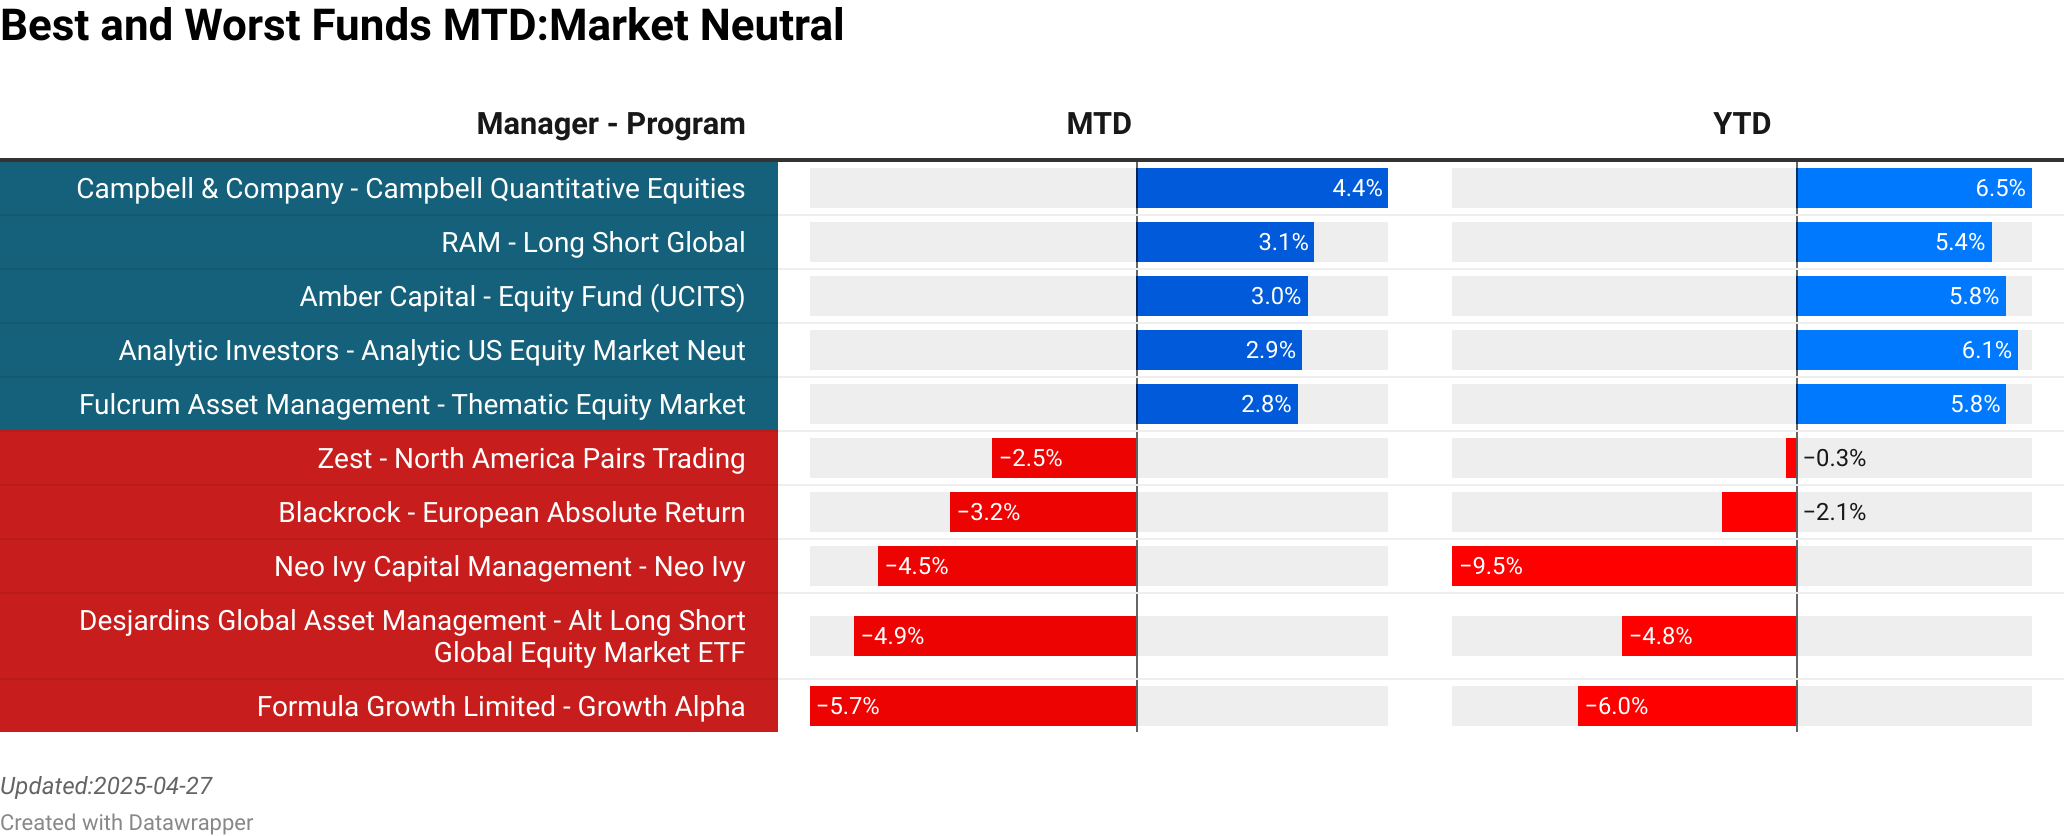
    So you’re worried about the next administration’s handling of the economy and impacts on markets?

    Yes.

    As mentioned, the US has been enjoying a remarkable balance between economic and job growth and declining inflation—something most pundits thought was impossible.

    Our economy and market don’t need any additional hyping. But that’s what President Trump is bent on doing.

    David Kelly, chief global strategist at J.P. Morgan Asset Management, thinks even partial implementation of Trump’s proposed policies, “would likely result in sharply-rising government debt and the potential, in some areas, for building economic and market risks.”

    In such a scenario, he thinks “investors would be well advised to continue to rebalance portfolios both across asset classes and around the world.” 

    Anyone other prominent figures feeling cautious?

    While Warren Buffett and Berkshire Hathaway haven’t chimed in about the post-election results and rally, it just may be that the firm was anticipating a sweeping Republican victory as many in finance were expecting it.

    I have no clue if that factored into the firm’s decision to stockpile record cash of $325 billion. In doing so, the firm has clearly reduced its market exposure.

    As David Einhorn recently told investors, Buffett has an uncanny ability to do what even he says can’t be done–time the market.

    Einhorn recalls Buffett having closed his fund by the end of the 1960s, sidestepping the ensuing lost decade. He again sold “nearly everything” before the 1987 crash. And he was well positioned to exploit opportunities after the 2008 financial crisis.

    For hedge fund managers and investors who are going all in with the rally, it may be worth noting what’s going on in Omaha.

    While Europeans weren’t shocked that Trump won, the post-election autopsy seems to be faulting Democratic policies. Do you have any unique perspectives about why a close race didn’t end up that way?

    Yes. There’s a disconnect between how well the economy is doing, soaring values of stocks and 401Ks, the remarkable legislative accomplishments of the Biden administration, and frustration voters expressed. We have never seen this before in modern American history.

    I’ll highlight just two matters that I find hard to wrap my head around—both likely the result of the majority of Americans now getting their news from unvetted social media and walling themselves off from differing perspectives.

    Blaming Biden for inflation is like blaming the weatherman for rain. It was a global phenomenon resulting from a cascade of events. His covid-induced American Rescue Plan was not the trigger. If it was, US inflation would’ve have been far greater than elsewhere and would not have fallen faster than any other developed economy has experienced.

    Moreover, prices have risen not only due to higher costs but due to businesses finally seeing an opportunity to raise prices after years of not doing so.

    Regardless of what any politician claims, the only way to bring prices down is through instigating deflation, which no one is advocating. And what the next president is proposing is likely to send prices even higher and threaten future rate cuts and growth.

    The second issue: Trump’s victory canceled the import of January 6th and the need to render a legal accounting for one of the most shocking events in recent American history. And there’s more than a passing parallel to the same failure to have held bank executives accountable for the 2008 financial crisis and the risks that are still extant today.

    A truly unusual event for the Top 50: one of them failed. What happened?

    It was a volatility trader—14th-ranked Dynamic Alpha managed by Seattle-based Lattice Capital Management. After having enough years under its belt to qualify for the survey, it then made my short list for three straight years.

    Since its launch in May 2016, the fund has been realizing consistent gains of 16% annually for more than 8 years. And it was doing so more impressively than most of its larger competitors by focusing exclusively on the S&P 500.

    The fund was always clear about its Achilles Heel: Soaring short-term market volatility without a major market selloff. This didn’t seem likely. But markets can deviate from the logical.

    That’s what happened in early August after the Japanese Central Bank nudged up interest rates by a mere 15 bps. Not long after, S&P volatility spiked above 65 and over several days the S&P lost 6%.

    Option chain pricing of the S&P 500 broke down. The normal bid-ask spread of around $1 soared to an inexplicable $180 in pre-market trading on Monday August 5th. A contributing factor, according to a source familiar with options trading, was major market makers significantly pulled back, effectively reducing liquidity, hampering pricing and exaggerating the chaos.

    The fund suddenly found itself down by more than 20%. Management, which has significant exposure to the fund, believed it was looking down a barrel of a gun. It thought trading disfunction was revealing cracks in the American economy that weren’t there.

    Had it decided to ride out this very rough patch, according to a source familiar with the fund, Dynamic Alpha likely would’ve recovered and turned a profit in August, adding to its gains through July of 7-plus percent.

    Instead, management decided to shut down the fund.

    In doing so, it compounded existing losses, failing to benefit from the recovery that started just days later. By the time the fund had fully liquidated its positions, August losses cascaded to 40%.

    There are basic parallels between LTCM and Dynamic Alpha: sound strategies that revealed problematic execution when an extreme condition hit.

    LTCM failed not because of its underlying investments but because it didn’t keep enough unencumbered cash on hand to match its leverage and meet margin calls to enable it to ride out turbulence. For Dynamic Alpha, its strategy remained sound. But it apparently never gamed out what it should do in the event of extreme decoupling of the VIX and the market.  

    The key takeaway I see: if there is a weakness in any strategy, despite the remoteness of it happening, push managers to see if they have conceived a variety of robust responses—short of shutting down.

    If a manager can’t answer such a core question, don’t invest because in case of a meltdown, you’ll never be able to divest in time.

    Thanks Eric, always a pleasure to have you here. Please check out Eric’s latest report here

    •  

    Best’n’Worst October 2024

    Based on the most recent return data that we have available, we can provide a comprehensive overview of the top-performing and bottom-performing strategies for each category, taking into account both monthly and yearly results. Our analysis is based on proprietary composite data streams that we have compiled, but we must note that there is always the possibility of errors or inaccuracies in our calculations.

    CTA

    Quantitative Investment Management : Global Program 3x  :  15.27% [49.93]<br> P/E Investments : FX Strategy - Aggressive  :  12.62% [15100.00]<br> INSCH Kintore : CrossBorder Kintore Fund  :  11.61% [1.08]<br> INSCH Kintore : CrossBorder Kintore XAU/FX  :  11.61% [73.65]<br> RCMA Capital : Merchant Commodity Fund  :  8.63% [272.00]<br> Purple Valley Capital : Diversified Trend 1  :  -14.18% [5.50]<br> Hamer Trading : Systematic Diversified Program  :  -14.71% [15.53]<br> EMC Capital Advisors : EMC Classic Program  :  -14.73% [28.72]<br> Gnomon Alpha : Global Macro Enhanced 3  :  -18.27% [71.45]<br> Gnomon Alpha : Global Macro Enhanced 4  :  -25.59% [71.45]<br> >
    Alleman Capital Management : Alleman Capital Crude Hedge  :  8.51% [0.02]<br> Moddco Capital Associates : MCA  :  -9.84% [0.24]<br> Mulvaney Capital Management : Global Diversified Program  :  -12.25% [292.00]<br> Advanced Alpha Advisers : Art Short Term Systematic  :  7.88% [6.70]<br> INSCH Kintore : CrossBorder Kintore XAU/FX  :  11.61% [73.65]<br> SMN Investment Services : Structural Alpha Trend  :  -2.50% [72.23]<br> Arion Investment Management : Arion Copper Arbitrage  :  2.68% [14.00]<br> Haidar Capital Management : Jupiter Fund  :  -10.81% [985.70]<br> Comhla : Artemis  :  -7.53% [0.53]<br> Vigo Capital : Fund  :  -0.51% [1.90]<br> >

    To explore the full list of CTAs and their rankings, including dynamic updates as new data becomes available, we invite you to visit our website at the Link provided.

    Equity Long Short

    Pensum Asset Management : Global Opportunities  :  8.00% [14.80]<br> Borea Asset Management AS : Borea Utbytte  :  7.54% [260.30]<br> Atlant Fonder : Atlant Edge  :  6.67% [12.80]<br> Origo Fonder : Origo Quest 1  :  3.89% [35.20]<br> Contour Asset Management : Tech Long/Short (Schroders)  :  3.76% [184.59]<br> Proxy P Management : Energy Transition  :  -7.68% [6.96]<br> Cederberg Capital : Greater China (Banor)  :  -9.97% [94.97]<br> Gersemi Asset Management AS : Shipping Fund  :  -10.90% [0.00]<br> Cleaves Asset Management : Cleaves Shipping Fund  :  -12.60% [0.00]<br> Accendo Capital : Accendo Capital  :  -13.11% [146.40]<br> >
    FMG Malta : Impega  :  0.00% [0.00]<br> HELSINKI CAPITAL PARTNERS : HCP Focus Fund  :  2.94% [16.80]<br> Quantitative Investment Management : Tactical Fund  :  -7.20% [377.00]<br> Counterpoint : Counterpoint Tactical Equity  :  1.51% [0.00]<br> CXC Investments : CXC Opportunities Fund  :  -1.34% [1.96]<br> Sherborne : Investors Guernsey  :  -1.56% [0.00]<br> Proxy P Management : Energy Transition  :  -7.68% [6.96]<br> Adrigo Asset Management : Adrigo Small  & Midcap LS  :  -5.19% [27.30]<br> Proxy P Management : Proxy Renewable LongShort Energy  :  -6.45% [35.00]<br> BNP : Environmental Absolute Return  :  0.26% [11.14]<br> >

    To explore the full list of Equity Long Short strategies and their rankings, including dynamic updates as new data becomes available, we invite you to visit our website at the Link provided.

    Event Driven

    Pensum Asset Management : Global Opportunities  :  8.00% [14.80]<br> Borea Asset Management AS : Borea Utbytte  :  7.54% [260.30]<br> Atlant Fonder : Atlant Edge  :  6.67% [12.80]<br> Origo Fonder : Origo Quest 1  :  3.89% [35.20]<br> Contour Asset Management : Tech Long/Short (Schroders)  :  3.76% [184.59]<br> Proxy P Management : Energy Transition  :  -7.68% [6.96]<br> Cederberg Capital : Greater China (Banor)  :  -9.97% [94.97]<br> Gersemi Asset Management AS : Shipping Fund  :  -10.90% [0.00]<br> Cleaves Asset Management : Cleaves Shipping Fund  :  -12.60% [0.00]<br> Accendo Capital : Accendo Capital  :  -13.11% [146.40]<br> >
    FMG Malta : Impega  :  0.00% [0.00]<br> HELSINKI CAPITAL PARTNERS : HCP Focus Fund  :  2.94% [16.80]<br> Quantitative Investment Management : Tactical Fund  :  -7.20% [377.00]<br> Counterpoint : Counterpoint Tactical Equity  :  1.51% [0.00]<br> CXC Investments : CXC Opportunities Fund  :  -1.34% [1.96]<br> Sherborne : Investors Guernsey  :  -1.56% [0.00]<br> Proxy P Management : Energy Transition  :  -7.68% [6.96]<br> Adrigo Asset Management : Adrigo Small  & Midcap LS  :  -5.19% [27.30]<br> Proxy P Management : Proxy Renewable LongShort Energy  :  -6.45% [35.00]<br> BNP : Environmental Absolute Return  :  0.26% [11.14]<br> >

    To explore the full list of Event Driven strategies and their rankings, including dynamic updates as new data becomes available, we invite you to visit our website at the Link provided.

    Fixed Income

    Blackstone : Loan Financing  :  4.71% [0.00]<br> EJF Investments : Event Driven  :  4.09% [0.00]<br> Axa IM : Volta Finance  :  3.84% [0.00]<br> Enko Capital Management : Africa Debt Fund  :  3.58% [707.90]<br> Nykredit Asset Management : Nykredit EVIRA Hedge Fund  :  2.43% [27.10]<br> Excalibur Asset Management : Excalibur  :  -3.48% [101.60]<br> CABA Capital : CABA Flex2  :  -3.71% [0.00]<br> Legg Mason : Western Asset Macro Opp  :  -4.84% [270.85]<br> Lazard : Emerging Markets Debt Blend  :  -5.25% [0.00]<br> BioPharma : BioPharma Credit  :  -5.90% [0.00]<br> >
    Blackstone : Loan Financing  :  4.71% [0.00]<br> GCP : Asset Backed Income  :  -0.77% [0.00]<br> Chenavari : Toro Income Fund  :  -0.94% [0.00]<br> Fondsmaglerselskabet Marselis : Marselis Credit Fund  :  1.10% [0.00]<br> Norselab : Real Estate Credit Opportunities  :  0.80% [142.60]<br> Lazard : Emerging Markets Debt Blend  :  -5.25% [0.00]<br> Amundi : Quantitative Global Absolute Bond  :  1.45% [64.96]<br> Legg Mason : Western Asset Macro Opp  :  -4.84% [270.85]<br> Skandinaviska Kreditfonden : Scandinavian Credit Fund I  :  1.67% [388.90]<br> VPC : Specialty Lending Investments  :  -0.75% [0.00]<br> >

    To explore the full list of Event Driven strategies and their rankings, including dynamic updates as new data becomes available, we invite you to visit our website at the Link provided.

    Risk Premia

    Oxeye Capital Management : Oxeye (BOPS) 5X  :  2.36% [4.36]<br> Blackrock : Style Advantage  :  2.12% [123.31]<br> Quadriga : Stable Return  :  2.03% [4.89]<br> Allianz Global Investors : Multi Asset Risk Premia  :  2.01% [54.11]<br> Lumyna : Merrill Lynch MCLX  :  1.90% [264.64]<br> Neuberger Berman : NB Breton Hill Multi Style Premia  :  -3.66% [225.00]<br> Mount Lucas Management Corporation : AlphaCentric Symmetry Strategy  :  -3.84% [0.00]<br> Catalyst Funds : Systematic Alpha  :  -4.46% [0.00]<br> SharpeMachine : Eagle Vision  :  -5.18% [0.16]<br> Quantedge Capital : Quantedge Global Fund  :  -8.87% [3621.28]<br> >
    AQR Capital Management : Style Premia  :  1.43% [329.07]<br> Quantedge Capital : Quantedge Global Fund  :  -8.87% [3621.28]<br> AQR Capital Management : Style Premia Alternative  :  1.01% [1190.00]<br> AQR Capital Management : Alternative Risk Premia  :  -3.55% [0.00]<br> Blackrock : Style Advantage  :  2.12% [123.31]<br> 7orca Asset Managment AG : 7orca Vega Return I  :  -0.32% [0.00]<br> Nordea Asset Management : Nordea 1  Alpha 15 MA Fund  :  -3.56% [3678.00]<br> BNP Theam : Quant Cross Asset High Focus  :  1.15% [616.11]<br> NN Investment Partners : Multi Asset Factor Opportunities  :  -2.04% [325.09]<br> Quadriga : Stable Return  :  2.03% [4.89]<br> >

    To explore the full list of Risk Premia strategies and their rankings, including dynamic updates as new data becomes available, we invite you to visit our website at the Link provided.

    Crypto Strategies

    Metaworld Fund : Metaworld Fund  :  13.69% [2.76]<br> Future Index : FUTUREINDEX  :  13.65% [0.00]<br> Rivemont Investments : Rivemont Crypto Fund  :  13.01% [6.27]<br> KryptoStar CORE : KryptoStar CORE  :  12.29% [0.00]<br> Salty& Sweet : SOLANASTRATEGY  :  12.25% [0.00]<br> FutureProof : POSCRYPTO  :  -19.16% [0.00]<br> WaveRide : WAVERIDE  :  -19.81% [0.00]<br> BigCoinMix : BCOINMIX  :  -19.82% [0.00]<br> CryptoGen : CRYPTOGEN  :  -20.63% [0.00]<br> Dazza LT : DAZZALTHOLD  :  -29.09% [0.00]<br> >
    Anna Asset Management : Anna Fund  :  -4.69% [34.10]<br> TitaniumStrategy Titanium : JASMYSTRATEGY  :  -13.58% [0.00]<br> PL Digital Management Pte : Presto Digital Fund  :  4.31% [22.28]<br> napfton : NAPFTON  :  3.36% [0.00]<br> PL Digital Management Pte : Presto Digital Fund 1  :  3.77% [6.52]<br> Crush : CCC Crush Crypto Core  :  -14.24% [0.00]<br> BitcoinTradingStrategy : BITCOINTRADINGSTRATEGY  :  -7.12% [0.00]<br> Inktomi : INKTOMIHB  :  -11.92% [0.00]<br> BigCoinMix : BCOINMIX  :  -19.82% [0.00]<br> Arjuss : CRYPTOPAR  :  -11.97% [0.00]<br> >

    To explore the full list of Risk Premia strategies and their rankings, including dynamic updates as new data becomes available, we invite you to visit our website at the Link provided.

    •  

    Trend – A Fortuitous Change in Bond Exposure

    Trend Following had a lackluster October, largely driven by unwinding positions in Bonds (shifting from long to short) and Currencies (adding to long USD exposures). This resulted in a net loss of 4.2%, and a chunk of that looks to be recovered today, the day after the post-election of Trump II. We are most likely looking for a positive day, on a day when equities showed some remarkable positive skew.

    Beta and Correlation shows decreasing bond exposure, but these are lagged measures of exposure

    While correlations can be a good risk estimate, in a period with quickly changing positions, it is lagging indicator. Therefore, we turn to our ETF position indicator. We note that Fixed Income and Currencies got whipsawed in October, but seem to have saved the portfolios of many CTAs during early November.

    The recent long exposure in Fixed Income was gradually exited and a short exposure was reestablished. As the election results are pointing toward a Republican sweep, US Fixed Income Futures had a lackluster day and the USD strengthened; both benefitting CTAs. This may be one of the shortest longs in Trend Following history.

    Equities, a long-held view for most CTAs clearly enjoyed the strong US markets. Energy markets, sold off further adding to profits.

    The above is true for longer-term trend followers, the strategy that suffered the most in October. Maybe the quarterly seasonality is still alive, the 4th quarter is usually good for trend followers. Tomorrow is FOMC day.

    •  

    Best’n’Worst September 202

    Based on the most recent return data that we have available, we can provide a comprehensive overview of the top-performing and bottom-performing strategies for each category, taking into account both monthly and yearly results. Our analysis is based on proprietary composite data streams that we have compiled, but we must note that there is always the possibility of errors or inaccuracies in our calculations.

    CTA

    Gnomon Alpha : Global Macro Enhanced 4  :  20.29% [75.88]<br> Martin Fund Management : Martin Options Program  :  20.09% [125.00]<br> AG Capital : Discretionary Global Macro  :  14.68% [224.90]<br> Gnomon Alpha : Global Macro Enhanced 3  :  14.64% [75.88]<br> Astute Capital Group : Pulse Program  :  11.93% [4.97]<br> Salus Alpha Capital : Directional Markets (DMX)  :  -6.45% [100.00]<br> Moddco Capital Associates : MCA  :  -6.68% [0.26]<br> Advanced Alpha Advisers : Art Short Term Systematic  :  -7.18% [6.00]<br> Ditsch Trading : Agricultural Trading Program  :  -7.40% [3.31]<br> Quantitative Investment Management : Global Program 3x  :  -15.77% [43.78]<br> >

    •  

    Webinar Invitation – Emerging Market Alpha

    On October 15th, at 10:30 EST I’m honored to be co-moderating this remarkable panel of EM experts. They include some of the most consistently performing hedge managers to be found across the entire hedge fund industry along with a leading global allocator who helps direct emerging market and impact investments.

    Together with the eminent Anna Niziol and Eric Uhlfelder, NilssonHedge is co-hosting the allocator panel. We would be honored to have you as a guest. 

    Some of the issues we’ll be exploring include:

    • Capturing Alpha Opportunities in Emerging Markets
    • Risk management
    • The Impact of the interest rate cycle
    • Boots on the ground
    • ESG issues
    • Ukraine, Lebanon, and China
    • Emerging Managers in a diversified Hedge Fund Portfolio?
    • Outlook

    This webinar sprung from Global Investment Report’s 21st annual global hedge fund survey, which was published a few months ago. It is the leading independent industry review of the most consistently performing managers. 

    Please reserve your spot, we have a limited number of seats and reservations will be allocated on a first-come, first-served basis: https://streamyard.com/watch/kqri8CR9yczR

    See you Tuesday!

    •  

    Flash Report September 2024

    Before we dig into the numbers, we would like to take the opportunity to invite you to an upcoming webinar focusing on Emerging Markets. It is taking place on the 15th of October, but feel free to reserve your spot now: https://streamyard.com/watch/kqri8CR9yczR. For anyone looking to learn more about opportunities in Emerging Markets, this is the webinar for you.

    The end of the quarter was generally a good month dominated by the FED’s decision to lower rates by 50bps and the ensuing unusually talkative governors that strongly walked back expectations that another 50bps should be expected for the post-election meeting. Across all the strategies that we monitor, most of them are positive for the year, while not all of them have managed to achieve the risk-free interest rate.

    Equity Long/Short Strategies are likely in the lead with a result of 9% ytd. Fixed Income managers are enjoying a strong trading climate.

    Our daily indices are pointing in the same direction for September: CTA: +1.8%, Equity Long Short 0.7%, Market Neutral: 0.5%, Event-Driven 0.2%, and Crypto Strategies +10%. A strong quarter for all strategies except CTAs and Crypto.

    It should be mentioned that Equity Market Neutral strategies have been on a strong run since the summer of last year. The strategy has continuously printed modestly positive numbers in a remarkable fashion.

    Please remember our webinar Unexpected Alpha: How select emerging market hedge funds have managed risk during times of monetary and geopolitical uncertainty.

    •  

    Best’n’Worst August 2024

    Before we dig into the numbers, NilssonHedge has a small favor to ask. Together with Eric Uhlfelder, we are fundraising for the 40th Annual MS Bike Ride. So, if you have an excellent year, please donate a small amount to those less fortunate.

    It is for a good cause: https://events.nationalmssociety.org/index.cfm?fuseaction=donordrive.participant&participantID=460903.

    Based on the most recent return data that we have available, we can provide a comprehensive overview of the top-performing and bottom-performing strategies for each category, taking into account both monthly and yearly results. Our analysis is based on proprietary composite data streams that we have compiled, but we must note that there is always the possibility of errors or inaccuracies in our calculations.

    CTA

    Black Tango : VIX Program  :  18.38% [0.03]<br> Schindler Capital Management : Dairy Advantage Program  :  13.73% [0.85]<br> Schindler Capital Management : Institutional Dairy Advantage  :  13.28% [2.36]<br> Moddco Capital Associates : MCA  :  12.48% [0.28]<br> Advanced Alpha Advisers : Art Short Term Systematic  :  12.47% [6.00]<br> Glenhaven Capital : Glenhaven Global II  :  -14.84% [4.31]<br> t24 Capital : Global Macro  :  -16.04% [1.00]<br> t24 Capital : TCM Global Index Fund  :  -16.04% [25.53]<br> Purple Valley Capital : Diversified Trend 1  :  -17.51% [6.70]<br> Mulvaney Capital Management : Global Diversified Program  :  -20.09% [203.00]<br> >
    Moddco Capital Associates : MCA  :  12.48% [0.28]<br> Mulvaney Capital Management : Global Diversified Program  :  -20.09% [203.00]<br> Alleman Capital Management : Alleman Capital Crude Hedge  :  7.62% [0.02]<br> Advanced Alpha Advisers : Art Short Term Systematic  :  12.47% [6.00]<br> The Tape Reader : Absolute Return Alpha  :  -2.41% [0.63]<br> SMN Investment Services : Structural Alpha Trend  :  -1.14% [75.02]<br> Swarm Technology : Swarm XVI  :  -8.37% [75.00]<br> QTS Capital Management : Tail Reaper  :  -6.09% [6.20]<br> Arion Investment Management : Arion Copper Arbitrage  :  -0.82% [7.50]<br> Vigo Capital : Fund  :  -0.68% [1.87]<br> >


    To explore the full list of CTAs and their rankings, including dynamic updates as new data becomes available, we invite you to visit our website at the Link provided.

    Market Neutral

    Cognios : Cognios Market Neutral Large Cap  :  4.34% [0.00]<br> Campbell & Company : Campbell Quantitative Equities Portfolio  :  3.80% [0.00]<br> RAM : Long Short Global  :  3.15% [14.27]<br> Gotham : Gotham Neutral  :  3.08% [0.00]<br> Federated Hermes : MDT Market Neutral  :  2.68% [0.00]<br> Fulcrum Asset Management : Thematic Equity Market  :  -0.89% [415.80]<br> MarshallWace : MW Tops  :  -1.27% [2062.40]<br> Seven Seas : Alpha Japan Neutral (Permal)  :  -2.02% [23.39]<br> BNP Theam : Quant Dispersion US  :  -2.49% [125.27]<br> PIMCO : PIMCO RAE Fundamental Advantage PLUS  :  -2.67% [0.00]<br> >
    Aphilion : Aphilion SIF  :  0.86% [40.63]<br> Gotham : Gotham Neutral  :  3.08% [0.00]<br> AQR Capital Management : Equity Market Neutral  :  0.56% [726.69]<br> MarshallWace : MW Market Neutral TOPS Fund A EUR  :  1.60% [0.00]<br> Campbell & Company : Campbell Quantitative Equities Portfolio  :  3.80% [0.00]<br> Sandbar : Global Equity Market Neutral (Lumyna)  :  -0.52% [67.99]<br> Pictet Asset Management : Agora  :  -0.19% [151.52]<br> Nanjia Capital Limited : Cyrus  :  0.00% [13.88]<br> LGT Capital Partners : LGT Sustainable Equity Market  :  1.05% [49.64]<br> Sector Asset Management : Munin Quant  :  1.05% [40.00]<br> >

    To explore our extensive list of Market Neutral funds and their dynamic rankings, we invite you to visit our website at the link provided here.

    Equity Long/Short

    FMG Malta : Impega  :  8.53% [0.00]<br> Rhenman & Partners Asset Management : Rhenman Healthcare Equity LS  :  5.27% [1014.00]<br> Renaissance Technologies : Equities Fund International  :  5.10% [19548.29]<br> Sherborne : Investors Guernsey  :  4.89% [0.00]<br> Forester : Forester Value  :  4.39% [0.00]<br> Veritas : China  :  -4.94% [16.21]<br> HELSINKI CAPITAL PARTNERS : HCP Quant  :  -5.68% [10.80]<br> Guggenheim : Guggenheim Long Short Equity  :  -5.76% [0.00]<br> Proxy P Management : Proxy Renewable LongShort Energy  :  -5.79% [38.00]<br> Adrigo Asset Management : Adrigo Small  & Midcap LS  :  -7.59% [34.20]<br> >
    Quantitative Investment Management : Tactical Fund  :  -2.12% [414.00]<br> FMG Malta : Impega  :  8.53% [0.00]<br> TIND Asset Management : TIND Discovery Fund  :  2.69% [0.00]<br> HELSINKI CAPITAL PARTNERS : HCP Focus Fund  :  0.55% [16.80]<br> CXC Investments : CXC Opportunities Fund  :  3.05% [1.88]<br> Veritas : China  :  -4.94% [16.21]<br> Sherborne : Investors Guernsey  :  4.89% [0.00]<br> Proxy P Management : Energy Transition  :  -2.51% [13.19]<br> Proxy P Management : Proxy Renewable LongShort Energy  :  -5.79% [38.00]<br> BNP : Environmental Absolute Return  :  2.98% [11.18]<br> >

    To explore our extensive Equity Long/Short list, with dynamic rankings, please see Link

    Event Driven

    PSAM : Global Event (Lumyna)  :  2.38% [231.65]<br> AllianceBernstein : Event Driven Portfolio  :  2.18% [159.00]<br> Formue Nord : Fokus  :  1.96% [73.20]<br> Bardin Hill : Arbitrage (Franklin K2)  :  1.59% [57.49]<br> TreeCap : Arbitrage Fund (Composite)  :  1.48% [0.00]<br> PrivilEdge : Amber Event Europe  :  -0.55% [145.80]<br> Hunting Hill Global Capital : Hunting Hill Equity Arbitrage  :  -1.22% [0.00]<br> Pictet Asset Management : Lotus  :  -1.34% [149.24]<br> Formue Nord : Formue Nord Markedsneutral AS  :  -1.72% [31.70]<br> CIAM : Satellite Event Driven  :  -2.71% [1.37]<br> >


    MY Alpha Management : Asian Event Driven  :  -0.18% [18.22]<br> Third Point : Third Point  :  0.46% [0.00]<br> PSAM : Global Event (Lumyna)  :  2.38% [231.65]<br> Gabelli : Merger Plus  :  0.00% [0.00]<br> RBC GAM : BlueBay Event Driven Credit Fund (EDCF)  :  0.95% [196.12]<br> Melqart Asset Management : Event Driven  :  -0.13% [121.83]<br> Alpine : Merger Arbitrage  :  0.82% [108.84]<br> CIAM : Satellite Event Driven  :  -2.71% [1.37]<br> Neuberger Berman : Distressed Debt Global Shares  :  0.00% [0.00]<br> Neuberger Berman : Distressed Debt Ordinary Shares  :  0.00% [0.00]<br> >

    To explore our extensive Event-Driven list, with dynamic rankings, please see Link

    Fixed Income

    Acheron Capital : Life Settlement Assets  :  8.00% [0.00]<br> EJF Investments : Event Driven  :  6.43% [0.00]<br> Excalibur Asset Management : Excalibur  :  5.03% [101.70]<br> GCP : Asset Backed Income  :  4.69% [0.00]<br> Numen : Credit (HI)  :  4.51% [84.07]<br> Selwood : Market Neutral Credit (ESG)  :  -0.74% [17.65]<br> Pareturn : Gladwyne Absolute Credit  :  -0.81% [30.94]<br> VPC : Specialty Lending Investments  :  -0.91% [0.00]<br> Vontobel Asset Management : Twenty Four Income Fund  :  -1.14% [0.00]<br> Skandinaviska Kreditfonden : Scandinavian Credit Fund I  :  -1.39% [388.90]<br> >
    GCP : Asset Backed Income  :  4.69% [0.00]<br> Blackstone : Loan Financing  :  1.07% [0.00]<br> Marble Point : Loan Financing  :  0.00% [0.00]<br> Chenavari : Toro Income Fund  :  3.12% [0.00]<br> CABA Capital : CABA Hedge  :  2.49% [163.20]<br> GAM International Management : Star Global Rates  :  2.63% [236.55]<br> GAM International Management : Star Emerging Market  :  0.15% [9.24]<br> Legg Mason : Western Asset Macro Opp  :  0.88% [796.07]<br> Skandinaviska Kreditfonden : Scandinavian Credit Fund I  :  -1.39% [388.90]<br> VPC : Specialty Lending Investments  :  -0.91% [0.00]<br> >

    To explore our extensive Fixed Income list, with dynamic rankings, please see Link

    Risk Premia

    SharpeMachine : Eagle Vision  :  5.49% [0.17]<br> Nordea Asset Management : Nordea 1  Alpha 15 MA Fund  :  4.05% [4388.40]<br> SharpeMachine : Eagle Vision Moderate Risk  :  2.84% [0.11]<br> Nordea Asset Management : Nordea 1  Alpha 10 MA Fund  :  2.70% [4590.00]<br> Nordea Asset Management : Nordea 1  Alpha 7 MA Fund  :  1.97% [562.80]<br> Oxeye Capital Management : Oxeye (BOPS) 5X  :  -3.94% [4.13]<br> BNP Theam : Absolute Alpha  :  -3.94% [14.28]<br> Atlantic House : Uncorrelated Strategies  :  -4.32% [335.79]<br> BNP Theam : Quant Cross Asset High Focus  :  -7.29% [712.63]<br> Catalyst Funds : Systematic Alpha  :  -9.41% [0.00]<br> >
    AQR Capital Management : Style Premia  :  -1.37% [342.88]<br> AQR Capital Management : Style Premia Alternative  :  -0.71% [1200.00]<br> AQR Capital Management : Alternative Risk Premia  :  -1.39% [0.00]<br> SharpeMachine : Eagle Vision  :  5.49% [0.17]<br> Blackrock : Style Advantage  :  -0.22% [124.88]<br> Oxeye Capital Management : Oxeye (BOPS) 5X  :  -3.94% [4.13]<br> Nordea Asset Management : Nordea 1  Alpha 15 MA Fund  :  4.05% [4388.40]<br> Future Value Capital : Equity Dispersion  :  -3.52% [7.59]<br> Atlantic House : Uncorrelated Strategies  :  -4.32% [335.79]<br> BNP Theam : Quant Cross Asset High Focus  :  -7.29% [712.63]<br> >

    To explore our extensive Risk Premia list, with dynamic rankings, please see Link

    Crypto

    Anna Asset Management : Anna Fund  :  22.76% [39.70]<br> Active Digital : Long Short  :  16.63% [20.00]<br> Lighthouse Collective Capital : Collective Capital Fund  :  9.72% [5.25]<br> North Rock Digital : NRD  :  9.29% [105.16]<br> ML Tech : Statistical Arbitrage TS3  :  4.82% [1.56]<br> Avenue Investments : Digital Investments FoF  :  -31.52% [0.00]<br> Jump Start : JUMPSTART  :  -31.62% [0.00]<br> TitaniumStrategy Titanium : JASMYSTRATEGY  :  -32.50% [0.00]<br> Roble Venture Capital : Roble Venture Capital  :  -35.34% [0.00]<br> Falenti Roman : FALENTI  :  -36.61% [0.00]<br> >
    Anna Asset Management : Anna Fund  :  22.76% [39.70]<br> PL Digital Management Pte : Presto Digital Fund  :  4.12% [21.19]<br> TitaniumStrategy Titanium : JASMYSTRATEGY  :  -32.50% [0.00]<br> PL Digital Management Pte : Presto Digital Fund 1  :  3.58% [6.24]<br> North Rock Digital : NRD  :  9.29% [105.16]<br> BitcoinTradingStrategy : BITCOINTRADINGSTRATEGY  :  -8.72% [0.00]<br> Algorithm Performance : ALGORITHMPERFORMANCE  :  -30.70% [0.00]<br> BigCoinMix : BCOINMIX  :  -29.39% [0.00]<br> Utopia Capital : UTOPIADEFI  :  -13.53% [0.00]<br> Arjuss : CRYPTOPAR  :  -28.37% [0.00]<br> >

    To explore our extensive Crypto Strategy list, with dynamic rankings, please see Link

    Past performance is not indicative of future results.

    •  

    What the mid-year update to the 2024 hedge survey revealed

    We are back with our semi-regular updates with Eric Uhlfelder and the Global Investment Report. The Q2 update can be found here.

    It may seem late to look back at the first half of the year. But it takes six weeks after a period closes to complete the tallying.  Only then can Global Investment Report start figuring out what its survey’s latest findings are saying. The mid-year update was completed on 21 August.

    Summary

    • Stocks killed it; hedge funds lagged far behind.
    • Big surprise: EM was the strongest performing strategy in the survey with one EM credit fund having outperformed the market.
    • Certain EM managers are thriving because of sovereign debt restructuring, resurgence of local currencies and bonds, strong equity markets, and declining Euro and US interest rates.
    • Multistrategy funds have been losing their shine because strategy assets have grown too large, investments have become increasingly correlated and too levered, and these funds are expensive.
    • Noise is driving uncertainty and volatility, but doesn’t appear to be materially affecting allocators’ exposure to hedge funds.
    • US elections: the outcome in November will affect markets. Below we objectively comp the candidates.
    Hi Eric, good to see you again. This has been a remarkable half-year. Given what has transpired over the last couple of months, I am already looking forward to your next update. What were some of the key takeaways from your midyear report?

    Hi Linus. Good to connect again.

    The main takeaway was no surprise: The Market Rules.

    Going back to the fourth quarter of 2023, the S&P 500 is up more than 27% through June. Don’t expect any alternative portfolio to keep pace, especially risk-centric hedge funds which make the survey. First-half market gains exceeded 15%. The average hedge fund added 5.4%; the Top 50 returned an average of 6.3%–which in absolute terms would be considered decent.

    Ten funds in the Top 50 delivered double-digit returns, including four equity funds that ranked among the top ten. Credit and fixed income funds did well with the 7 related funds having gained more than 7% followed by 11 equity funds which added 7%.

    But the continuing surprise was emerging market funds. It was the top-performing strategy, having returned more than 9.5%.  And the top-performing fund across the 50 was Sandglass Opportunities (ranked No. 33), an EM credit fund that beat the market having soared 18.4%.

    Why are Emerging Markets funds thriving and why are the ones in your selection doing particularly well?

    That’s a very good question, especially when you look at the recent performance of EM equity and bonds. Part of the answer is these six EM managers target idiosyncratic special-opportunity investments that aren’t particularly correlated to the market.

    Another reason: four credit focused funds have done exceedingly well, benefitting from sovereign debt restructuring, resurgence of local currencies and bonds, and declining Euro and US interest rates.

    Emerging Market Currencies have recovered strongly since 2023. https://www.investing.com/indices/msci-intl-em-currency

    With developed market interest rates having reversed course, they are no longer putting further strain on EM debt servicing of both local- and hard-currency bonds. And local currencies started rallying as the rate differentials between these currencies and the dollar, euro, sterling, and yen has eased.

    With help from the World Bank and IMF, a number of emerging market economies are turning things around and this is creating trading opportunities. And commodity-based economies are recovering after the interest rate shock of 2022-2023.

    Sandglass profited from distressed sovereign credit positions in Argentina, Ukraine, Egypt, and select African nations, along with corporate exposure mostly in Latin America.

    Enko African Debt (18) soared 15.3%, benefitting from rising local currencies and related debt prices, along with higher oil prices and debt restructuring.

    FengHe Asian (31) equities gained 11.3%, and WaHa EM Credit (37) was up 10.2%.

    The large Multistrategy funds remain in focus, both in terms of new launches but also a number of high profile names that have failed to gather sufficient assets. How has the segment held up?

    We’ve discussed concerns about the strategy getting too large, too correlated, too levered, and too expensive to hold up.  While it’s too early to make a definitive assessment, the octane appears to be draining out of the strategy.

    Ken Griffin, Citadel’s founder, has conceded the best days of multistrategy may be behind it. He’s concerned about, “the correlation of holdings between the firms,” and that funds could lose up to 20 percent of their equity if they simultaneously start to liquidate risk.  

    Using the Top 50 as a proxy (which include 10 such funds), the strategy’s first-half returns were 5.2%, matching the average hedge fund according to BarclayHedge. And the database’s average multistrategy return was less than 3% for the first 6 months of 2024. (Note: BH doesn’t track some of the largest stars, including Citadel Wellington and DE Shaw Composite, which are perennially strong performers in the Top 50.)

    Kenneth C. Griffin. (2024, September 7). In Wikipedia. https://en.wikipedia.org/wiki/Kenneth_C._Griffin

    Agecroft Partners, a third-party marketing firm, recently surveyed 2,500 institutional investors and found the likelihood of them adding capital to the strategy was down 8% compared to last year.  And in its midyear report, Goldman Sachs found only 15% of allocators are likely to increase exposure to the strategy.

    I see you challenge some conventional thinking in this update. What do you think analysts and pundits are getting wrong?

    First, it’s frustrating to hear folks refer to current interest rates as high. Maybe some don’t recall when we had high single-digit and low double-digit interest rates. A fed fund rate of 5% is average historically. And many professionals I’ve interviewed privately wish this level could stand because it provides investors an alternative to stocks and helps investors better assess risky investments.

    Two, I wish folks would stop taking about hard or soft landings. The economy never landed after the consecutive shocks of Covid, recession, inflation, and rising rates.

    Investors and economists should be looking at where we are now as a new phase of the economic cycle. Accordingly, it’s time to start measuring the economy from a new benchmark so that we’re not looking so much in the rearview mirror.

    At the same time, it’s ironic that folks are way too focused on the latest news, which blinds them from seeing the larger picture. Just last month the market went off the rails when the Bank of Japan pushed up rates a mere 15 bps (to an overnight rate of 25bps) and the currency rallied 5%. Carry trades unwound, hitting big name stocks whose purchases were funded by such carry trades. Then slowing US job growth (which happens when rates are pushed up) fueled recession fears.

    All this created chaos and a buying opportunity.

    Finally, financial pundits who think the US election won’t affect economies and markets are imagining that both are running on autopilot. That’s so only to a point. More about this below.

    I know you have access to a network of hedge fund allocators. How are they responding to the recent chaos?

    I wasn’t surprised to find allocators were not materially altering their holdings because of the recent volatility. They believe rates will decline to 3% and 4%, but not much lower given sustained government spending regardless of who wins in November. At the same time, they don’t publicly express concern about the outcome of the US elections.

    Additional prognostications they shared:

    • Distressed managers may thrive as we hit a massive debt refinancing wall.
    • Convertible arbitrage may be a good place as companies may increasingly turn to convertibles for affordable refinancing.
    • Market neutral may be a good hedge as conditions grow more uncertain.
    • Japan is growing increasingly attractive, given an equity market that’s less tracked and analyzed than other major financial centers with far lower investor participation.
    This is your last update before the us elections. Being closer to the action than I am, how are seeing things from your side of the Atlantic?
    the white house

    Given the wide gap between republican and democratic policies, I disagree with my colleagues who don’t think presidential leadership matters. Below is a summary of how each candidate might affect the domestic economy and market.

    Kamala Harris:

    • Surprising how aggressively she’s distancing herself from Biden’s policies, though they are a part of her legacy and associated with a strong economy and market. (Hard to have it both ways.)
    • This creates uncertainty about how she would lead, though most suspect she would maintain the status quo, which should be benign for the economy and markets.
    • Some of her initially stated economic policies appear to be populist and not particularly well thought out—perhaps just election fodder; perhaps not.
    • She would likely be fiscally aggressive which might keep interest rates from declining significantly lower; but it’s unclear how well she can attain her goals if dealing with a divided congress.
    • She’s aware climate change is real and is affecting economies. But it’s unclear how aggressively she’ll confront the risk, given her backtrack on fracking.

    Donald Trump:

    • His proposed across the-board-tariffs reaffirm his isolationist stance which will likely strain existing bilateral agreements and are probably not wise during a time of rising geopolitical tensions and slowing growth.
    • Federal spending is not likely to diminish under Trump and combined with his latest tax cut proposals (valued at $10.5 trillion) raises the same monetary concerns that a Harris administration does.
    • The former president would likely surround himself with an even more partisan team than he did during his first term, and this would likely test the presidency’s new-found powers unleashed by the recent US Supreme Court decision on executive immunity.
    • This would fuel his penchant for controversy and discord (over clarity and sustained policies) which would likely increase uncertainty and volatility–conditions that institutional investors aren’t supposed to like.
    • Trump dismisses climate change and would pursue policies that would raise climate-related risks.

    Thanks Eric, as usual, it has been a pleasure talking to you. I am looking forward to seeing you in a few months for the next update.

    Eric can be reached via his webpage – The Global Investment Report.

    •  

    Best’n’Worst July 2024

    Before we dig into the hitlist for July 2024 (August will have some rather remarkable surprises but we are not there yet)

    Together with Rebecca Meijlink, Paul Das, and Matthias Knab we would like to invite you to join us for an exclusive webinar tailored specifically for investment managers like yourself. This event promises to deliver actionable insights that can significantly impact your fund’s growth and operational efficiency.
     
    Date: Thursday, August 29th
    Time: 11:00 AM ET
    Link: https://www.opalesque.com/webinar/#uw1

    CTA

    QQFund.com : Alpha Beta Program  :  10.19% [11.15]<br> WG Wealth Guardian : Strategic Enhanced Sp500  :  5.55% [0.15]<br> Brent Trading Pty : Grain Seasonal Spread Program  :  5.12% [14.04]<br> GAIA Capital Management : GAIA Gold  :  5.04% [3.20]<br> Velocity Merchant : American Energy Fund  :  5.04% [69.64]<br> Takahe Capital : Global Quantitative Fund  :  -9.70% [4.31]<br> WG Wealth Guardian : QT Program  :  -9.98% [0.15]<br> Takahe Capital : Systematic Momentum Program  :  -11.10% [2.75]<br> Glenhaven Capital : Glenhaven Global II  :  -12.42% [4.98]<br> ESI : Macro LS  :  -18.87% [0.30]<br> >

    Mulvaney Capital Management : Global Diversified Program  :  -6.00% [265.00]<br> Moddco Capital Associates : MCA  :  4.62% [0.23]<br> t24 Capital : TCM Global Index Fund  :  -0.71% [25.53]<br> t24 Capital : Global Macro  :  -0.71% [25.00]<br> Everestia : Everestia Target Volatility Fund  :  -1.34% [1.37]<br> Takahe Capital : Systematic Momentum Program  :  -11.10% [2.75]<br> Opus Futures : Macro Monitor Program  :  -4.44% [9.81]<br> Arion Investment Management : Arion Copper Arbitrage  :  -0.45% [7.50]<br> ESI : Macro LS  :  -18.87% [0.30]<br> Vigo Capital : Fund  :  -0.54% [1.52]<br> >


    To explore the full list of CTAs and their rankings, including dynamic updates as new data becomes available, we invite you to visit our website at the Link provided.

    Market Neutral

    Campbell & Company : Campbell Quantitative Equities Portfolio  :  3.10% [0.00]<br> Pula Capital Managament : Pula Capital Fund  :  3.02% [16.00]<br> Aphilion : Aphilion SIF  :  2.33% [38.58]<br> Neo Ivy Capital Management : Neo Ivy  :  2.20% [0.00]<br> Desjardins Global Asset Management : Alt Long Short Global Equity Market ETF  :  2.16% [46.36]<br> Guggenheim : Guggenheim Market Neutral  :  -0.52% [0.00]<br> Victory : Victory Market Neutral Income  :  -0.76% [0.00]<br> AQR Capital Management : Equity Market Neutral  :  -0.89% [672.20]<br> PIMCO : PIMCO RAE Fundamental Advantage PLUS  :  -1.26% [0.00]<br> Candriam Investors Group : Absolute Return Equity Market Neutral  :  -1.59% [510.13]<br> >

    Aphilion : Aphilion SIF  :  2.33% [38.58]<br> AQR Capital Management : Equity Market Neutral  :  -0.89% [672.20]<br> Gotham : Gotham Neutral  :  1.06% [0.00]<br> Neo Ivy Capital Management : Neo Ivy  :  2.20% [0.00]<br> Campbell & Company : Campbell Quantitative Equities Portfolio  :  3.10% [0.00]<br> Pula Capital Managament : Pula Capital Fund  :  3.02% [16.00]<br> Guggenheim : Guggenheim Market Neutral  :  -0.52% [0.00]<br> Victory : Victory Market Neutral Income  :  -0.76% [0.00]<br> Pictet Asset Management : Agora  :  -0.38% [176.30]<br> Sector Asset Management : Munin Quant  :  0.52% [40.00]<br> >

    To explore our extensive list of Market Neutral funds and their dynamic rankings, we invite you to visit our website at the link provided here.


    Equity Long/Short

    Redwood Partners : Redwood  :  7.78% [11.00]<br> Dalton Investments : India Fund  :  6.75% [43.90]<br> HELSINKI CAPITAL PARTNERS : HCP Focus Fund  :  6.13% [16.80]<br> Counterpoint : Counterpoint Tactical Equity  :  5.25% [0.00]<br> RiverPark : RiverPark Long/Short Opportunity  :  5.00% [0.00]<br> Coeli Asset Management : Coeli Global Opportunities  :  -5.41% [0.00]<br> Adrigo Asset Management : Adrigo Small  & Midcap LS  :  -5.44% [39.20]<br> Coeli Asset Management : Coeli Renewable Opportunities  :  -5.64% [20.11]<br> Pensum Asset Management : Global Opportunities  :  -11.07% [14.80]<br> Proxy P Management : Proxy Renewable LongShort Energy  :  -15.80% [55.00]<br> >

    TIND Asset Management : TIND Discovery Fund  :  -4.50% [0.00]<br> HELSINKI CAPITAL PARTNERS : HCP Focus Fund  :  6.13% [16.80]<br> Accendo Capital : Accendo Capital  :  1.32% [162.00]<br> Counterpoint : Counterpoint Tactical Equity  :  5.25% [0.00]<br> AQR Capital Management : Sustainable Long-Short Eq  :  0.35% [0.00]<br> Nuance : Nuance Concentrated Value L-S  :  -3.68% [0.00]<br> Invenomic : Invenomic Institutional  :  -5.30% [0.00]<br> Cobia Capital : Long/Short  :  -0.62% [0.00]<br> Proxy P Management : Proxy Renewable LongShort Energy  :  -15.80% [55.00]<br> Sherborne : Investors Guernsey  :  -5.34% [0.00]<br> >

    To explore our extensive Equity Long/Short list, with dynamic rankings, please see Link

    Event Driven

    Gabelli : Mergers & Acquisitions  :  6.21% [0.00]<br> Driehaus : Event Driven  :  3.90% [0.00]<br> Alpine : Merger Arbitrage  :  3.86% [108.84]<br> Melqart Asset Management : Event Driven  :  3.71% [121.83]<br> Gamco : Merger Arbitrage  :  3.69% [371.47]<br> Candriam Investors Group : Risk Arbitrage Opportunities  :  -0.14% [39.02]<br> Pictet Asset Management : Lotus  :  -0.14% [149.24]<br> CIAM : Satellite Event Driven  :  -1.36% [1.37]<br> MY Alpha Management : Asian Event Driven  :  -1.43% [18.22]<br> Third Point : Third Point  :  -2.90% [0.00]<br> >


    MY Alpha Management : Asian Event Driven  :  -1.43% [18.22]<br> Third Point : Third Point  :  -2.90% [0.00]<br> Gabelli : Merger Plus  :  0.00% [0.00]<br> Formue Nord : Formue Nord Markedsneutral AS  :  3.12% [32.20]<br> PSAM : Global Event (Lumyna)  :  2.34% [231.65]<br> Hadron : Alpha Select  :  0.14% [10.02]<br> Alpine : Merger Arbitrage  :  3.86% [108.84]<br> CIAM : Satellite Event Driven  :  -1.36% [1.37]<br> Neuberger Berman : Distressed Debt Global Shares  :  0.00% [0.00]<br> Neuberger Berman : Distressed Debt Ordinary Shares  :  0.00% [0.00]<br> >

    To explore our extensive Event-Driven list, with dynamic rankings, please see Link

    Fixed Income


    GCP : Asset Backed Income  :  11.11% [0.00]<br> BioPharma : BioPharma Credit  :  10.07% [0.00]<br> Blackstone : Loan Financing  :  7.69% [0.00]<br> Axa IM : Volta Finance  :  5.81% [0.00]<br> Chenavari : Toro Income Fund  :  4.16% [0.00]<br> Ardea : Global Alpha  :  -0.05% [324.59]<br> Boussard Gavaudan : Convertible  :  -0.13% [39.83]<br> Tenac Asset Management : Global Fund  :  -0.76% [120.00]<br> Fair Oaks Capital : Income  :  -0.90% [0.00]<br> Skandinaviska Kreditfonden : Scandinavian Credit Fund I  :  -1.96% [388.90]<br> >

    Marble Point : Loan Financing  :  3.57% [0.00]<br> Blackstone : Loan Financing  :  7.69% [0.00]<br> GCP : Asset Backed Income  :  11.11% [0.00]<br> Chenavari : Toro Income Fund  :  4.16% [0.00]<br> CABA Capital : CABA Hedge  :  1.53% [155.70]<br> GAM International Management : Star Global Rates  :  0.47% [236.55]<br> Lazard : Emerging Markets Debt Blend  :  2.15% [0.00]<br> Legg Mason : Western Asset Macro Opp  :  3.32% [796.07]<br> Skandinaviska Kreditfonden : Scandinavian Credit Fund I  :  -1.96% [388.90]<br> VPC : Specialty Lending Investments  :  2.82% [0.00]<br> >

    To explore our extensive Fixed Income list, with dynamic rankings, please see Link

    Risk Premia

    Quadriga : Stable Return  :  5.15% [4.65]<br> Sharper Machine : Eagle Vision  :  4.38% [0.17]<br> Mount Lucas Management Corporation : AlphaCentric Symmetry Strategy  :  2.65% [0.00]<br> Lumyna : Merrill Lynch MCLX  :  2.45% [278.90]<br> Franklin K2 : Athena Risk  :  1.99% [83.97]<br> Man AHL : Alternative Style Premia  :  -1.20% [290.64]<br> Nomura : Fixed Income Risk Premia  :  -1.29% [1.65]<br> AQR Capital Management : Style Premia Alternative  :  -1.43% [1200.00]<br> Schroders : Isf Alternative Risk  :  -2.36% [379.46]<br> Allianz Global Investors : Multi Asset Risk Premia  :  -2.71% [54.35]<br> >

    AQR Capital Management : Style Premia  :  0.71% [342.88]<br> AQR Capital Management : Alternative Risk Premia  :  0.22% [0.00]<br> AQR Capital Management : Style Premia Alternative  :  -1.43% [1200.00]<br> Man AHL : Alternative Risk Premia  :  -0.76% [0.00]<br> Man AHL : Alternative Style Premia  :  -1.20% [290.64]<br> BNP Theam : Quant Cross Asset High Focus  :  1.33% [712.63]<br> Nordea Asset Management : Nordea 1  Alpha 7 MA Fund  :  0.41% [562.80]<br> Nordea Asset Management : Nordea 1  Alpha 10 MA Fund  :  0.43% [4590.00]<br> Nordea Asset Management : Nordea 1  Alpha 15 MA Fund  :  0.33% [4388.40]<br> Quadriga : Stable Return  :  5.15% [4.65]<br> >

    To explore our extensive Risk Premia list, with dynamic rankings, please see Link

    Crypto

    Future Index : FUTUREINDEX  :  25.64% [0.00]<br> Magnus Core : MAGNUSCORE  :  19.82% [0.00]<br> manestrat : MANESTRAT  :  17.89% [0.00]<br> SOLtrader DrCrypto : SOLTRADER  :  17.54% [0.00]<br> Salty& Sweet : SOLANASTRATEGY  :  17.38% [0.00]<br> CryptoIVPSI : CRYPTOIVPSI  :  -22.46% [0.00]<br> Future performance Index : FUTUREPERFORMANCEINDEX  :  -22.48% [0.00]<br> DiversityExclusion : THREEOTA  :  -23.27% [0.00]<br> Rocket one : MELCHORCRYPTOPORTFOLIO  :  -26.18% [0.00]<br> Principles Karlheinz Niebuhr Funk : PRINCIPLES  :  -27.75% [0.00]<br> >

    TitaniumStrategy Titanium : JASMYSTRATEGY  :  0.58% [0.00]<br> Anna Asset Management : Anna Fund  :  1.00% [32.30]<br> PL Digital Management Pte : Presto Digital Fund  :  0.17% [20.35]<br> napfton : NAPFTON  :  -3.76% [0.00]<br> PL Digital Management Pte : Presto Digital Fund 1  :  0.28% [5.04]<br> Asymmetry Active Performance : MAAX  :  -2.86% [0.00]<br> Hot altcoins Costl Wardrob : ALTCOINODYSSEY  :  -4.83% [0.00]<br> BitcoinTradingStrategy : BITCOINTRADINGSTRATEGY  :  -22.46% [0.00]<br> Arjuss : CRYPTOPAR  :  -11.35% [0.00]<br> Utopia Capital : UTOPIADEFI  :  -18.44% [0.00]<br> >

    To explore our extensive Crypto Strategy list, with dynamic rankings, please see Link

    Past performance is not indicative of future results.


    •  

    CTA – Did they really sell 130bn worth of equities?

    The start of August 2024 could have been a lot easier for systematic strategies (or most equity biased strategies) as equity markets took a deep dive on Monday, in combination with reversals in a lot of other popular trend trades.

    But before digging into the numbers, I would like to invite you to a webinar that will be useful if you are trying to market your strategy and getting your strategy in front of investors. If you are a fund manager this is the webinar to join. A replay will be available.

    Session 1: Thursday, August 22nd at 11 AM ET
    Don Steinbrugge: Maximizing results from cap intro and webinar events.
    Chris Addy: How not to fail at operational due diligence.
    Matthias Knab: Getting visibility for your firm & strategy in a crowded market.

    Session 2: Thursday, August 29th at 11 AM ET
    Rebecca Meijlink: Succeeding in cross-border and cross-culture asset raising.
    Paul Das: Institutionalizing your firm with painless IT systems and processes.
    Linus Nilsson: Database marketing & how to pass allocator screens.
    Click here to Register

    As our readers are aware, we are maintaining a set of Daily Performance barometers, one for broader based CTA, with a focus on trend-following strategies. Currently, this index is down 4%+ for the month, which is on par with the micro banking crisis that we saw in 2023.

    A great year has turned into a much more mediocre year for the strategy as we witnessed a large number of re-pricings, expectations changes for the US Presidential Election, sector rotations, and a modest hike from BOJ that may or may not have caused the Yen to strengthen. However, the backdrop is slightly different as the strategy has struggled since April to generate substantial returns. Here we also need to remember that Treasury Bills have generated 2-2.5% for any CTA that reports on a fund basis.

    We see other indices showing roughly the same numbers, with the SG Trend Index down a bit more than 6% and the more diversified SG CTA Index down 4.5%.

    If you started to trade mid-July and is flat ITD, and not using a (real) tail strategy, you are either very lucky or have found something that may provide some degree of protection. This does highlight that CTAs are also very unlikely to provide tail protection if they are long equities and short bonds into a market correction. This happened before and will happen again.

    With the exception of Long/Short Equity, other strategies held up well. Market Neutral made money and Event Driven strategies only saw a minor correction.

    Throughout the crash on Monday, market pundits called that CTA would be forced to sell 100bn+ worth of equity exposure, simply due to increased risk exposure. A Bloomberg article called for more than 170bn worth of equity Futures to be sold, post the correction.

    What is clear is that when volatility goes up, bet sizing usually gets smaller. For the ETFs that are tracking, this is yet to happen. They may not be using approaches that call for vol sizing (a hot debate) or they may use other types of risk management techniques, focusing on portfolio level volatility. Some reductions may already have been in risk parity funds, but those are likely only slowly being implemented.

    The big change, which may not get the same headlines is that Fixe Income has switched back to a long position. From this point onward, CTAs are likely to be somewhat more tail protective than before.

    Do not forget to join the webinar. NilssonHedge will do a minor presentation on how to ensure that allocators find you when they scan through their data sources.

    •  

    Top 5/Bottom 5 June 2024 / Webinar Invitation

    Before we start our regular programing, we would like to take a short moment and highlight an upcoming webinar. We have gathered an extraordinary group of allocators with interesting views and succinct takes on the current investment environment. Justin Young (MEMCO), Jim Neumann (Sussex Partners), and Cédric Dingens (NS Partners) will share their views on how to Optimize Hedge Fund Risk and Exposure.

    Together with the eminent Anna Niziol and Eric Uhlfelder, NilssonHedge is co-hosting the allocator panel. We would be honored to have you as a guest. Please join us at 10:30 AM EST on July the 30th. Limited availability, please reserve your slot by following this link: https://streamyard.com/watch/BpUY3JGUDNVW

    As a reoccurring feature we present the ‘best’ and ‘worst’ strategies on a MTD and YTD across categories.

    CTA

    Moddco Capital Associates : MCA  :  17.15% [0.22]<br> Trident Capital Management : Global Macro Enhanced 4  :  16.56% [71.47]<br> Robust Methods : Robust Methods LLC  :  15.02% [0.00]<br> Schindler Capital Management : Dairy Advantage Program  :  13.16% [2.24]<br> Trident Capital Management : Global Macro Enhanced 3  :  11.64% [71.47]<br> Hawk Cross Trading : Short-Term Futures Trading  :  -7.44% [0.90]<br> DUNN Capital Management : WMA  :  -7.47% [833.00]<br> Cayler Capital : Systematic Energy Diversified  :  -8.90% [51.50]<br> QDRA Pty : Commodity Strategy  :  -12.07% [1.00]<br> Arion Investment Management : Arion Copper Arbitrage  :  -24.82% [7.50]<br> >

    Mulvaney Capital Management : Global Diversified Program  :  6.31% [408.00]<br> Moddco Capital Associates : MCA  :  17.15% [0.22]<br> t24 Capital : Global Macro  :  10.73% [25.00]<br> The Tape Reader : Absolute Return Alpha  :  3.95% [0.64]<br> Trident Capital Management : Global Macro Enhanced 4  :  16.56% [71.47]<br> Haidar Capital Management : Jupiter Fund  :  -3.97% [1364.88]<br> QTS Capital Management : Tail Reaper  :  0.00% [7.20]<br> Opus Futures : Macro Monitor Program  :  -0.82% [10.35]<br> Takahe Capital : Systematic Momentum Program  :  -3.45% [2.10]<br> Arion Investment Management : Arion Copper Arbitrage  :  -24.82% [7.50]<br> >

    To explore the full list of CTAs and their rankings, including dynamic updates as new data becomes available, we invite you to visit our website at the Link provided.

    Market Neutral

    Aphilion : Aphilion SIF  :  4.01% [39.06]<br> Coban Capital : Equity Multi PM  :  3.89% [100.00]<br> AQR Capital Management : Equity Market Neutral  :  2.86% [583.62]<br> JPMorgan : JPMorgan Research Market Neutral  :  1.41% [0.00]<br> Gondor Capital : Gondor Partners Ltd  :  1.31% [11.00]<br> Campbell & Company : Campbell Quantitative Equities Portfolio  :  -0.30% [0.00]<br> Crossmark Steward : Equity MN Instl  :  -0.88% [0.00]<br> Exane : Overdrive  :  -1.24% [96.44]<br> Vanguard : Vanguard Market Neutral  :  -1.70% [0.00]<br> Pula Capital Managament : Pula Capital Fund  :  -1.98% [15.40]<br> >

    Aphilion : Aphilion SIF  :  4.01% [39.06]<br> Coban Capital : Equity Multi PM  :  3.89% [100.00]<br> AQR Capital Management : Equity Market Neutral  :  2.86% [583.62]<br> Neo Ivy Capital Management : Neo Ivy  :  0.61% [0.00]<br> Gotham : Gotham Neutral  :  0.07% [0.00]<br> Victory : Victory Market Neutral Income  :  0.73% [0.00]<br> Pictet Asset Management : Agora  :  -0.03% [176.30]<br> PIMCO : PIMCO RAE Fundamental Advantage PLUS  :  0.12% [0.00]<br> Sector Asset Management : Munin Quant  :  0.83% [40.00]<br> >

    To explore our extensive list of Market Neutral funds and their dynamic rankings, we invite you to visit our website at the link provided here.

    Equity Long/Short

    Accendo Capital : Accendo Capital  :  16.50% [159.60]<br> Proxy P Management : Proxy Renewable LongShort Energy  :  11.51% [55.00]<br> Adrigo Asset Management : Adrigo Small  & Midcap LS  :  10.87% [36.20]<br> Alcur : Alcur Select  :  9.08% [421.10]<br> HELSINKI CAPITAL PARTNERS : HCP Quant  :  8.70% [12.00]<br> Coeli Asset Management : Coeli Global Opportunities  :  -5.41% [0.00]<br> Adrigo Asset Management : Adrigo Small  & Midcap LS  :  -5.44% [39.20]<br> Coeli Asset Management : Coeli Renewable Opportunities  :  -5.64% [0.00]<br> Pensum Asset Management : Global Opportunities  :  -11.07% [14.80]<br> Proxy P Management : Proxy Renewable LongShort Energy  :  -15.80% [0.00]<br> >

    HELSINKI CAPITAL PARTNERS : HCP Focus Fund  :  6.13% [16.80]<br> Counterpoint : Counterpoint Tactical Equity  :  5.25% [0.00]<br> AQR Capital Management : Sustainable Long-Short Eq  :  0.35% [0.00]<br> TIND Asset Management : TIND Discovery Fund  :  -4.50% [0.00]<br> FMG Malta : Impega  :  2.50% [0.00]<br> Nuance : Nuance Concentrated Value L-S  :  -3.68% [0.00]<br> Cobia Capital : Long/Short  :  -0.62% [0.00]<br> Invenomic : Invenomic Institutional  :  -5.30% [0.00]<br> Proxy P Management : Proxy Renewable LongShort Energy  :  -15.80% [0.00]<br> Sherborne : Investors Guernsey  :  -5.34% [0.00]<br> >

    To explore our extensive Equity Long/Short list, with dynamic rankings, please see Link

    Event Driven

    Formue Nord : Fokus  :  2.42% [70.60]<br> Man GLG : GLG Event Driven  :  1.22% [743.55]<br> RBC GAM : BlueBay Event Driven Credit Fund (EDCF)  :  0.95% [196.12]<br> Carmignac Gestion : Merger Arbitrage Plus  :  0.71% [145.08]<br> Water Island : Water Island Diversified Event-Driven  :  0.70% [0.00]<br> Hunting Hill Global Capital : Hunting Hill Equity Arbitrage  :  -1.79% [0.00]<br> Portland Hill Capital : Portland Hill Fund SICAV ESG Catalyst Driven Strategy  :  -1.96% [47.82]<br> Gabelli : Mergers & Acquisitions  :  -2.30% [0.00]<br> Neuberger Berman : Distressed Debt Global Shares  :  -3.33% [0.00]<br> Neuberger Berman : Distressed Debt Extended Life Shares  :  -3.57% [0.00]<br> >

    Third Point : Third Point  :  0.67% [0.00]<br> Gabelli : Merger Plus  :  0.00% [0.00]<br> Gabelli : Merger Arb  :  0.00% [0.00]<br> RBC GAM : BlueBay Event Driven Credit Fund (EDCF)  :  0.95% [196.12]<br> Formue Nord : Formue Nord Markedsneutral AS  :  0.39% [31.40]<br> Water Island : Water Island Diversified Event-Driven  :  0.70% [0.00]<br> Driehaus : Event Driven  :  0.00% [0.00]<br> Gamco : Merger Arbitrage  :  -0.72% [0.00]<br> Neuberger Berman : Distressed Debt Global Shares  :  -3.33% [0.00]<br> Neuberger Berman : Distressed Debt Ordinary Shares  :  0.00% [0.00]<br> >

    To explore our extensive Event-Driven list, with dynamic rankings, please see Link

    Fixed Income

    Blackstone : Loan Financing  :  8.30% [0.00]<br> HP Fondsmaglerselskab : HP Hedge Danish Bonds  :  3.99% [41.50]<br> Nordkinn Asset Management : Nordkinn Fixed Income Macro Fund  :  2.17% [476.30]<br> Enko Capital Management : Africa Debt Fund  :  1.88% [675.10]<br> Fisch Asset Management : Absolute Return Global  :  1.75% [0.00]<br> Chenavari : Toro Income Fund  :  -3.07% [0.00]<br> VPC : Specialty Lending Investments  :  -3.36% [0.00]<br> Fair Oaks Capital : Income  :  -3.47% [0.00]<br> Nordea Asset Management : European Rates Opportunity  :  -4.52% [369.60]<br> EJF Investments : Event Driven  :  -4.95% [0.00]<br> >

    Marble Point : Loan Financing  :  0.00% [0.00]<br> Blackstone : Loan Financing  :  8.30% [0.00]<br> Chenavari : Toro Income Fund  :  -3.07% [0.00]<br> GCP : Asset Backed Income  :  0.39% [0.00]<br> Enko Capital Management : Africa Debt Fund  :  1.88% [675.10]<br> Fisch Asset Management : Convertible Global Sustainable  :  -0.31% [0.00]<br> Excalibur Asset Management : Excalibur  :  -0.16% [95.70]<br> Lazard : Emerging Markets Debt Blend  :  -1.35% [0.00]<br> Skandinaviska Kreditfonden : Scandinavian Credit Fund I  :  -0.09% [388.90]<br> VPC : Specialty Lending Investments  :  -3.36% [0.00]<br> >

    To explore our extensive Fixed Income list, with dynamic rankings, please see Link

    Risk Premia

    Allspring : Alternative Risk  :  1.97% [0.00]<br> Catalyst Funds : Systematic Alpha  :  1.19% [0.00]<br> Credit Suisse Multialternative : Credit Suisse Multialternative  :  0.92% [0.00]<br> Danske Bank Asset Management : Global Alternative Opportunities  :  0.69% [462.00]<br> Trium Capital : Alternative Growth Fund  :  0.67% [126.27]<br> Sharper Machine : Eagle Vision Moderate Risk  :  -1.32% [0.10]<br> Sharper Machine : Eagle Vision  :  -1.36% [0.16]<br> AQR Capital Management : Style Premia Alternative  :  -1.64% [1220.00]<br> AQR Capital Management : Alternative Risk Premia  :  -2.49% [0.00]<br> LGT Capital Partners : LGT Risk Premia  :  -4.38% [628.90]<br> >

    AQR Capital Management : Style Premia Alternative  :  -1.64% [1220.00]<br> AQR Capital Management : Alternative Risk Premia  :  -2.49% [0.00]<br> Man AHL : Alternative Risk Premia  :  0.44% [0.00]<br> Catalyst Funds : Systematic Alpha  :  1.19% [0.00]<br> Allspring : Alternative Risk  :  1.97% [0.00]<br> Sharper Machine : Eagle Vision Moderate Risk  :  -1.32% [0.10]<br> Nordea Asset Management : Nordea 1  Alpha 7 MA Fund  :  0.43% [562.80]<br> Nordea Asset Management : Nordea 1  Alpha 10 MA Fund  :  0.29% [4590.00]<br> Nordea Asset Management : Nordea 1  Alpha 15 MA Fund  :  0.22% [4388.40]<br> >

    To explore our extensive Risk Premia list, with dynamic rankings, please see Link

    Crypto

    Coincident Capital : Coincident  :  14.96% [282.00]<br> Anna Asset Management : Anna Fund  :  10.84% [32.00]<br> North Rock Digital : NRD  :  10.33% [92.29]<br> PL Digital Management Pte : Presto Digital Fund  :  5.39% [20.31]<br> Active Digital : Long Short  :  5.03% [0.00]<br> Crypto Ai Crypto Echein : CRYPTOAI  :  -37.26% [0.00]<br> BitcoinTradingStrategy : BITCOINTRADINGSTRATEGY  :  -38.40% [0.00]<br> CryptoIVPSI : CRYPTOIVPSI  :  -38.40% [0.00]<br> WhiteBot Crypto : WHITEBOTCRYPTO  :  -38.83% [0.00]<br> Vortex Pulse Mitja : VORTEXPULSE Mitja  :  -44.31% [0.00]<br> >

    TitaniumStrategy Titanium : JASMYSTRATEGY  :  -24.24% [0.00]<br> Anna Asset Management : Anna Fund  :  10.84% [32.00]<br> PL Digital Management Pte : Presto Digital Fund  :  5.39% [20.31]<br> napfton : NAPFTON  :  -25.22% [0.00]<br> Jump Start : JUMPSTART  :  -19.27% [0.00]<br> Hot altcoins Costl Wardrob : ALTCOINODYSSEY  :  -26.07% [0.00]<br> manestrat : MANESTRAT  :  -23.56% [0.00]<br> Utopia Capital : UTOPIADEFI  :  -33.69% [0.00]<br> Arjuss : CRYPTOPAR  :  -29.69% [0.00]<br> MyStrategy : MYSTRATEGY  :  -26.48% [0.00]<br> >

    To explore our extensive Crypto Strategy list, with dynamic rankings, please see Link

    Past performance is not indicative of future results.

    •  

    2024 Top 50 Hedge Fund Survey – Global Investment Report

    I had the opportunity to sit down with Eric Uhlfelder, the discuss his latest edition of the Global Investment Report, to discuss his 2024 survey of the Top 50 Hedge Funds. We discuss the most impressive performing managers over the trailing five-year period through 2023 and discuss some of the potential opportunities a nd pitfalls for the remainder of 2024.

    Managers that made the list collectively delivered superior risk-adjusted returns compared to the S&P 500, with a Sharpe ratio that was nearly twice that of the market. Eric provided detailed color on several managers, highlighting those that are new to the list and why certain well-known managers fell off the survey.

    Hope you enjoy our discussion!

    FEATURED WEBINAR: Anna Niziol, former chief marketing officer and head of product development at Rothschild & Co, joined Eric and I as moderators of our recent July 30th hedge fund allocator webinar that addressed navigating turbulence during a time of monetary, geopolitical and market uncertainty. To watch, please click and sign in:
    https://streamyard.com/watch/BpUY3JGUDNVW

    What were the most important takeaways from this year’s survey?

    While the market outperformed the Top 50 by 2 percentage points over the trailing five years, the 50 generated vastly superior risk-adjusted returns. Its Sharpe ratio was 1.43 vs 0.75 for the S&P 500 TR.  The average hedge fund Sharpe was just 0.53.  And the 50 accomplished this with modest correlation to the market of 0.31 over the past 5 years. I think this is the kind of performance investors seek from alternative investments.  And preliminary results suggest this group of funds have continued to thrive during the first half of 2024, but well behind the market.

    The three top-performing strategies were equity, macro, and multistrategy, which represented more than half the Top 50.

    The average fund age, 15.2 years, was the highest ever registered since I adopted the current format in 2019 for The Wall Street Journal. While the notion of survivor bias has a negative connotation, I reverse this notion by seeing sustainable investment processes that have enabled many managers to thrive for quite some time.

    And this was most clearly manifested by the fund that took the top spot in this year’s survey. Roots of Peconic Grenadier (ranked No.1) date back to 1986.

    The biggest surprise from this year’s survey was inclusion of six emerging market funds—the most that have ever made the Top 50. Four are credit funds, two of which are profiled in the survey. A common thread: these managers have figured out a way to de-risk exposure in the world’s most volatile asset class.

    The survey has always included a number of big-name funds, such as Citadel, DE Shaw, and Millennium. Now I see Greenlight Capital, AQR, Point72, Marshall Wace and GoldenTree.

    Why did these large funds suddenly make the cut?

    That’s simple. They previously hadn’t qualified because their performance in 2018 lagged. That was a tough year for many managers, and this year’s survey was the first time that the trailing 5-year performance period (which is a key determinant of ranking) no longer included 2018.  I apply hurdles, as Warren Buffett famously put it, to see who’s swimming with trunks as the tide went out.

    I also see an even longer list of familiar names having lost their place in the survey, including Schonfeld, Tudor, John Street, Haidar-Jupiter, and Segantii. 

    What happened?

    That’s also simple: they all failed to meet the 2023 hurdle rate of 5.75%.

    Doing so doesn’t mean a fund has suddenly lost its appeal.  A manager can have an off year.  But to make this survey reflective of the most consistently performing funds, I need each constituent fund to sustain a minimum level of absolute performance regardless of what the market is doing.

    That said, the two Schonfeld funds that got knocked off the list (Fundamental Equity and Strategic Partners) have already generated double-digit returns so far this year through June.

    But I’ve found that significant underperformance can reveal underlying problems. This was most evident with Haidar Jupiter. Even when it claimed the top spot last year, the high-octane manner in which Said Haidar had been managing the fund involved significant risk taking. He lost a lot of money in the fourth quarter of 2022 and then got clobbered in 2023.

    Segantii Asia-Pacific Equity Multistrategy told a different kind of story.

    The fund has always been a consistent performer. But I became concerned by its rapid asset growth which can make it harder to sustain returns. AUM had doubled between 2018 through 2021, when that number exceeded $6 billion.  I don’t know if that may have been behind the Singaporean regulators claim of insider trading.  Until proven in court, we don’t even know if the charges are even true. But what we do know is that these accusations led key service providers to reduce support for the fund, and that the fund has since decided to shut down after nearly 18 years in business.

    Between the new additions and the loss of well-established names, your Top 50 sounds like it’s more dynamic and maybe less consistent group than usual?

    Many of the previous Top 50 funds did well last year. That percent didn’t change. But a few didn’t retain their rankings because the minimum 5-year annualized return threshold increased by two full percentage points. Normally two-thirds of the funds qualify for the following year. That percent declined this year to about one half because of an influx of funds that now qualified for inclusion. Some were well-established funds that were no longer held back by their performance in 2018; others were funds whose data was only made known to me this year.

    Does it surprise that EM funds represent more than 10% of the Top 50? How do you explain their consistent performance?

    Yes, and I was especially surprised how many were in the credit space.  With the Fed having sent interest rates soaring across 2022 and into 2023, I thought such volatility would cause all sorts of problems across emerging markets. In Africa, we witnessed local currencies crash. But the African Debt Fund not only eked out a profit in 2022, it thrived in 2023. The reason: it controlled risk and exploited financing opportunities that resulted from shifting interest and exchange rates.  A number of EM credit funds that have much broader geographic exposure were able to achieve the same results through different means, including relative value and directional trades.

    Well-known multi-billion-dollar managers normally don’t give interviews? How did you get Jason Mudrick (Mudrick Distressed) to agree to a profile?

    Good question. I can’t answer the question directly. So I’ll guess.

    First, I’m honored that Jason granted the interview. His fund has been around for more than 14 years, and he’s a highly regarded manager.  He said he has given only one interview and that was soon after the fund launched.

    Jason’s fund has made the survey over the past six years since I started the current ranking process.  That means he has delivered hurdle-beating returns for a full decade.

    I’ve known Jason for years. He has always been reticent to speak about his fund. I didn’t ask him why this year he decided to open up.  Maybe he appreciated my reporting approach that’s focused on objective long-term performance review rather than near-term hype which is the fodder that often gets published.

    He had a rough start to this year, in large part due to an acquirer of one of the fund’s significant positions who decided not to honor the warrants with which Mudrick had been compensated. I’m guessing that loss was written down. The issue is currently being litigated.  I don’t imagine for a second that he needed a profile to counter this event. He has done just fine without coverage, and his fund has since rallied. 

    Do you think your segment of the industry is well poised for the rest of the year?

    Yes, and toward the end of this year’s survey, I concluded that despite a myriad of risks, including richly-valued stocks, market strategist capitulation claiming stocks are poised to continue their run (which always makes me nervous when there’s such broad consensus), and a slew of geopolitical risks that appear to be getting worse, including two wars and the specter of Trump returning to 1600 Pennsylvania Avenue), I wrote the second half of 2024 appeared safe for risk assets.

    With inflation steadily declining close to target levels, the Fed may be ready to start cutting rates as soon as September. Frankly, I like having 5% interest rates. It’s a real risk premium that forces investors to be more critical about investments. If the Fed starts to cut rates, then fixed-income will certainly be an even more desirable place to be. And stocks may benefit so long as there’s not a material slowdown in growth.

    It’s too early to report on the performance of the Top 50 through June. But with about half the funds reporting, the average return is about 6.5%. That’s slightly more than a full percentage point better than the BarclayHedge Hedge Fund Index is reporting so far with returns of about 1,900 funds.

    BarclayHedge reports emerging market global equities as the second best performing broad strategy during the first half of 2024, up 8.8%, followed by equity market neutral, which had appreciated by 7.4%. No surprise that equity long bias led the way, rising 9.6%.

    What are other sources indicating?

    Economist Ed Yardeni sees stability of second quarter S&P 500 earnings estimates as a positive surprise.  He reports that there’s a typical decline of about 4% from the beginning of a quarter through the end of quarter before companies start reporting.

    Caron Bastianpillai, who helps allocate capital into hedge funds at Swiss-based NS Partners, describes 2024 as “a good vintage for hedge funds overall across all hedge fund strategies, except for risk arbitrage and macro relative value.”

    And Bloomberg recently reported that, “The biggest hedge funds are off to one of their best starts to a year, aided by stocks and quantitative investing.”

    Large funds in the Top 50 are generally doing well.  Citadel Wellington, Point72, Greenlight Capital, and Millennium, D.E. Shaw Composite are up an average of 7.7.  And bucking the troubles many macro managers are having, DE Shaw Oculus and AQR Helix have registered double-digit gains.

    Could something throw water on the party? 

    Absolutely. There are two hot wars going on that could morph into larger conflicts affecting commodities and supply chains. The US election circus is hard to handicap and will bring greater uncertainty if Trump is re-elected—something for which markets are not prepared.

    But most investors appear to be excessively focused on interest rates. They’ve already started heading lower in Europe, and if the Fed follows than that may be the clearest indicator for what lays ahead short term for markets and hedge fund managers.

    Thanks Eric, it’s been a pleasure. I’m looking forward to the upcoming webinar. Eric’s report can be found here.

    •  

    Top 5 / Worst 5 – May 24

    With close to 75% of the monthly data point collected for May, we are proud to present the winner and losers. There are some really interesting and perhaps unexpecting names in there. Among the managers, we note a relative to a famous American Lebanese bird observer that is having a well deserved comeback.

    Due to extensive work load, NilssonHedge has provided fewer than normal updates in the recent few weeks. That said, the database continues to be updated on a weekly basis and all customers and users have access to timely and accurate fund data. Due to a physical move next weekend, we will temporarily pause our daily indices for a few days. Please feel free to reach out to info@nilssonhedge.com for further details.

    CTA

    Moddco Capital Associates : MCA  :  17.15% [0.22]<br> Trident Capital Management : Global Macro Enhanced 4  :  16.56% [71.47]<br> Robust Methods : Robust Methods LLC  :  15.02% [0.00]<br> Schindler Capital Management : Dairy Advantage Program  :  13.16% [2.24]<br> Trident Capital Management : Global Macro Enhanced 3  :  11.64% [71.47]<br> Auspice Capital Advisors : Short Term (AST)  :  -7.27% [6.17]<br> Hawk Cross Trading : Short-Term Futures Trading  :  -7.44% [0.90]<br> DUNN Capital Management : WMA  :  -7.47% [833.00]<br> Cayler Capital : Systematic Energy Diversified  :  -8.90% [51.50]<br> QDRA Pty : Commodity Strategy  :  -12.07% [1.00]<br> >

    Mulvaney Capital Management : Global Diversified Program  :  6.31% [408.00]<br> t24 Capital : Global Macro  :  10.73% [25.00]<br> Moddco Capital Associates : MCA  :  17.15% [0.22]<br> Transtrend BV : Tulip Trend Fund  :  -4.31% [148.19]<br> Trident Capital Management : Global Macro Enhanced 4  :  16.56% [71.47]<br> Spartan Asset Group : Super Senior Program  :  -4.38% [0.17]<br> Black Tango : VIX Program  :  -2.29% [0.13]<br> Haidar Capital Management : Jupiter Fund  :  -3.97% [1364.88]<br> Opus Futures : Macro Monitor Program  :  -0.82% [10.35]<br> QTS Capital Management : Tail Reaper  :  0.00% [7.20]<br> >


    To explore the full list of CTAs and their rankings, including dynamic updates as new data becomes available, we invite you to visit our website at the Link provided.

    Market Neutral

    Aphilion : Aphilion SIF  :  4.01% [39.06]<br> Coban Capital : Equity Multi PM  :  3.89% [100.00]<br> AQR Capital Management : Equity Market Neutral  :  2.86% [583.62]<br> JPMorgan : JPMorgan Research Market Neutral  :  1.41% [0.00]<br> Gondor Capital : Gondor Partners Ltd  :  1.31% [11.00]<br> Campbell & Company : Campbell Quantitative Equities Portfolio  :  -0.30% [0.00]<br> Crossmark Steward : Equity MN Instl  :  -0.88% [0.00]<br> Exane : Overdrive  :  -1.24% [96.44]<br> Vanguard : Vanguard Market Neutral  :  -1.70% [0.00]<br> Pula Capital Managament : Pula Capital Fund  :  -1.98% [15.40]<br> >

    Aphilion : Aphilion SIF  :  4.01% [39.06]<br> AQR Capital Management : Equity Market Neutral  :  2.86% [583.62]<br> Coban Capital : Equity Multi PM  :  3.89% [100.00]<br> Neo Ivy Capital Management : Neo Ivy  :  0.61% [0.00]<br> Gotham : Gotham Neutral  :  0.07% [0.00]<br> PIMCO : PIMCO RAE Fundamental Advantage PLUS  :  0.12% [0.00]<br> ABCA Asset Management : ABCA Opportunities  :  -0.24% [70.50]<br> Pictet Asset Management : Agora  :  -0.03% [176.30]<br> Victory : Victory Market Neutral Income  :  0.23% [0.00]<br> Sector Asset Management : Munin Quant  :  0.83% [40.00]<br> >

    To explore our extensive list of Market Neutral funds and their dynamic rankings, we invite you to visit our website at the link provided here.


    Equity Long/Short

    Accendo Capital : Accendo Capital  :  16.50% [159.60]<br> Proxy P Management : Proxy Renewable LongShort Energy  :  11.51% [55.00]<br> Adrigo Asset Management : Adrigo Small  & Midcap LS  :  10.87% [36.20]<br> Alcur : Alcur Select  :  9.08% [421.10]<br> HELSINKI CAPITAL PARTNERS : HCP Quant  :  8.70% [12.00]<br> Polar Asset Management Partners : Polar Micro Cap Fund  :  -2.67% [0.00]<br> Hussman : Hussman Strategic Growth  :  -3.14% [0.00]<br> Odey : Absolute Return Focus Fund  :  -3.90% [117.19]<br> ARR Investment Partners : Global LS Strategy  :  -4.96% [27.00]<br> Redwood Partners : Redwood  :  -9.35% [10.10]<br> >

    TIND Asset Management : TIND Discovery Fund  :  5.13% [0.00]<br> Alcur : Alcur Select  :  9.08% [421.10]<br> AQR Capital Management : Sustainable Long-Short Eq  :  4.50% [0.00]<br> Adrigo Asset Management : Adrigo Small  & Midcap LS  :  10.87% [36.20]<br> HELSINKI CAPITAL PARTNERS : HCP Focus Fund  :  6.41% [15.60]<br> Greenwich Ivy : Global Tactical Fund  :  0.00% [0.00]<br> Redwood Partners : Redwood  :  -9.35% [10.10]<br> Nuance : Nuance Concentrated Value L-S  :  0.84% [0.00]<br> Invenomic : Invenomic Institutional  :  -1.16% [0.00]<br> Sherborne : Investors Guernsey  :  -2.27% [0.00]<br> >

    To explore our extensive Equity Long/Short list, with dynamic rankings, please see Link

    Event Driven

    MY Alpha Management : Asian Event Driven  :  5.72% [22.74]<br> Neuberger Berman : Distressed Debt Extended Life Shares  :  5.66% [0.00]<br> Hunting Hill Global Capital : Hunting Hill Equity Arbitrage  :  4.23% [0.00]<br> Formue Nord : Formue Nord Markedsneutral AS  :  3.43% [33.80]<br> Gabelli : Mergers & Acquisitions  :  2.73% [0.00]<br> Driehaus : Event Driven  :  -0.32% [0.00]<br> Formue Nord : Fokus  :  -0.36% [68.90]<br> Third Point : Third Point  :  -0.44% [0.00]<br> Weiss Alternative : Monthly Distribution (Dunham)  :  -0.49% [0.00]<br> Neuberger Berman : Distressed Debt Global Shares  :  -3.22% [0.00]<br> >


    MY Alpha Management : Asian Event Driven  :  5.72% [22.74]<br> Third Point : Third Point  :  -0.44% [0.00]<br> Gabelli : Merger Arb  :  0.00% [0.00]<br> Hunting Hill Global Capital : Hunting Hill Equity Arbitrage  :  4.23% [0.00]<br> Neuberger Berman : Distressed Debt Extended Life Shares  :  5.66% [0.00]<br> Gamco : Merger Arbitrage  :  0.01% [460.48]<br> Water Island : Water Island Diversified Event-Driven  :  0.35% [0.00]<br> Weiss Alternative : Monthly Distribution (Dunham)  :  -0.49% [0.00]<br> Neuberger Berman : Distressed Debt Global Shares  :  -3.22% [0.00]<br> Neuberger Berman : Distressed Debt Ordinary Shares  :  0.00% [0.00]<br> >

    To explore our extensive Event-Driven list, with dynamic rankings, please see Link

    Fixed Income


    GCP : Asset Backed Income  :  9.53% [0.00]<br> Blackstone : Loan Financing  :  8.97% [0.00]<br> EJF Investments : Event Driven  :  8.56% [0.00]<br> CABA Capital : CABA Hedge  :  5.24% [153.80]<br> Nykredit Asset Management : Nykredit EVIRA Hedge Fund  :  4.44% [25.80]<br> CQS : New City High Yield Fund  :  -1.49% [0.00]<br> Tenac Asset Management : Global Fund  :  -2.48% [0.00]<br> Skandinaviska Kreditfonden : Scandinavian Credit Fund I  :  -3.50% [388.90]<br> BioPharma : BioPharma Credit  :  -4.78% [0.00]<br> VPC : Specialty Lending Investments  :  -9.09% [0.00]<br> >

    Marble Point : Loan Financing  :  3.27% [0.00]<br> GCP : Asset Backed Income  :  9.53% [0.00]<br> CABA Capital : CABA Hedge  :  5.24% [153.80]<br> Nordea Asset Management : European Rates Opportunity  :  0.89% [369.60]<br> Moma Advisors : Asgard Fixed Income Fund  :  3.42% [1244.40]<br> Formuepleje Fund Management : Formuepleje Fokus  :  0.86% [147.40]<br> Fisch Asset Management : Absolute Return Global  :  0.57% [0.00]<br> Lazard : Emerging Markets Debt Blend  :  1.51% [0.00]<br> Skandinaviska Kreditfonden : Scandinavian Credit Fund I  :  -3.50% [388.90]<br> VPC : Specialty Lending Investments  :  -9.09% [0.00]<br> >

    To explore our extensive Fixed Income list, with dynamic rankings, please see Link

    Risk Premia

    Sharper Machine : Eagle Vision  :  2.73% [0.16]<br> AQR Capital Management : Style Premia Alternative  :  2.42% [1200.00]<br> Sharper Machine : Eagle Vision Moderate Risk  :  2.01% [0.20]<br> 7orca Asset Managment AG : 7orca Vega Return I  :  1.95% [0.00]<br> HSBC : GIF Multi-asset style factors  :  1.79% [251.29]<br> LGT Capital Partners : LGT Risk Premia  :  -2.03% [682.61]<br> Nordea Asset Management : Nordea 1  Alpha 7 MA Fund  :  -2.14% [562.80]<br> NN Investment Partners : Multi Asset Factor Opportunities  :  -2.27% [325.09]<br> Nordea Asset Management : Nordea 1  Alpha 10 MA Fund  :  -2.99% [4590.00]<br> Nordea Asset Management : Nordea 1  Alpha 15 MA Fund  :  -4.67% [4388.40]<br> >

    AQR Capital Management : Style Premia Alternative  :  2.42% [1200.00]<br> AQR Capital Management : Alternative Risk Premia  :  1.36% [0.00]<br> Man AHL : Alternative Risk Premia  :  1.53% [0.00]<br> LGT Capital Partners : LGT Risk Premia  :  -2.03% [682.61]<br> Catalyst Funds : Systematic Alpha  :  -0.06% [0.00]<br> 7orca Asset Managment AG : 7orca Vega Return I  :  1.95% [0.00]<br> Nordea Asset Management : Nordea 1  Alpha 7 MA Fund  :  -2.14% [562.80]<br> Nordea Asset Management : Nordea 1  Alpha 10 MA Fund  :  -2.99% [4590.00]<br> NN Investment Partners : Multi Asset Factor Opportunities  :  -2.27% [325.09]<br> Nordea Asset Management : Nordea 1  Alpha 15 MA Fund  :  -4.67% [4388.40]<br> >

    To explore our extensive Risk Premia list, with dynamic rankings, please see Link

    Crypto

    TitaniumStrategy Titanium : JASMYSTRATEGY  :  61.05% [0.00]<br> Limestone Investment Fund : LIMESTONE  :  59.78% [0.00]<br> Project Moon : PROJECTMOON  :  39.57% [0.00]<br> BitcoinTradingStrategy : BITCOINTRADINGSTRATEGY  :  36.80% [0.00]<br> CryptoIVPSI : CRYPTOIVPSI  :  36.80% [0.00]<br> Stylus Capital : Crypto Momentum Fund  :  -6.18% [0.00]<br> xWin : Band Bollinger Moving Average (BBMA)  :  -7.47% [0.00]<br> Mitja Kokovnik : KICKSTART  :  -7.93% [0.00]<br> Solidum Capital : Solidum Multi-Strategy Fund  :  -11.89% [0.19]<br> Anna Asset Management : Anna Fund  :  -14.81% [20.00]<br> >

    TitaniumStrategy Titanium : JASMYSTRATEGY  :  61.05% [0.00]<br> napfton : NAPFTON  :  13.03% [0.00]<br> NFT Powered : GRAZZPNONFUNGIBLETOKENS  :  19.27% [0.00]<br> Nr1crypto : VDBCRYPTOCAP  :  13.70% [0.00]<br> Dazza LT : DAZZALTHOLD  :  20.33% [0.00]<br> Blue Swan : BLUESWAN  :  1.07% [0.00]<br> Phoenix Venture Capital : PHOENIX  :  -0.05% [0.00]<br> Arjuss : CRYPTOPAR  :  5.81% [0.00]<br> Asymmetry Active Performance : MAAX  :  0.48% [0.00]<br> MyStrategy : MYSTRATEGY  :  -4.44% [0.00]<br> >

    To explore our extensive Crypto Strategy list, with dynamic rankings, please see Link

    Past performance is not indicative of future results.


    •  

    Tipping Stability

    NilssonHedge recently contributed a piece to the Hedge Nordic Special Report on Systematic Strategies. Here we introduced a useful heuristic for portfolio robustness. A measure that creates an easy to understand analogy.

    The original post on HedgeNordic can be found here: https://hedgenordic.com/2024/06/a-new-heuristic-for-portfolio-diversification/

    The HedgeNordic Special report can be found as a pdf here: https://hedgenordic.com/systematic-strategies-2024/

    A New Heuristic for Portfolio Diversification

    As portfolio managers, we strive to create the most robust portfolio, with the highest efficiency, be it the Sharpe ratio, the Information ratio, or any other metric that we find useful. We pack risk in the most optimal way possible by utilizing heuristics, mathematical formulas, or simply our judgment to solve a difficult multidimensional puzzle.

    In Finance, this is done under uncertainty, which typically results in two kinds of solutions: Complex solutions relying on viewing the portfolio as a mathematical problem or practical solutions based on experience such as the 1/N concept. “All models are wrong – but some are useful”.

    Heuristics or mental models should not be underestimated when it comes to putting together all the pieces. Even Harry Markowitz, the inventor of Modern Portfolio Theory, applied a much more naïve method than full optimization. He later updated his viewpoint to include a more well-diversified portfolio.

    “I should have computed the historical covariances of the asset classes and drawn an efficient frontier. Instead, I visualized my grief if the stock market went way up, and I wasn’t in it—or if it went way down and I was completely in it. My intention was to minimize my future regret. So, I split my contributions fifty- fifty between bonds and equities.” – Harry Markowitz (“Your Money and Your Brain” – Jason Zweig)

    We want to introduce another heuristic, the ‘Tipping Stability Index’ (“TSI”). The 50/50 portfolio is not a stable solution when viewed from the TSI viewpoint. In 2022, a bond/equity portfolio was anything but stable.

    The Perceived Cost of Diversification

    Diversification is a mentally costly problem, especially regarding portfolios managed by human portfolio managers. Homo Sapiens have limited cognitive capacity, the average individual can handle four different items in ‘working memory’.

    The number of ideas in a portfolio that needs monitoring is thus limited. The proverb ‘put all your eggs in one basket and then watch that basket’ rings particularly true.

    Skilled individuals can handle additional themes, but even those have limits. So, be skeptical about Portfolio Managers, claiming to have hundreds of trades simultaneously. Discretionary portfolio managers operate their ‘concentrated’ / ‘high conviction’ portfolios with great pride.

    For a systematic portfolio, diversification is not cognitively costly, a computer does not have the same limitations as a human being. But clients and individual researchers do. Systematic portfolios can contain several thousands of stocks and hundreds of macro markets and those ideas still must be managed, understood, and communicated to the clients.

    Most systematic strategies focus on one theme, e.g. Trend Following, Value, Momentum, Statistical Arbitrage, Short Term Trading, etc. Not because it is right, but because it is the path of the least resistance.

    Quantitative strategies are structured this way, not because of a lack of creativity, but because it becomes progressively more difficult to explain a complex concept to the end investor or understand it yourself.

    The Tipping Stability Index

    We design a measure that is both easy to understand and tries to answer the question, how many themes/ concepts/strategies should be in a portfolio? What should N be?

    The TSI is an observable measure of robustness and borrows from the design of an everyday common item – the chair. A chair with one leg is not stable but cheap to make, a chair with an infinite number of legs would be rock solid, but not economical.

    As it turns out, five is a number that balances the incremental stability of an additional leg, combined with production costs. Almost all office chairs have five different legs. An office chair is largely impossible to tip over [do not try this]and would probably remain stable even if one leg broke.

    As it turns out there is a simple formula for calculating the stability of a chair with equidistant legs: cos(π/N).

    For any N, this function is increasing, but at a declining rate. In the chart, we see that a portfolio with one strategy has negative stability, “anything that can go wrong will go wrong”. A chair with three legs has stability but is sensitive to losing a component and ending up in a state with no stability (N=2).

    An office chair with five legs is stable and can lose one leg without crashing or coming close to being dangerously unstable. Adding additional legs improves stability, but the marginal benefit is lower.

    From a financial perspective, the number of legs is the cross-correlation between different strategies (groups) and an assumption here is that they are perfectly uncorrelated. Otherwise, the legs of a chair will concentrate on one side of the chair. Naturally, this is not a stable chair.

    The height can be viewed as an analog to portfolio risk. The higher the chair and lighter the base, the less stable the chair is.

    1/N What is N?

    Any reasonable portfolio solution should contain at least three independent assets/strategies. This number also comfortably fits into the working memory of most humans. A natural progression is that any theme can consist of sub-themes, which further improves the stability of the solution (ensure that those strategies are also uncorrelated).

    Equal Risk ensures that the legs are the same length. The leverage needs to be adjusted for the center of mass of the portfolio. Too much leverage and it does not matter how stable your asset mix is.

    The ‘failure’ of the traditional bond/equity portfolios in 2022 was partly driven by the fact that the market changed. As the correlation shifted positive, the portfolio effectively turned into a one-legged chair. A TSI-based solution consisting of bonds, equities, and for instance, Managed Futures fared much better as seen in the chart. Substitute Managed Futures with your favorite uncorrelated strategy for similar results.

    Summary

    While the TSI is a simplification of how portfolios are constructed, it offers a minimum threshold to the

    number of independent themes in a portfolio. Run a concentrated portfolio of three individual bets, you better have good backup ideas if one of them fails. If you are running a portfolio of three uncorrelated active sub-portfolios, you are likely in a better place.

    A systematic strategy consisting of tens of uncorrelated strategies is in a better position to deliver a TSI-stable outcome. If nothing else, we hope that you checked the number of legs on your chair (we are almost certain it is five) but did not stress test the stability of your chair. Perhaps it is time to test the assumption in your ‘broadly’ diversified portfolio?

    As with your chair, the key to a stable portfolio is finding truly uncorrelated strategies.

    •  

    Best’n’Worst April 2024

    As part of our usual service to our database users, we compile the Top 5 and Bottom 5 managers per strategy (based on the data we have access to right now). We see some remarkable results. For more details, please feel free to dig deeper into the more detailed forecasts using the links below.

    CTA

    Moddco Capital Associates : MCA  :  22.31% [0.19]<br> INSCH Kintore : CrossBorder Kintore XAU/FX  :  18.60% [64.90]<br> AG Capital Investments : Discretionary Global Macro  :  17.10% [166.80]<br> Maccabi Capital Management : Alpha Futures  :  16.44% [1.20]<br> Svelland Capital : Commodities Futures Plus  :  15.89% [0.00]<br> Vivienne Investissement : Ouessant UCITS A  :  -8.04% [46.22]<br> Melissinos Trading : Eupatrid Commodity  :  -10.12% [10.00]<br> Haidar Capital Management : Jupiter Fund  :  -13.15% [1364.88]<br> QQFund.com : Alpha Beta Program  :  -13.30% [9.57]<br> Vivienne Investissement : MACH 3  :  -21.51% [13.30]<br> >

    Mulvaney Capital Management : Global Diversified Program  :  4.49% [424.00]<br> Purple Valley Capital : Diversified Trend 1  :  2.24% [10.00]<br> Transtrend BV : Tulip Trend Fund  :  2.18% [154.87]<br> Bowmoor Capital : Global Alpha Fund  :  7.11% [24.40]<br> Incline Investment Management : Crystal Bay Ubitrend  :  8.75% [4.50]<br> Aquantum : ACS Energies  :  -4.48% [43.60]<br> Black Tango : VIX Program  :  -6.46% [0.13]<br> Vivienne Investissement : MACH 3  :  -21.51% [13.30]<br> Opus Futures : Macro Monitor Program  :  -0.82% [10.41]<br> QTS Capital Management : Tail Reaper  :  -6.14% [7.20]<br> >


    To explore the full list of CTAs and their rankings, including dynamic updates as new data becomes available, we invite you to visit our website at the Link provided.

    Market Neutral

    AQR Capital Management : Equity Market Neutral  :  3.26% [515.28]<br> Man GLG : GLG UK Absolute Value  :  2.74% [485.53]<br> Blackrock : Asia-Pacific Diversified  :  2.70% [91.88]<br> ActusRay Partners : European Alpha Market Neutral  :  2.19% [80.89]<br> Trium Capital : Climate Impact  :  2.09% [53.25]<br> Pula Capital Managament : Pula Capital Fund  :  -2.58% [15.20]<br> Aphilion : Aphilion SIF  :  -2.64% [38.21]<br> ABCA Asset Management : ABCA Opportunities  :  -2.75% [69.45]<br> Neo Ivy Capital Management : Neo Ivy  :  -2.84% [0.00]<br> PIMCO : PIMCO RAE Fundamental Advantage PLUS  :  -3.24% [0.00]<br> >

    Aphilion : Aphilion SIF  :  -2.64% [38.21]<br> AQR Capital Management : Equity Market Neutral  :  3.26% [515.28]<br> Neo Ivy Capital Management : Neo Ivy  :  -2.84% [0.00]<br> ActusRay Partners : European Alpha Market Neutral  :  2.19% [80.89]<br> RAM : Long Short European  :  1.98% [123.29]<br> Guggenheim : Guggenheim Market Neutral  :  -0.96% [0.00]<br> Pictet Asset Management : Agora  :  -1.82% [176.30]<br> Victory : Victory Market Neutral Income  :  1.71% [0.00]<br> MarshallWace : Systematic Alpha Market Neutral  :  -2.50% [660.42]<br> LGT Capital Partners : LGT Sustainable Equity Market  :  -0.12% [59.80]<br> >

    To explore our extensive list of Market Neutral funds and their dynamic rankings, we invite you to visit our website at the link provided here.


    Equity Long/Short

    Odey : Absolute Return Focus Fund  :  16.70% [125.45]<br> Pensum Asset Management : Global Opportunities  :  11.21% [14.80]<br> Lancaster : Absolute Return (Odey)  :  9.64% [346.31]<br> Cederberg Capital : Greater China (Banor)  :  6.75% [97.17]<br> Accendo Capital : Accendo Capital  :  5.83% [136.80]<br> Weitz Partners III : Weitz Partners III Opportunity  :  -5.44% [0.00]<br> Toews : Toews Tactical Monument  :  -5.57% [0.00]<br> Toews : Toews Tactical Defensive Alpha  :  -6.16% [0.00]<br> Toews : Toews Tactical Opportunity  :  -7.52% [0.00]<br> Virtus KAR : Virtus KAR Long/Short Equity  :  -7.67% [0.00]<br> >

    TIND Asset Management : TIND Discovery Fund  :  5.30% [0.00]<br> ARR Investment Partners : Global LS Strategy  :  5.32% [27.00]<br> AQR Capital Management : Sustainable Long-Short Eq  :  0.82% [0.00]<br> AQR Capital Management : Long-Short Equity  :  1.80% [0.00]<br> Alcur : Alcur Select  :  2.11% [388.80]<br> Accendo Capital : Accendo Capital  :  5.83% [136.80]<br> Sherborne : Investors Guernsey  :  -3.93% [0.00]<br> Proxy P Management : Proxy Renewable LongShort Energy  :  -2.84% [48.00]<br> Proxy P Management : Energy Transition  :  -3.87% [12.53]<br> BNP : Environmental Absolute Return  :  -4.57% [12.60]<br> >

    To explore our extensive Equity Long/Short list, with dynamic rankings, please see Link

    Event Driven

    MY Alpha Management : Asian Event Driven  :  2.29% [19.84]<br> PrivilEdge : Amber Event Europe  :  1.94% [148.22]<br> Neuberger Berman : Distressed Debt Extended Life Shares  :  1.92% [0.00]<br> TreeCap : Arbitrage Fund (Composite)  :  1.27% [0.00]<br> Pictet Asset Management : Lotus  :  1.15% [148.91]<br> AllianceBernstein : Event Driven Portfolio  :  -2.11% [159.33]<br> Cheyne : Cheyne Arbitrage (U Access)  :  -2.21% [19.60]<br> Driehaus : Event Driven  :  -2.37% [0.00]<br> Alpine : Merger Arbitrage  :  -3.86% [114.46]<br> Melqart Asset Management : Event Driven  :  -4.59% [126.41]<br> >


    Third Point : Third Point  :  -1.54% [0.00]<br> Gabelli : Merger Plus  :  0.00% [0.00]<br> MY Alpha Management : Asian Event Driven  :  2.29% [19.84]<br> Gabelli : Merger Arb  :  0.00% [0.00]<br> Pictet Asset Management : Lotus  :  1.15% [148.91]<br> Weiss Alternative : Monthly Distribution (Dunham)  :  -0.84% [0.00]<br> AllianceBernstein : Event Driven Portfolio  :  -2.11% [159.33]<br> Melqart Asset Management : Event Driven  :  -4.59% [126.41]<br> Alpine : Merger Arbitrage  :  -3.86% [114.46]<br> Neuberger Berman : Distressed Debt Ordinary Shares  :  0.00% [0.00]<br> >

    To explore our extensive Event-Driven list, with dynamic rankings, please see Link

    Fixed Income

    Marble Point : Loan Financing  :  7.20% [0.00]<br> Nordea Asset Management : European Rates Opportunity  :  3.97% [340.80]<br> Fair Oaks Capital : Income  :  3.63% [0.00]<br> Moma Advisors : Asgard Fixed Income Fund  :  2.97% [1162.80]<br> Volta Finance : Volta Finance  :  2.75% [0.00]<br> Fisch Asset Management : Absolute Return Global  :  -3.18% [0.00]<br> GAM International Management : Star Global Rates  :  -3.48% [245.03]<br> HP Fondsmaglerselskab : HP Hedge Danish Bonds  :  -3.73% [40.90]<br> Legg Mason : Western Asset Macro Opp  :  -6.37% [930.61]<br> VPC : Specialty Lending Investments  :  -6.90% [0.00]<br> >

    Marble Point : Loan Financing  :  7.20% [0.00]<br> Chenavari : Toro Income Fund  :  0.00% [0.00]<br> Nordea Asset Management : European Rates Opportunity  :  3.97% [340.80]<br> BioPharma : BioPharma Credit  :  0.91% [0.00]<br> Moma Advisors : Asgard Fixed Income Fund  :  2.97% [1162.80]<br> GAM International Management : Star Emerging Market  :  -1.98% [11.60]<br> Lazard : Emerging Markets Debt Blend  :  -2.62% [0.00]<br> Skandinaviska Kreditfonden : Scandinavian Credit Fund I  :  -2.07% [388.90]<br> Legg Mason : Western Asset Macro Opp  :  -6.37% [930.61]<br> VPC : Specialty Lending Investments  :  -6.90% [0.00]<br> >

    To explore our extensive Fixed Income list, with dynamic rankings, please see Link

    Risk Premia

    Quadriga : Stable Return  :  4.93% [4.69]<br> Nomura : Fixed Income Risk Premia  :  2.64% [1.53]<br> Man AHL : Alternative Risk Premia  :  2.07% [0.00]<br> Man AHL : Alternative Style Premia  :  2.05% [272.79]<br> Future Value Capital : Equity Dispersion  :  1.87% [72.64]<br> First Private : Private Wealth  :  -2.36% [81.29]<br> Nordea Asset Management : Nordea 1  Alpha 10 MA Fund  :  -2.97% [4590.00]<br> Nordea Asset Management : Nordea 1  Alpha 15 MA Fund  :  -4.85% [4388.40]<br> Sharper Machine : Eagle Vision Moderate Risk  :  -5.08% [0.19]<br> Sharper Machine : Eagle Vision  :  -8.37% [0.16]<br> >

    AQR Capital Management : Style Premia  :  1.17% [400.25]<br> AQR Capital Management : Alternative Risk Premia  :  0.83% [0.00]<br> AQR Capital Management : Style Premia Alternative  :  1.15% [1150.00]<br> Systematica Investments : Alternative Risk Premia  :  0.23% [869.00]<br> LGT Capital Partners : LGT Risk Premia  :  1.07% [682.61]<br> 7orca Asset Managment AG : 7orca Vega Return I  :  -0.96% [0.00]<br> Nordea Asset Management : Nordea 1  Alpha 15 MA Fund  :  -4.85% [4388.40]<br> NN Investment Partners : Multi Asset Factor Opportunities  :  -1.25% [325.09]<br> Windham Capital Management : Risk Premia  :  1.45% [195.70]<br> Quadriga : Stable Return  :  4.93% [4.69]<br> >

    To explore our extensive Risk Premia list, with dynamic rankings, please see Link

    Crypto

    Anna Asset Management : Anna Fund  :  40.54% [18.20]<br> PL Digital Management Pte : Presto Digital Fund  :  12.16% [18.06]<br> P-Hat Fund : P-Hat Fund  :  11.15% [23.53]<br> P-Hat Fund : Soft vision  :  9.96% [20.50]<br> PL Digital Management Pte : Presto Digital Fund 1  :  9.58% [0.00]<br> SIRIUS CMa Sirius1CMa : SIRIUS SIRIUS CMa  :  -41.23% [0.00]<br> Asymmetry Active Performance : MAAX  :  -41.32% [0.00]<br> MyStrategy : MYSTRATEGY  :  -42.61% [0.00]<br> Hole in One Josch : 554BC485571344C890D16DC3BE4460  :  -42.94% [0.00]<br> Crypto Assets Alpha X Technology Limited : CRYPTOASSETSALPHA  :  -64.93% [0.00]<br> >

    TitaniumStrategy Titanium : JASMYSTRATEGY  :  -22.71% [0.00]<br> Anna Asset Management : Anna Fund  :  40.54% [18.20]<br> napfton : NAPFTON  :  -23.99% [0.00]<br> Nr1crypto : VDBCRYPTOCAP  :  -27.19% [0.00]<br> Jump Start : JUMPSTART  :  -13.48% [0.00]<br> Crypto Asset Management : Strategy One  :  -32.11% [0.05]<br> Arjuss : CRYPTOPAR  :  -36.76% [0.00]<br> Utopia Capital : UTOPIADEFI  :  -35.81% [0.00]<br> MyStrategy : MYSTRATEGY  :  -42.61% [0.00]<br> Crypto Assets Alpha X Technology Limited : CRYPTOASSETSALPHA  :  -64.93% [0.00]<br> >

    To explore our extensive Crypto Strategy list, with dynamic rankings, please see Link

    Past performance is not indicative of future results.

    •  

    Cocoa – The market that did not know it could trend

    When moving outside the normal noise in equity and bond markets, the big story in the Global Futures markets has largely centered around the Cocoa markets (there are two of them). Here, a large part of the profits for trend followers have been generated. And the decision to have this peculiar market in the portfolio largely determined the YTD for trend based strategies.

    Last month, the market was rife with calls for Cocoa to continue to trend up. Pierre Andurand, someone who was accused of being a Cocoa Tourist, made a prediction of 20k a few weeks ago. We, like many other overly Futures Interested Persons, have developed a keen interest in the gyrations of the Cocoa market.

    As we will show, the Cocoa market has been a really uninspiring to trade over the last decade. The Future that could not trend, suddenly became one of the trendiest trades around.

    Source: Barchart Cocoa Market

    What was looking like an unstoppable rise came to an abrupt halt in April as the rain clouds moved in over the Ivory Coast. The supply outlook brightened. As the weather change appears to be somewhat sustainable, Cocoa prices reversed with a vengeance.

    Source: Open Earth

    After a stratospheric rise in price from mid-2022, Cocoa saw a ~500% increase a price. In the last couple of weeks, it has reveres from highs of 12,000 down to close to 8,000 per ton. Post the reversal, the market seems to have calmed down and recent movements have been small compared to the recent past.

    To illustrate the difficulties trading Cocoa, we simulate a simple Breakout strategy, i.e. if prices are higher/lower than in the prior X days, we go long/short. While no particular CTA is using a simplistic strategy like this, it gives an indication of how CTAs have been positioned.

    Since 2010, until today, only the longer time frames seems to have been able to pick up any sustainable pnl over time. In this example, we are using a volatility based position sizing, reducing the giveback in the end. As a comparison, we simulate the same strategy, but without dynamic position adjustments.

    Without volatility-based position adjustment, all of the time frames would have been loss-making, despite the recent rally. The chart below shows how a volatility sensitive trend strategy would have adjusted position levels. We observe two effects, the increase in price and the increase in volatility leading to a dramatic volatility reduction. This resulted in a 95% reduction in positions for a generic trend follower.

    We also note that only the shorter time frames have switched position in Cocoa, from long to short. As volatility and price have subsided a bit, CTAs have started to add back risk.

    If trading Cocoa futures was a true one-hit wonder, or if the market has changed the dynamic completely is something best left for the more knowledgeable crowd. Here, we note that dynamic position sizing seems to have reduced drawdowns and managed the pnl slightly better over time, compared to non-vol adjusted trend strategies.

    Cocoa is not alone of being unprofitable for trend traders. Silver is another classical example that continuously suffers from whipsaw losses. But occasionally they will make the year for trend managers. True outliers are difficult to predict.

    •  

    Tracking the Growth of the NilssonHedge Database

    We have too few observations for April 2023 to report anything of value in comparison to our prior ‘Flash Report‘, although it seems like CTAs lost money in the last few days of the month, after briefly flirting with new highs. So, we will utilize this space to describe recent trends and developments in the NilssonHedge database.

    The number of new manager inputs that are being added to the Database remains at the same pace as in the prior year, between 1,000 and 1,250 new returns sources per year. As per usual, most of our growth happens in the CTA and Crypto segment, where we have lower coverage of the traditional hedge fund strategies. In particular, Equity Long/Short is a segment that has grown at a higher rate than in earlier years, perhaps reflecting the results and investor interest within that segment.

    To demonstrate the growth of the database, the charts above show the increasing data points collected and the number of unique return estimates. We are rapidly heading towards 15,000 unique input sources and more than 550,000 unique return estimates. We also have a large daily return set, including position-based data for a number of strategies. 

    So, what can you do with this data source? 

    • Benchmarking – Our benchmarking reports offer quick screening possibilities and arguments that can strengthen the case for a particular manager.
    • Indices – NilssonHedge maintains a large set of both specialized and generic hedge fund indices. These are free to use and available for download via the Member’s Library.
    • Dispersion – Is your performance above or below the average manager?
    • Market Intelligence – The NilssonReport offers quick insights into industry performance.
    • Hedge Fund Exposures – We track correlation and implied market exposure for our main daily indices.
    • The Hit List – Crude ranking, based on absolute performance, across a large set of managers.
    • And of course our main database.

    Thanks for reading our public service announcement. If you would like to add your strategy to our database, please follow this link.

    •  

    Flash Report – April 2024

    April continued to be an interesting month, from a macro perspective, with several interesting moves. We saw a significant streak of negative days in the equity markets, a depreciation of the JPY, and a mix of risk aversion and risk seeking behavior. We witnessed a somewhat well-advertised Iranian strike on Israel (in response to the killing of a senior revolutionary guard general), and a somewhat muted response. All in all, April brought a lot of unanticipated moves.

    Post the Israeli response markets calmed down a bit and equity markets partially bounced back. The JPY depreciated at an increasing pace which triggered further opportunities for CTAs. Inflation continued to print higher numbers and the odds for a FED decrease any time soon are now rapidly being discounted out of the market pricing.

    In terms of our daily performance barometers, CTA did well, although encountering slightly wobbly conditions mid month, they look to end the month higher. Equity sensitive strategies generally lost money on the back of a less than healthy equity market. Equity market neutral held up well.

    In terms of CTA positions (derived from ETF) we see an increased exposure to Long USD (here shown as short exposures) provided good trading opportunities, long exposure to Energy paid off due to the increasing tensions in the Middle East. Base Metals performed well in light of a new restrictive delivery mechanism for the LME. All in all, a good opportunity for Trend Followers that made money in most sectors except for Equity. The darling of the last few months, Cocoa managed to avoid selling off, but seems to have lost a bit of momentum.

    Interesting to see is that brief flirting with long positions in Bond Futures provided to be short lived.

    In the next few months, NilssonHedge will have several interesting developments. Stay tuned, we are getting closer.

    •  

    Best (and Worst) Funds Q1 2024

    In the first quarter of 2024 Hedge Funds produced some remarkably strong result for Hedge Funds, partly driven by a strong equity market and the odd commodity (Cocoa and Gold plus a few other markets). Most of our rankings are skewed to the upside, i.e. the winning fund won multiples of the what the worst fund lost.

    While we are not covering all Hedge Funds, our hitlists gives an indication of the performance in the tails. To the winners, a big congratulations.

    CTA

    Mulvaney Capital Management : Global Diversified Program  :  51.05% [465.00]<br> t24 Capital : Global Macro  :  8.97% [1.00]<br> t24 Capital : TCM Global Index Fund  :  8.97% [25.00]<br> Purple Valley Capital : Diversified Trend 1  :  24.03% [10.00]<br> Transtrend BV : Tulip Trend Fund  :  11.15% [153.07]<br> Swarm Technology : Swarm XVI  :  -8.36% [95.00]<br> QTS Capital Management : Tail Reaper  :  -7.36% [7.20]<br> Spartan Asset Group : Super Senior Program  :  3.75% [0.17]<br> Opus Futures : Macro Monitor Program  :  -5.98% [10.09]<br> Takahe Capital : Systematic Momentum Program  :  -4.29% [1.98]<br> >


    To explore the full list of CTAs and their rankings, including dynamic updates as new data becomes available, we invite you to visit our website at the Link provided.

    Market Neutral

    AQR Capital Management : Equity Market Neutral  :  5.23% [438.64]<br> Aphilion : Aphilion SIF  :  5.17% [38.60]<br> PIMCO : PIMCO RAE Fundamental Advantage PLUS  :  4.28% [0.00]<br> Campbell & Company : Campbell Quantitative Equities Portfolio  :  4.00% [0.00]<br> Candriam Investors Group : Absolute Return Equity Market Neutral  :  3.26% [587.39]<br> Tellworth : European Market Neutral  :  -0.81% [32.93]<br> RAM : Long Short Global  :  -0.82% [16.10]<br> Victory : Victory Market Neutral Income  :  -0.94% [0.00]<br> LGT Capital Partners : LGT Sustainable Equity Market  :  -1.02% [70.60]<br> Sector Asset Management : Munin Quant  :  -3.77% [40.00]<br> >

    Aphilion : Aphilion SIF  :  5.17% [38.60]<br> AQR Capital Management : Equity Market Neutral  :  5.23% [438.64]<br> Fulcrum Asset Management : Thematic Equity Market  :  0.19% [370.72]<br> Gotham : Gotham Neutral  :  2.32% [0.00]<br> Federated Hermes : MDT Market Neutral  :  1.20% [0.00]<br> Westwood : Westwood Market Neutral Income Instl  :  -0.37% [0.00]<br> MarshallWace : Systematic Alpha Market Neutral  :  -0.04% [713.30]<br> Victory : Victory Market Neutral Income  :  -0.94% [0.00]<br> Sector Asset Management : Munin Quant  :  -3.77% [40.00]<br> LGT Capital Partners : LGT Sustainable Equity Market  :  -1.02% [70.60]<br> >

    To explore our extensive list of Market Neutral funds and their dynamic rankings, we invite you to visit our website at the link provided here.


    Equity Long/Short

    Prior & Nilsson Fond och Kapitalforvaltning : PriorNilsson Fastighet  :  11.86% [3.00]<br> Coeli Asset Management : Coeli European  :  9.64% [68.40]<br> TIND Asset Management : TIND Discovery Fund  :  9.56% [0.00]<br> Pensum Asset Management : Global Opportunities  :  8.47% [14.80]<br> AQR Capital Management : Sustainable Long-Short Eq  :  7.66% [0.00]<br> Redwood Partners : Redwood  :  -1.91% [12.06]<br> Platinum : World Portfolios Japan  :  -2.52% [8.60]<br> Dalton Investments : India Fund  :  -2.82% [40.50]<br> Accendo Capital : Accendo Capital  :  -3.40% [129.60]<br> BNP : Environmental Absolute Return  :  -5.49% [19.69]<br> >

    HELSINKI CAPITAL PARTNERS : HCP Focus Fund  :  1.32% [15.60]<br> AQR Capital Management : Sustainable Long-Short Eq  :  7.66% [0.00]<br> TIND Asset Management : TIND Discovery Fund  :  9.56% [0.00]<br> Counterpoint : Counterpoint Tactical Equity  :  3.08% [0.00]<br> FMG Malta : Impega  :  3.17% [0.00]<br> Proxy P Management : Proxy Renewable LongShort Energy  :  6.99% [0.00]<br> Nuance : Nuance Concentrated Value L-S  :  -0.12% [0.00]<br> Proxy P Management : Energy Transition  :  4.14% [22.42]<br> Accendo Capital : Accendo Capital  :  -3.40% [129.60]<br> BNP : Environmental Absolute Return  :  -5.49% [19.69]<br> >

    To explore our extensive Equity Long/Short list, with dynamic rankings, please see Link

    Event Driven

    First Private : Systematic Merger Opportunities  :  8.43% [10.55]<br> Third Point : Third Point  :  5.59% [0.00]<br> CIAM : Satellite Event Driven  :  4.98% [1.66]<br> PSAM : Global Event (Lumyna)  :  3.82% [280.11]<br> Gabelli : Mergers & Acquisitions  :  3.64% [0.00]<br> Hadron : Alpha Select  :  -0.39% [10.44]<br> Boussard Gavaudan : Absolute Return  :  -0.97% [62.23]<br> >


    Third Point : Third Point  :  5.59% [0.00]<br> First Private : Systematic Merger Opportunities  :  8.43% [10.55]<br> Gabelli : Merger Arb  :  0.00% [0.00]<br> MY Alpha Management : Asian Event Driven  :  2.93% [31.74]<br> PSAM : Global Event (Lumyna)  :  3.82% [280.11]<br> Boussard Gavaudan : Absolute Return  :  -0.97% [62.23]<br> Weiss Alternative : Monthly Distribution (Dunham)  :  0.00% [0.00]<br> AllianceBernstein : Event Driven Portfolio  :  1.11% [169.59]<br> Alpine : Merger Arbitrage  :  1.86% [135.97]<br> Hadron : Alpha Select  :  -0.39% [10.44]<br> >

    To explore our extensive Event-Driven list, with dynamic rankings, please see Link

    Fixed Income


    Enko Capital Management : Africa Debt Fund  :  9.42% [269.20]<br> CQS : New City High Yield Fund  :  4.43% [0.00]<br> RBC GAM : BlueBay Emerging Market Credit Alpha Fund (EMCA)  :  4.21% [178.38]<br> Nordea Asset Management : European Rates Opportunity  :  3.82% [340.80]<br> Danske Bank Asset Management : Danske Invest Fixed Income Relative Value  :  3.20% [494.90]<br> GCP : Asset Backed Income  :  -1.16% [0.00]<br> Excalibur Asset Management : Excalibur  :  -1.35% [99.20]<br> RBC GAM : BlueBay Global Sovereign Opportunities Fund (GSOV)  :  -1.84% [437.48]<br> RBC GAM : BlueBay Global Sovereign Opportunities Fund Limited (Cayman)  :  -1.85% [100.37]<br> Skandinaviska Kreditfonden : Scandinavian Credit Fund I  :  -5.63% [388.90]<br> >

    Enko Capital Management : Africa Debt Fund  :  9.42% [269.20]<br> BioPharma : BioPharma Credit  :  0.37% [0.00]<br> Nordea Asset Management : European Rates Opportunity  :  3.82% [340.80]<br> CABA Capital : CABA Hedge  :  1.67% [160.90]<br> RBC GAM : BlueBay Emerging Market Credit Alpha Fund (EMCA)  :  4.21% [178.38]<br> Legg Mason : Western Asset Macro Opp  :  1.18% [1102.62]<br> GAM International Management : Star Emerging Market  :  -0.86% [14.10]<br> Ironshield Capital Management : Credit Fund  :  0.08% [108.93]<br> Skandinaviska Kreditfonden : Scandinavian Credit Fund I  :  -5.63% [388.90]<br> VPC : Specialty Lending Investments  :  0.00% [0.00]<br> >

    To explore our extensive Fixed Income list, with dynamic rankings, please see Link

    Risk Premia

    AQR Capital Management : Style Premia  :  8.25% [366.12]<br> AQR Capital Management : Style Premia Alternative  :  6.96% [1140.00]<br> AQR Capital Management : Alternative Risk Premia  :  6.84% [0.00]<br> Catalyst Funds : Systematic Alpha  :  6.33% [0.00]<br> Sharper Machine : Eagle Vision  :  6.11% [0.17]<br> Loomis Sayles : Alternative Risk Premia  :  -0.14% [22.11]<br> Future Value Capital : Equity Dispersion  :  -0.31% [79.35]<br> Oxeye Capital Management : Oxeye (BOPS) 5X  :  -6.69% [4.90]<br> >

    AQR Capital Management : Style Premia  :  8.25% [366.12]<br> AQR Capital Management : Alternative Risk Premia  :  6.84% [0.00]<br> AQR Capital Management : Style Premia Alternative  :  6.96% [1140.00]<br> Systematica Investments : Alternative Risk Premia  :  3.48% [873.00]<br> Sharper Machine : Eagle Vision  :  6.11% [0.17]<br> BNP Theam : Quant Cross Asset High Focus  :  2.34% [805.75]<br> Future Value Capital : Equity Dispersion  :  -0.31% [79.35]<br> Quadriga : Stable Return  :  3.51% [5.18]<br> >

    To explore our extensive Risk Premia list, with dynamic rankings, please see Link

    Crypto

    napfton : NAPFTON  :  162.8% [0.00]<br> Dazza LT : DAZZALTHOLD  :  150.4% [0.00]<br> Nr1crypto : VDBCRYPTOCAP  :  143.3% [0.00]<br> SmallCaps 2 : CKPSMALLCAPS2  :  64.38% [0.00]<br> Pecunio : PECUNIOSPECIALOPPORTUNITIES  :  64.08% [0.00]<br> Glitter coin : GLITTERCOIN  :  -8.76% [0.00]<br> Crush : CCC Crush Crypto Core  :  -9.91% [0.00]<br> Best Perform Crypto : BESTPERFORMLAST7D  :  -10.23% [0.00]<br> Utopia Capital : UTOPIADEFI  :  -16.63% [0.00]<br> Lavaliere Capital Management : Lavaliere Capital Fund  :  -17.50% [10.00]<br> >

    Dazza LT : DAZZALTHOLD  :  150.4% [0.00]<br> TitaniumStrategy Titanium : JASMYSTRATEGY  :  8.38% [0.00]<br> NFT Powered : GRAZZPNONFUNGIBLETOKENS  :  54.87% [0.00]<br> napfton : NAPFTON  :  162.8% [0.00]<br> Nr1crypto : VDBCRYPTOCAP  :  143.3% [0.00]<br> Lavaliere Capital Management : Lavaliere Capital Fund  :  -17.50% [10.00]<br> Aubur X20 : AUBURA4  :  6.67% [0.00]<br> xWin : Dollar Cost Average (DCA GMX)  :  -5.77% [0.00]<br> Best Perform Crypto : BESTPERFORMLAST7D  :  -10.23% [0.00]<br> Phoenix Venture Capital : PHOENIX  :  -3.43% [0.00]<br> >

    To explore our extensive Crypto Strategy list, with dynamic rankings, please see Link

    Past performance is not indicative of future results.

    •  

    State of the CTA Universe

    CTA strategies continues to do well, putting up strong numbers in Q1 2024. Our index looks to be up 4.6% for Q1and the index is now at new highs. That does however not make it easier to raise capital or to operate a CTA. We monitor the number of managers and entities that are registered with the NFA. A snapshot of the current statistics can be found here. Our time series can be found on our dedicated page.

    The interested reader may note that we classify some managers as a CTA, despite them not being registered as a CTA. Our classification is functional, if a manager largely trades Futures or other Macro market, we tend to include them in our CTA classification. Any investor is requested to do their own due diligence and very the status of any potential manager that they are seeking to do business with. A good start is the ‘BASIC‘ service offered by the NFA.

    The number of CTAs and CPOs may have stopped to decline, perhaps a reflection of the strong recovery by the average manager and perhaps a slightly improved asset raising climate.

    To increase confusion, there are managers that are registered in multiple classes, e.g. both as a CTA and a CPO, depending on how you seek to do business. The number of managers continues to decline by close to 3% per annum.

    The largest decline we observed was for the number of associates, a 5% decline in a single month. We are uncertain why this took place now. It could be a general cleanup of the number of firms, or a change in the overall framework.

    We observed several new names of the last few years: Bitnomial, Clear Street, Coinbase, MFI, RobinHood, and WeBull to name a few. This partly reflect the Crypto Futures where several of the new FCM have a strong connection to Crypto Markets. More detailed FCM data can be found on the CFTC website.

    Last week NilssonHedge went skiing. We do apologize if we have not gotten back to you yet. The database are updated and available for download.

    •  

    Flash Report March 2024

    The first quarter of 2024 was a solid quarter for liquid alternatives. While few managers have reported their estimates for March, it looks like CTAs had a stellar quarter, with a 7.1% quarterly result leaving other strategies behind. While part of it is driven by equity market longs, a large part of it is also driven by Cocoa, the magnificent breakout out of 2024. A ton of Cocoa is now as expensive as a ton of Copper as the market is being squeezed higher, partly based on dire fundamentals but also based on technicals.

    Crypto Managers (mainly Digital Asset Allocators) had a stellar quarter, although gave back some of the profits into the end of the quarter. This was the quarter when the Bitcoin ETFs really took off, combined with the rumor surrounding the potential approval or disapproval of ETH ETFs.

    Equity Long/Short strategies continued to benefit from the strong equity market trends as the market discounted additional easing from the Federal Reserve and they climbed a wall of worry as several strategists predicted a pullback, that is yet to happen.

    Market Neutral strategies continue to be a strong streak. Since June-23 we have yet to see a negative number. While the returns are not spectacular, the streak from a well diversified quant equity portfolio has been very stable.

    While Event Driven strategies have lagged behind, we are now seeing a small pickup in activity.

    A strong quarter for all of the liquid strategies that we track. Thanks for reading and please do not hesitate to reach out.

    •  

    Top 50 Hedge Fund Survey – Wrapping up 2023

    An exceptional feature of Global Investment Report’s annual survey of the Top 50 hedge funds is that it tracks the subsequent performance of the latest featured funds while discussing evolving macro and industry trends.  Below is my discussion with the report’s author, Eric Uhlfelder, about his full-year findings.  Click here to see the year-end study and the full-year survey. This is Eric’s 20th annual report. Learn more about the Global Investment Report here. You can find the 4Q Report here.

    NilssonHedge/Linus: Eric, it is a pleasure to have you back. Congratulations on wrapping up your 20th year of surveying hedge funds Eric. In addition to your deep data dive into the world’s most consistently performing managers, your subsequent quarterly updates put your fund selection results to the test. Your 2022 crop of managers outperformed the market hugely. But in 2023 they barely outperformed Treasurys. What went wrong?

    Eric: Thanks Linus. We definitely saw a reversal of fortunes between what the Top 50 did in 2022 versus what the latest group did in 2023. (Reminder: the performance in 2022 reflected the funds that were selected in 2021; and those tracked in 2023 were selected in 2022. More than two-thirds of the funds that made the previous year list have made the cut the following year (Methodology behind the selection is described on page 3 of the original 2023 survey).

    To your question: I’ve been interviewing managers, allocators, and analysts to find the most compelling explanations for why so many PMs (and those in the Top 50) remained circumspect last year.

    The best I can figure is that many successful managers saw little reason to rotate away from their cautious stance that had served them so well in 2022, in spite macroeconomic conditions improving with each passing quarter in 2023.

    To be fair, there was strong consensus that the sharp rise in rates would trigger a cascade of problems that would metastasize. That simply didn’t happen in 2023.

    The sell-off that did occur in the second half confirmed bearish sentiment. So many managers turned more negative only to get hammered when stocks soared toward the end of the year.

    NilssonHedge/Linus: Why do you think managers remained skeptical, especially when the second half of 2023 was trending positive?

    Eric: Several reasons. One, common belief is the rapid rise in rates in 2022 would take time before affecting economic growth and corporate profits. So far it hasn’t. Two, many mistook monetary tightening to mean a shift to a high interest-rate environment. It wasn’t. Current rates are at historically average levels. Three, managers and economists underappreciated several factors: the sustained economic boost from three major federal programs passed under President Biden, the shift in outsourcing from foreign to domestic firms to help meet just-in-time production schedules, and elevated household spending due in part to excess savings during Covid that has lasted longer than most economics expected. Let’s not forget the market rally is further fueling this virtuous cycle.

    NilssonHedge/Linus: Which funds surprised you on the downside in 2023?

    Eric: Here’s a list of well-established funds that had perennially made my survey but that won’t make my 2024 cut because they returned less than 5% in 2023.

    • John Street Capital Systematic (2013)—Global Macro
    • Schonfeld Strategic Partners (2016)—Multistrategy
    • Schonfeld Fundamental Equity (2016)—Equity Long/Short
    • Tudor BVI Global Macro (1986)
    • Segantii Asia-Pacific Multistrategy (2007)
    • Episteme (2009)—Systematic Macro
    • Haidar-Jupiter (1999)—Global Macro
    • Twin Tree Capital (2013)—Volatility Trading
    • Arena Special Opportunities (2015)

    Two things jump out from this sample list: they include a bunch of global macro and multistrategy funds.

    On the macro side, the collapse of Haidar wasn’t a surprise because of how juiced Said Haidar was running his book. John Street’s decline wasn’t expected.  But it’s worth noting the fund had delivered exceptional returns in 2021 and 2022, which might’ve been indicative of rising risk taking.

    Multistrategy funds generally did OK, led by Citadel Wellington and Millennium.  But collectively Schonfeld Strategic Partners, Hudson Bay, and Boothbay Absolute Returns underperformed short-term Treasurys. Segantii was slightly in the red and Episteme suffered one of its worst drawdowns.

    NilssonHedge/Linus:  Those are some really well-known names on the Macro and Multistrategy side that are disappearing from your coverage. Do you think that may mean the best days of multistrategy and macro are behind them?

    Eric: Performance of most strategies, including multistrategy and macro, are somewhat cyclical.  I wouldn’t write them off. 

    But you’ve raised the point yourself Linus that multistrategy funds have become increasingly expensive and highly competitive when it comes to talent.  Both factors weigh on net returns.  Even Ken Griffin suggested the strategy’s best days may be behind it. 

    I’m more worried about the bolt-on manager approach to multistrategy.  This presents a fundamental integration problem: a compromised work culture due to muddled sense of common allegiance and purpose.  (An apt analogy could be the struggles plaguing Boeing because it shifted so much work to independent outsourcing.  Maybe.)

    I never thought this fragmented style of fund management could produce a better and enduring investment process.  We’ll see if the current spate of layoffs leads to any fundamental changes in process. I personally don’t think so.

    NilssonHedge/Linus: What about your equity funds ?

    Eric: The Top 50 hedged equities struggled. I don’t think this was due to minimum exposure to the Magnificent Seven as many have said. According to Forbes, the other 493 stocks in the index generated total returns of more than 10% and European and Far Eastern markets did nearly as well as the S&P. Underperformance was probably due to managers being more market neutral than materially net long.

    Both Lancaster Absolute Return and MAK Capital had great 2022 returns. But Lancaster was initially stung last year in being part of the Odey fund group, which got hit by Crispin Odey’s unfortunate personal conduct. This forced its managers to significantly reduce exposure with the looming loss of it service providers. This locked in some initial declines. MAK Capital, a remarkable long-term performer, took it on the chin because the PM simply didn’t think the pain he profited from in 2022 was anywhere near over.

    The second-half sell-off helped both funds rally. But they both got tagged when the market took off toward the end of the year.

    NilssonHedge/Linus: Any good news to report?

    Eric: Sure. Just look at the table below. These are the ten best performing funds in 2023. They ranged in strategy from emerging markets, statistical arbitrage and relative value, to hedged equity and multistrategy. Funds were as small as $600 million to as large as $43 billion. They are based in towns across the globe from Seattle to Boston, Toronto to Pfaffikon and Abu Dhabi.

    This collection of familiar and little-known managers reflect the diversity and consistency of funds that comprise my survey year in and year out.

    More important, they have delivered consistently decent returns over the medium- and longer-term. Nine of the ten made money in 2022–the worst performer having been down just -4.6% that year. And if you turn to the main tables in the survey, starting on page 7 of the original 2023 report, these funds have generated attractive risk-return profiles with limited correlation to the market since inception.

    NilssonHedge/Linus: Rather than considering managers that are hot, you think it’s more important for investors to look at historical performance?

    Eric: I think that’s the most important metric, so long as the same investment team, strategy, and process are in place. (Again, please turn to pp. 7-11 in the main report.)

    Consistent long-term risk-adjusted returns that are uncorrelated to the market is the purpose of investing in hedge funds. But all hedge fund investments need to be regularly monitored. Things change, and as former US Secretary of Defense once said, “Stuff happens.” Due diligence does not end after an investment is made. It’s just getting started..

    Let me circle back to previously mentioned funds that have lost their place in this year’s survey. Their exclusion doesn’t mean they’re no longer attractive funds. I maintain a strict hurdle for the purpose of maintaining a high bar to help investors target the most consistently performing managers. A decision to sell out of or invest in these funds requires a more in-depth review about what went wrong in 2023, and if underlying problems have been corrected.

    But one shouldn’t give a pass even to just one year of significant underperformance. Such a stumble is one of the most meaningful indicators that something may be off.

    NilssonHedge/Linus: So you would tell alternative investors to remain focused on the industry?

    Eric: Yes. But doing so with great care. Keep in mind that when considering 2022 and 2023 net returns, during a bear and a bull market, we see a different picture.

    In 2022, while the S&P 500 lost more than -18%, the Top 50 gained more than 9%. The market’s total annualized return over the past 24 months was 1.7%; the Top 50 added 7.1%. Over these two years, these select hedge funds delivered stronger returns with far less volatility and drawdown and limited market correlation.

    Since I adopted the current methodology in 2018, this survey has continually produced the same finding when looking at trailing five-year periods and since inception.

    While the composition of the Top 50 does change from year to year, more than two thirds of the funds that make the list qualify for the following year’s survey.

    NilssonHedge/Linus: Thank you Eric, it has been a pleasure having you here again.

    •  

    What have you done for me recently? A look at Hedge Fund Returns over the last 12-months.

    Occasionally it is useful to take one step back and look at longer data trends. Today, we do so, and look at what has happened over the last year using our index data. Except for Crypto Strategies (primarily buy and hold), we have seen reasonable stable results from several hedge fund strategies. Remember we are looking at averages, and specific managers will have results that are deviating from the average result.

    12-month return of the NilssonHedge Indices (March-23 to Feb-24)

    CTAs and Event Driven Strategies have largely underperformed the index cohort with an average result of 3.0%. Traditional strategies range from Risk Premia (5%) to Equity Long Short (7.0%). Asset Allocation is a strategy group driven by long-only allocations to bonds and equities and has done in line with the rebounding markets.

    Correlation of the NilssonHedge indices (Mar-23 to Feb-24)

    While this is a short horizon, it is noteworthy that Risk Premia strategies delivered the most uncorrelated results during the last 12 months. The strategy that was the most correlated to Risk Premia was (Equity) Market Neutral strategies. This suggests that market neutral factor did really well. Here we also see that these strategies managed to retain market neutrality with a low correlation to Equity and Fixed Income (Hedge Fund) strategies.

    Crypto strategies, usually seen as a leveraged Nasdaq position, delivered strangely uncorrelated returns. Perhaps driven by the ETF launches that created their dynamic in terms of flow-driven price increases. This is not the norm that we have seen before. We have seen the beta of Crypto to Equities go from around 2.0 to essentially uncorrelated.

    Despite some rather aggressive position shifts for CTAs, they had above-average correlation to other strategies and markets. This may be partly driven by the overall long-ish exposure to Equities. Bonds saw variable positions.

    We have one or maybe two too many CTA indices, but they allow for a more detailed benchmarking exercise of a strategy group that is broader than what one thinks. We can see some distinctive patterns. The March-23 madness saw difficult markets for the broad trend managers (Systematic Momentum) but the group managed to print a small positive result for the 12 month period. The group that struggled the most was Discretionary Macro managers, followed by Systematic Commodity strategies.

    Equity and Option strategies did the best and printed results of around 10% for the period. This is related to the relatively benign volatility picture that we have seen as of late. The prior stars in the Commodity markets, the Energy traders, had a lackluster period.

    Our index is free and you can access it from https://nilssonhedge.com/my-account/free-data/.

    •  

    CTA – Market Selection

    One of the more recent innovations in the CTA universe is that trend following strategies can be accessed through the ETF format. These securities typically have to make design decisions to fit market makers (i.e. fewer markets are preferred over more markets, slower trading strategies, and a preference for US Futures). There is more day-to-day trading in these than what a typical CTA would expect and therefore these are generally sound design choices. Focus on liquidity and predictability. Obviously, there are also Exchange Traded Funds that have a different market selection.

    In most cases, these are solutions that work well or even better than well as seen through most of 2022 where ETFs outperformed our index due to a higher allocation to short fixed-income futures.

    Except when you have idiosyncratic moves such as the super trend in Cocoa.

    We have only found the Trend Following ETFs with a small exposure to Cocoa and there is a comparatively small exposure. In the first quarter of 2024, this is a decision that has influenced the performance of fully fledged vs liquidity-focused managers.

    To create a fair comparison, we create an average of the largest Managed Futures ETFs and compare that to the volatility-adjusted NilssonHedge CTA Index. Given the short time horizon, we do not adjust for interest rate earnings. We note that the Volatility Adjusted Index has done better than the ETF Composite. Some of this relates to fixed income and currency trading, where managers have been whipsawed. Some of of it relates to the Food of the Goods, Cocoa, which has been a significant contributor to many CTAs.

    When the trend eventually bends, we will who has managed to protect their profits, and who was late through the door. Cocoa is not the most liquid commodity market. Recently the trend has flattening and we have seen Volume and Open Interest decline.

    Using our dispersion measure across CTA strategies, we note that the span (with only two months of return data) is wide, ranging from around 1% to above 8%. We expect the range to be reduced, but this should serve as a reminder that not all strategies are the same. Remember that we are looking at the first and third quartile dispersion and 50% of the the managers are better or worse. Early reporting and other database biases may contribute to the dispersion.

    Picking CTAs is not an easy sport, and in most cases, you need more than one to pick up the risk premia. Market selection, and time frames are short and long-term determinants of the realized performance.

    •  

    Flash Report – Feb 2024

    February was a strong month for most liquid alternatives:

    • CTA generated +4.3% in Feb in what looks like a strong return to prior quarterly patterns with substantial returns in Q4/Q1.
    • Equity Long/Short managed to capitalize on the strong equity markets and printed +2.3%.
    • Market Neutral (+0.5%) had a modest month but has established a nine-month streak of positive returns.
    • Event Driven (+0.2%) was positive but has struggled to keep up the pace with other liquid alternatives.
    • Crypto Managers took the top position with a +36.1% return, an exceptional recovery partially driven by strong flows into the recently launched ETF products.

    For CTAs, long position in equities drove profits and the difficult to trade Cocoa added substantial profits. Cocoa is a commodity that has been historically difficult to trade for a larger number of CTAs, but in 2023/24 that appears to have changed substantially.

    Equity Market Strategies were dominated by the increased odds on an earlier FED interest rate easing cycle as well as the continued strong performance of the AI related companies. Major US indices are trading a new highs.

    The demand for Bitcoin ETFs resulted in a substantial rally in the major crypto currencies. February 2024 was the best month since the frothy days of 2021.

    •  

    Do you know where your CTA is?

    With a an eye toward one of the more epic Public Service Announcement, we dig into recent position changes for Trend Following strategies. CTAs have recently changed their positions rather radically. The increased uncertainty in the Middle East and what looks like a postponement of the start of the FOMC easing cycle has caused positions and correlations to change. In this short post we try to ensure that you know where your CTAs are.

    CTAs are having an unusual good start to the month of February

    CTAs had a really good start to February, with ten positive days out of twelve observations and eight continuous positive trading days from the 1st to the 12th. The string of eight positive days is unusual, we have seen only nine prior observations that was of the same length or longer. The longest run of ten positive days took place just a few days ahead of the 2023 Fixed Income reversal that wrecked havoc to Trend Followers. Other runs have not resulted in subsequent losses.

    We try to keep track of the major exposure through a number of different metrics:

    Sector Exposure Changes. Energy Markets is a new long. USD Dollar Long is being added to aggressively. Equity drifting higher.

    When looking across the sectors that CTAs have exposure to, we note that Long Exposure in fixed income has moderated somewhat as the FED has toned down the chance of an early reduction in the policy rate. This had a strong impact on performance of the US Dollar, and managers added to their long USD positions (shown as a short position above as the Futures are typically long the foreign currency). Energy markets are back in long territory, as the increasing uncertainty surrounding the situation in the Middle East drove prices higher.

    Correlation analysis shows the same pattern.

    Correlation is a lagged measure compared to position data. We note that the Currencies exposure has gone from a solid short US Dollar exposure to a flat correlation. This measure is thus lagging the observation we see in actual position data. Likewise, the bond positions are back to zero correlation which may highlight that non-ETF managers are responding more rapidly to price changes than the ETFs are. Or that our correlation measure is picking up something different than pure fixed income exposure.

    CTA positions as of Friday the 16th of February

    In terms of underlying positions, Equity Futures represent the largest longs and short positions in Euro and Yen represent the largest shorts. Fixed Income positions (re-adjusted to 10-year equivalents) are long except for exposure to the short end of the curve.

    Cocoa Futures are setting price records

    Cocoa has been one of the Futures markets that has caused headlines. The Financial Times recently covered this: “Hedge fund stampede into cocoa futures fuels record price jump“. For the strategies we follow, we do not observe an Cocoa futures and given the relatively low liquidity of the market, do not blame your trend followers, but Discretionary traders and perhaps panicked commercial participants that are scrambling to find supply at a good price. For Trend Follower, Cocoa is a long exposure.

    We appreciate that you follow our website. Please feel free to reach out to discuss your data needs or analytics that we can assist you with.

    •  

    The State of the CTA

    One of the Alternative Data sets that we track is the number of NFA members. The NFA is one of the cornerstones when it comes to ensuring compliance among Futures based strategies. Membership is largely mandatory and you can track the number of registered members here: https://www.nfa.futures.org/registration-membership/membership-and-directories.html. We track these numbers over time.

    From our perspective, this helps us to know how many CTAs we are not tracking. Quite a few as it turns out. Some of the CTAs that are not publishing their numbers are doing so as the CTA part of their strategy is not their main strategy. Or the manager is in a startup or a sunset phase.

    We track these measures over time, which enables us to get a read on how popular Managed Futures/Liquid Hedge Funds are. It is one measure amongst many. Since we started to track these numbers, we have noted an annual shrinkage of approximately 3% across most categories. The only category that has not shrunk, is the number of FCMs. At the same time, we see stable assets under management. This likely indicates that the universe of eligible managers is becoming more concentrated.

    CategoryAnnual Decline (since May-2021)
    Associates-3.2%
    Commodity Pool Operators-1.9%
    Commodity Trading Advisors-3.1%
    Exchanges0%
    Futures Commission Merchants0.7%
    Introducing Brokers-4.7%
    Swap Dealers-0.6%
    Total Membership*-3.0%
    NFA Annual Change

    Part of this is likely structural, change in how Managed Futures strategies are distributed, i.e. the shift towards 40-act and ETFs funds which are sold through platforms rather than introducing brokers. Part of this is also likely related to declining ‘retail/HNW’ interest in CTAs and an anecdotal shift towards Private Assets.

    Number of Introducing Brokers

    Introducing Brokers are to an extent the agents that connect managers with investors. This is the hardest hit category, shrinking by almost 5% per year. This would be a clear indicator if it is easy or hard to sell CTAs to investors.

    The trend for CTA/CPO registration is negative

    In terms of the managers seeking to do business as a CTA or a CPO, the trend is also negative. Going into 2023, there was a small uptick in the number of registered CPOs, but that reversed quickly as 2023 turned out to be a poor year for most CTAs.

    Number of Associates (NFA)

    In January we saw the largest decline in the number of Associates, i.e. individuals working in the Futures Industry. We recorded a decline of 687 individuals no longer seeking to do business.

    •  

    Flash Report – January 2024

    Some preliminary observations are based on early data input from a limited set of Managers (we have only had two proper business days in February, so please allow some additional time).

    • CTAs did well, MTD: +1.4%
    • Equity Long/Short enjoyed strong equity markets: MTD: 1.5%
    • Market Neutral did exceptionally well, MTD: +2.2%. Here we have a near-perfect string of returns.
    • Event Driven had a flat month (MTD: 0%).
    • Crypto lost 2.5% during January. A month where buying the rumor and selling the news dominated the path.

    While most of the correlation remains as expected, correlations (and exposures) have shifted materially for CTAs. We have seen persistent short biases in bonds shifting towards long biases. Remember that CTAs have not had a positive correlation to bonds for more than two years, so this is groundbreaking in terms of correlation expectations. Likewise, the equity correlation is picking up and for the next few months, CTAs will behave somewhat like Risk Parity strategies

    We can verify this by looking at actual ETF positions. We see the same pattern here, rapid exit from Fixed Income shorts and longer in other markets. Perhaps not surprisingly we see the same pattern here.

    Index updates are in progress and new members will be announced on the webpage in due course.

    •  

    Last Chance Tango (or Index)

    We are rapidly approaching the end of January and the cut-off point for our indices. If you would like your strategy to be part of the constituents for 2024, please ensure we get your numbers before the 31st. This is the last call.

    Our indices are free to use (in stark contrast to some of our competitors) and are fully transparent with disclosed constituents. We strive to provide the best estimate of several Hedge Fund strategies, and sub-strategies within each group. This year, we are also publishing additional Crypto Strategies (Market Neutral, Digital Asset Allocators, and Crypto L/S). These indices have been part of the index distribution pack for some time.

    Index Data can be downloaded here (you need to be logged in): https://nilssonhedge.com/my-account/free-data/

    NilssonHedge Indices
    NilssonHedge Indices

    Feel free to explore the different indices, and we are looking forward to including your strategy in the 2024 class.

    •  

    Best’n’Worst 2023 / December 2023

    2023 was a year with a lot of winners. A year where markets turned rapidly a number of times, depending on the tact and tone of the Federal Reserve. Throughout the year, we saw dramatic shifts in market sentiment, with sectors such as technology, healthcare, and renewable energy experiencing significant growth. The Federal Reserve’s nuanced approach to monetary policy continuously shaped investment strategies and market dynamics, creating an environment of both opportunity and volatility. The ‘nuanced’ approach caused problems for CTA with two major shifts in interest rate policies.

    Based on the most recent return data available, we are thrilled to offer a comprehensive overview of the top-performing and bottom-performing strategies for each category, taking into account both monthly and yearly results. Our analysis is derived from proprietary composite data streams that we have diligently compiled. It’s important to note that while we strive for accuracy, there is always the possibility of minor errors in our calculations.

    As a small reminder, if you want your fund to be included in our inidices, we need your December 2023 data before the end of January.

    CTA

    Moddco Capital Associates : MCA  :  32.63% [0.14]<br> Martin Fund Management : Martin Options Program  :  21.35% [92.00]<br> Trident Capital Management : Global Macro Enhanced  :  18.78% [81.00]<br> t24 Capital : Global Macro  :  17.73% [1.00]<br> t24 Capital : TCM Global Index Fund  :  17.73% [25.53]<br> LongTail Alpha : Enhanced Systematic Trend Following  :  -8.29% [436.61]<br> Rational Advisors : Rational/ReSolve Adaptive Asset Allc  :  -10.30% [111.54]<br> Takahe Capital : Spread Momentum Program  :  -14.19% [1.84]<br> Quantitative Investment Management : Global Program 3x  :  -14.42% [55.73]<br> Vigo Capital : Fund  :  -43.78% [0.06]<br> >

    ABR : Enhanced Short Volatility  :  8.50% [1.65]<br> Mulvaney Capital Management : Global Diversified Program  :  -1.17% [299.00]<br> Soaring Pelican : Overnight Advantage  :  3.04% [1.00]<br> WG Wealth Guardian : QT Program  :  8.56% [0.15]<br> Polar Star Management : Polar Star Spectrum Fund Limited  :  -1.87% [98.40]<br> DUNN Capital Management : D'Best Futures Fund  :  -7.30% [50.00]<br> Superfund Capital Management : Green SPC 2x  :  7.65% [1.63]<br> Superfund Capital Management : Green Silver SICAV  :  -1.45% [62.04]<br> Quantitative Investment Management : Global Program 3x  :  -14.42% [55.73]<br> Vigo Capital : Fund  :  -43.78% [0.06]<br> >


    To explore the full list of CTAs and their rankings, including dynamic updates as new data becomes available, we invite you to visit our website at the Link provided.

    Market Neutral

    Seven Capital Management : Fortress Fund  :  4.67% [2.04]<br> Pula Capital Managament : Pula Capital Fund  :  3.73% [14.60]<br> Aenaon Markets : Syncro Equities - Absolute Return  :  2.85% [2.00]<br> Exane : Ceres  :  2.47% [137.75]<br> Exane : Overdrive  :  2.35% [105.75]<br> AQR Capital Management : Equity Market Neutral  :  -3.22% [257.30]<br> Vanguard : Vanguard Market Neutral  :  -3.50% [0.00]<br> Invesco : Invesco All Cap Market Neutral  :  -3.70% [0.00]<br> Federated Hermes : MDT Market Neutral  :  -5.02% [0.00]<br> Crossmark Steward : Equity MN Instl  :  -9.59% [0.00]<br> >

    Blackrock : Asia-Pacific Diversified  :  2.01% [60.80]<br> AQR Capital Management : Equity Market Neutral  :  -3.22% [257.30]<br> Aenaon Markets : Syncro Equities - Absolute Return  :  2.85% [2.00]<br> KLP Kapitalforvaltning AS : KLP Alfa Global Energi  :  1.40% [291.30]<br> Exane : Ceres  :  2.47% [137.75]<br> RAM : Long Short European  :  -1.60% [119.09]<br> Dalton Strategic Partnership : Velox  :  -0.66% [222.91]<br> Crossmark Steward : Equity MN Instl  :  -9.59% [0.00]<br> ECO Advisors : ESG Absolute Return  :  -2.26% [83.86]<br> Wellington : Climate Market Neutral  :  0.00% [28.91]<br> >

    To explore our extensive list of Market Neutral funds and their dynamic rankings, we invite you to visit our website at the link provided here.


    Equity Long/Short

    Pershing square : Pershing Square  :  14.94% [0.00]<br> Prior & Nilsson Fond och Kapitalforvaltning : PriorNilsson Fastighet  :  14.39% [2.80]<br> BNP : Environmental Absolute Return  :  11.35% [19.69]<br> Toews : Toews Tactical Opportunity  :  9.55% [0.00]<br> Sherborne : Investors Guernsey  :  9.17% [0.00]<br> Causeway : Causeway Global Absolute Return Instl  :  -3.92% [0.00]<br> Veritas : China  :  -3.98% [17.64]<br> Fenrir : Fenrir Fund  :  -4.12% [2147.48]<br> UBS : Equity Opportunity  :  -5.30% [65.10]<br> Pensum Asset Management : Global Opportunities  :  -10.67% [14.80]<br> >

    HELSINKI CAPITAL PARTNERS : HCP Focus Fund  :  4.14% [12.00]<br> RiverPark : RiverPark Long/Short Opportunity  :  2.87% [0.00]<br> Caldwell & Orkin : Caldwell & Orkin - Gator Capital L/S  :  7.78% [0.00]<br> Pareto Asset Management AS : Pareto Total  :  -0.44% [884.00]<br> Incline Investment Management : Global Long Short  :  5.35% [6.15]<br> Forester : Forester Value  :  -2.81% [0.00]<br> BNP : Environmental Absolute Return  :  11.35% [19.69]<br> Disciplined Alpha : U.S. Long Short  :  -3.36% [1.64]<br> Veritas : China  :  -3.98% [17.64]<br> Accendo Capital : Accendo Capital  :  3.52% [151.20]<br> >

    To explore our extensive Equity Long/Short list, with dynamic rankings, please see Link

    Event Driven

    Advent Capital Management : Advent Global Partners (ML)  :  6.26% [60.27]<br> Formue Nord : Formue Nord Markedsneutral AS  :  5.33% [33.10]<br> Melqart Asset Management : Opportunities Fund  :  4.50% [1200.00]<br> Blackrock : Event Driven Equity  :  3.41% [2145.38]<br> Neuberger Berman : Distressed Debt Global Shares  :  3.33% [0.00]<br> Merger : Merger  :  -1.84% [0.00]<br> Bantleon : Event Driven Equities  :  -3.24% [21.09]<br> Camelot : Camelot Event Driven  :  -4.50% [0.00]<br> Gabelli : Merger Arb  :  -5.55% [0.00]<br> Gabelli : Merger Plus  :  -5.55% [0.00]<br> >


    Hadron : Alpha Select  :  2.22% [10.44]<br> Portland : Hill Catalyst Driven  :  2.97% [36.90]<br> Hunting Hill Global Capital : Hunting Hill Equity Arbitrage  :  2.72% [0.00]<br> Melqart Asset Management : Opportunities Fund  :  4.50% [1200.00]<br> Formue Nord : Formue Nord Markedsneutral AS  :  5.33% [33.10]<br> Camelot : Camelot Event Driven  :  -4.50% [0.00]<br> Third Point : Third Point  :  2.63% [0.00]<br> Neuberger Berman : Distressed Debt Ordinary Shares  :  0.00% [0.00]<br> Abrax : Merger Arbitrage  :  -0.02% [3.65]<br> Neuberger Berman : Distressed Debt Global Shares  :  3.33% [0.00]<br> >

    To explore our extensive Event-Driven list, with dynamic rankings, please see Link

    Fixed Income


    Nordic Cross Asset Management : Nordic Cross Credit Edge  :  10.46% [5.60]<br> GCP : Asset Backed Income  :  10.06% [0.00]<br> Legg Mason : Western Asset Macro Opp  :  9.21% [1102.62]<br> Blackstone : Loan Financing  :  7.27% [0.00]<br> Vontobel Asset Management : Twenty Four Income Fund  :  6.47% [0.00]<br> Absolute Investment Adv : Convertible Arbitrage  :  -0.81% [0.00]<br> American Beacon : SSI Alternative Inc  :  -0.82% [0.00]<br> RBC GAM : BlueBay Global Sovereign Opportunities Fund (GSOV)  :  -1.72% [378.63]<br> DLD : Convertable Arbitrage  :  -1.77% [74.33]<br> VPC : Specialty Lending Investments  :  -3.49% [0.00]<br> >

    Marble Point : Loan Financing  :  0.00% [0.00]<br> Fair Oaks Capital : Income  :  3.77% [0.00]<br> Danske Bank Asset Management : Danske Invest Fixed Income Global Value  :  2.58% [944.40]<br> Danske Bank Asset Management : Danske Invest Fixed Income Relative Value  :  1.47% [467.50]<br> Moma Advisors : Asgard Fixed Income Fund  :  1.41% [1011.60]<br> Stadion : Trilogy Alternative Return  :  -0.39% [0.00]<br> DLD : Convertable Arbitrage  :  -1.77% [74.33]<br> Numen : Credit (HI)  :  0.30% [97.84]<br> VPC : Specialty Lending Investments  :  -3.49% [0.00]<br> GCP : Asset Backed Income  :  10.06% [0.00]<br> >

    To explore our extensive Fixed Income list, with dynamic rankings, please see Link

    Risk Premia

    Quadriga : Stable Return  :  4.36% [5.18]<br> Neuberger Berman : US Equity Put Write  :  2.39% [572.72]<br> First Private : Private Wealth  :  2.38% [67.90]<br> Loomis Sayles : Alternative Risk Premia  :  1.52% [22.11]<br> Columbia Threadneedle : Columbia Alternative Beta Fund  :  1.46% [587.20]<br> Blackrock : Style Advantage  :  -3.11% [108.24]<br> Allspring : Alternative Risk Premia  :  -3.15% [15.43]<br> AQR Capital Management : Style Premia Alternative  :  -3.44% [896.20]<br> AQR Capital Management : Alternative Risk Premia  :  -4.54% [0.00]<br> AQR Capital Management : Style Premia  :  -4.61% [366.12]<br> >

    Catalyst Funds : Systematic Alpha  :  0.68% [0.00]<br> Neuberger Berman : US Equity Put Write  :  2.39% [572.72]<br> Blackrock : Style Advantage  :  -3.11% [108.24]<br> AQR Capital Management : Style Premia Alternative  :  -3.44% [896.20]<br> Loomis Sayles : Alternative Risk Premia  :  1.52% [22.11]<br> Allspring : Alternative Risk Premia  :  -3.15% [15.43]<br> Allianz Global Investors : Multi Asset Risk Premia  :  -1.05% [58.77]<br> Nordea Asset Management : Nordea 1  Alpha 10 MA Fund  :  -1.38% [5442.00]<br> CdR Capital : CdR Systematic Absolute Return Fund  :  -1.02% [25.00]<br> Nordea Asset Management : Nordea 1  Alpha 15 MA Fund  :  -1.87% [5325.60]<br> >

    To explore our extensive Risk Premia list, with dynamic rankings, please see Link

    Crypto

    Mitja Kokovnik : KICKSTART  :  215.2% [0.00]<br> INVESTMOX : INVESTMOXROLLERCOASTER INVESTMOX Rollercoaster  :  113.7% [0.00]<br> Crypto Asset Management : Strategy One  :  103.0% [0.07]<br> Moon Fund : MOONFUND  :  92.47% [0.00]<br> Low Fees Top Fundamentals : Low Fees Top Fundamentals  :  58.25% [0.00]<br> Vest : Cboe Vest Bitcoin Str Mgd Vol  :  -2.40% [0.00]<br> Asymmetry Active Performance : MAAX  :  -2.68% [0.00]<br> High Reward : HIGHREWARD  :  -5.31% [0.00]<br> Rational Active Allocation : RAAINDEX  :  -9.09% [0.00]<br> Principles Karlheinz Niebuhr Funk : PRINCIPLES  :  -11.27% [0.00]<br> >

    TheCryptoOwl Strategy : THECRYPTOOWL  :  -0.82% [0.00]<br> Princess : BOSTI22  :  17.67% [0.00]<br> Principles Karlheinz Niebuhr Funk : PRINCIPLES  :  -11.27% [0.00]<br> Amigo Feliz II : AMIGOFELIZII  :  29.22% [0.00]<br> coindozer : COINDOZER  :  56.98% [0.00]<br> ANB Investments US : Full Strategy Fund  :  8.32% [15.00]<br> xWin : Interest Rate Trading (xIRT)  :  4.18% [0.00]<br> xWin : Dollar Cost Average (DCA GMX)  :  4.55% [0.00]<br> High Reward : HIGHREWARD  :  -5.31% [0.00]<br> GAMECHANGER FUND : GMFUND GAMECHANGER FUND  :  11.06% [0.00]<br> >

    To explore our extensive Crypto Strategy list, with dynamic rankings, please see Link

    Past performance is not indicative of future results.


    •  

    Database Overview

    We have not done this in some time, but at the beginning of the year, we thought it would be prudent to give a short overview of our Hedge Fund Manager return data set.

    • We cover a large number of Liquid Alternatives, with a focus on Macro, CTA, and Crypto Managers.
    • Throughout 2023, we improved our coverage of Liquid Alternatives in other Hedge Fund strategies.
    • We added more than 100,000 monthly return estimates for managers and more than 2,000 funds including beefing up our graveyard of past CTAs.

    The origin of the Database skewed us in the direction of Futures-based strategies. Including the graveyard, we have coverage of closer to 3.7k CTA and 1k Crypto strategies. There are an additional 1.3k strategies across other liquid Hedge Funds.

    We process more than 14,000 different return streams, consisting of more than half a million database points. We strive to be transparent in terms of survivorship, when a manager starts reporting, and when they are closing. Moreover, we keep track of changes to returns, correlation matching, drift, and updates. We hand classify a large number of strategies to align with our Hedge Fund strategy taxonomy.

    On a snapshot basis, the Monthly Database contains 3469 different managers, representing 6823 different investment strategies. For the current reporting month, 1708 managers have reported returns. For the prior month, we have 2393 live managers.

    This database is among the cheapest on the market, we focus on returns, and do not carry a large amount of qualitative data making it a good match for quant-focused investors. We also provide more assistance for the less quantitatively included investors.

    Over the last three calendar months, we have added 624 new strategies to the database. These may not always be unique new funds, but may also be connected to return streams that already exist in the database.

    So, if you are looking to grow your analytical capabilities, do peer group research, or find new managers to allocate to, feel free to reach out to discuss your data and analytic needs.

    •  

    Daily Indices – Updated

    As part of our annual maintenance cycles, our daily indices were fixed at the end of the year, reflecting available funds that we have daily transparency on. These typically reflect “listed” funds, i.e. UCITS/40 Acts formats. We tend to use an average of several share classes to reflect the actual investment experience.

    You can view each constituent on the individual index page. We do not rule out that we have misclassified a particular strategy, and please let us know if you believe a fund should belong in a different category.

    As a casual reminder, if you want your fund to be part of our Monthly Indices, we need your (preliminary) December 23 return before the end of January 24.

    Our indices are freely available for download (subject to a user account) on this page: https://nilssonhedge.com/my-account/free-data/. We strive to keep our performance indicators public and fully transparent. For advanced users, we can enable API access.

    •  

    Best’n’Worst – Nov 2023

    We do realize that you probably have other things to do today, and first of all we would like to wish all of our clients a Merry Xmas and a Good New Year. 2024 will be an exciting year. At the same time, we woudl like to publish our best and worst list for November 2023. A month with a lot of interesting winners.

    Just a reminder, if you would like to be included in our indices for 2024, please ensure that we have your (preliminary) December numbers at the end of January.

    CTA

    QQFund.com : Alpha Beta Program  :  18.15% [10.23]<br> t24 Capital : Global Macro  :  17.31% [1.00]<br> t24 Capital : TCM Global Index Fund  :  17.31% [25.53]<br> Vivienne Investissement : MACH 3  :  16.80% [14.84]<br> WG Wealth Guardian : Strategic Enhanced Sp500  :  12.98% [0.15]<br> Tudor Investment Corp : Tudor Momentum Fund  :  -11.75% [702.92]<br> DUNN Capital Management : WMA  :  -11.79% [732.00]<br> DUNN Capital Management : D'Best Futures Fund  :  -12.08% [54.00]<br> Maccabi Capital Management : Alpha Futures  :  -15.16% [0.60]<br> Glenhaven Capital : Glenhaven Global II  :  -15.93% [4.56]<br> >

    Mulvaney Capital Management : Global Diversified Program  :  -7.26% [287.00]<br> Polar Star Management : Polar Star Spectrum Fund Limited  :  3.80% [101.60]<br> Soaring Pelican : Overnight Advantage  :  -1.80% [1.00]<br> INSCH Kintore : CrossBorder Kintore XAU/FX  :  2.81% [49.00]<br> Fucius Capital : Volatility Arbitrage  :  4.79% [25.78]<br> GT Capital CTA : Dynamic Trading  :  10.03% [0.18]<br> Superfund Capital Management : Green SPC 1.5x  :  -0.56% [56.08]<br> ESI : Macro LS  :  5.25% [0.70]<br> Quantitative Investment Management : Global Program 3x  :  -2.91% [116.69]<br> Vigo Capital : Fund  :  -11.26% [0.11]<br> >


    To explore the full list of CTAs and their rankings, including dynamic updates as new data becomes available, we invite you to visit our website at the Link provided.

    Market Neutral

    Aphilion : Aphilion SIF  :  4.37% [30.74]<br> Desjardins Global Asset Management : Alt Long Short Global Equity Market ETF  :  4.05% [44.78]<br> Gondor Capital : Gondor Partners Ltd  :  2.10% [11.00]<br> JPMorgan : JPMorgan Research Market Neutral  :  1.97% [0.00]<br> Westwood : Westwood Market Neutral Income Instl  :  1.97% [0.00]<br> PIMCO : PIMCO RAE Fundamental Advantage PLUS  :  -0.54% [0.00]<br> QQM Fund Management : QQM Equity Hedge  :  -0.77% [63.90]<br> Cognios : Cognios Market Neutral Large Cap  :  -0.88% [0.00]<br> First Private : Artellium Evolution  :  -1.50% [111.23]<br> >

    AQR Capital Management : Equity Market Neutral  :  0.44% [291.89]<br> Gondor Capital : Gondor Partners Ltd  :  2.10% [11.00]<br> KLP Kapitalforvaltning AS : KLP Alfa Global Energi  :  0.10% [291.30]<br> Gondor Capital : Gondor Partners LP  :  1.49% [50.00]<br> Gotham : Gotham Neutral  :  1.60% [0.00]<br> Pictet Asset Management : Agora  :  0.74% [0.00]<br> PIMCO : PIMCO RAE Fundamental Advantage PLUS  :  -0.54% [0.00]<br> QQM Fund Management : QQM Equity Hedge  :  -0.77% [63.90]<br> >

    To explore our extensive list of Market Neutral funds and their dynamic rankings, we invite you to visit our website at the link provided here.

    Equity Long/Short

    HELSINKI CAPITAL PARTNERS : HCP Focus Fund  :  12.93% [12.00]<br> RiverPark : RiverPark Long/Short Opportunity  :  12.83% [0.00]<br> Redwood Partners : Redwood  :  12.36% [10.20]<br> Prior & Nilsson Fond och Kapitalforvaltning : PriorNilsson Fastighet  :  10.92% [2.30]<br> ARR Investment Partners : Global LS Strategy  :  9.83% [19.00]<br> Oslo Asset Management : AAM Absolute Return Fund  :  -4.73% [169.00]<br> Pensum Asset Management : Global Opportunities  :  -4.83% [14.80]<br> St Petri Capital : LongShort  :  -4.96% [46.20]<br> Atlant Fonder : Atlant Protect  :  -5.69% [4.90]<br> Accendo Capital : Accendo Capital  :  -5.97% [146.40]<br> >

    HELSINKI CAPITAL PARTNERS : HCP Focus Fund  :  12.93% [12.00]<br> RiverPark : RiverPark Long/Short Opportunity  :  12.83% [0.00]<br> Pareto Asset Management AS : Pareto Total  :  6.00% [895.40]<br> AQR Capital Management : Long-Short Equity  :  3.17% [0.00]<br> Oslo Asset Management : AAM Absolute Return Fund  :  -4.73% [169.00]<br> Norron : Norron Select  :  2.87% [47.10]<br> Paleo Capital : Paleo  :  -2.18% [2.70]<br> Atlant Fonder : Atlant Protect  :  -5.69% [4.90]<br> Proxy P Management : Proxy Renewable LongShort Energy  :  -0.43% [0.00]<br> Accendo Capital : Accendo Capital  :  -5.97% [146.40]<br> >

    To explore our extensive Equity Long/Short list, with dynamic rankings, please see Link

    Event Driven

    Gabelli : Mergers & Acquisitions  :  4.22% [0.00]<br> Third Point : Third Point  :  2.84% [0.00]<br> Water Island : Water Island Diversified Event-Driven  :  2.69% [0.00]<br> Water Island : Arbitrage  :  2.55% [0.00]<br> WCM : Alternatives Event-Driven  :  2.33% [0.00]<br> Neuberger Berman : Distressed Debt Global Shares  :  -6.06% [0.00]<br> Neuberger Berman : Distressed Debt Extended Life Shares  :  -17.35% [0.00]<br> >

    Neuberger Berman : Distressed Debt Extended Life Shares  :  -17.35% [0.00]<br> Driehaus : Event Driven  :  1.53% [0.00]<br> Kellner : Kellner Merger  :  1.43% [0.00]<br> Formue Nord : Fokus  :  1.90% [64.00]<br> SilverPepper : SilverPepper Merger Arbitrage  :  0.81% [0.00]<br> First Private : Systematic Flows  :  1.35% [19.90]<br> Weiss Alternative : Monthly Distribution (Dunham)  :  0.87% [0.00]<br> Neuberger Berman : Distressed Debt Ordinary Shares  :  0.00% [0.00]<br> Third Point : Third Point  :  2.84% [0.00]<br> Neuberger Berman : Distressed Debt Global Shares  :  -6.06% [0.00]<br> >

    To explore our extensive Event-Driven list, with dynamic rankings, please see Link

    Fixed Income

    GCP : Asset Backed Income  :  9.58% [0.00]<br> Marble Point : Loan Financing  :  6.31% [0.00]<br> Lazard : Emerging Markets Debt Blend  :  5.74% [0.00]<br> Lazard : Emerging Markets Total  :  5.40% [84.22]<br> CABA Capital : CABA Hedge  :  4.52% [143.40]<br> Blackstone : Loan Financing  :  -0.45% [0.00]<br> Catella Fondforvaltning : Catella Credit Opportunity  :  -0.61% [51.80]<br> Nordea Asset Management : European Rates Opportunity  :  -2.30% [344.40]<br> Fair Oaks Capital : Income  :  -3.70% [0.00]<br> EJF Investments : Event Driven  :  -11.71% [0.00]<br> >

    Marble Point : Loan Financing  :  6.31% [0.00]<br> Capital Four Management : Capital Four Structured Credit Opportunities Fund  :  2.66% [114.00]<br> Danske Bank Asset Management : Danske Invest Fixed Income Relative Value  :  3.73% [450.20]<br> Danske Bank Asset Management : Danske Invest Fixed Income Global Value  :  2.45% [888.00]<br> Moma Advisors : Asgard Fixed Income Fund  :  2.42% [489.60]<br> BioPharma : BioPharma Credit  :  2.90% [0.00]<br> Blackstone : Loan Financing  :  -0.45% [0.00]<br> VPC : Specialty Lending Investments  :  0.32% [0.00]<br> EJF Investments : Event Driven  :  -11.71% [0.00]<br> GCP : Asset Backed Income  :  9.58% [0.00]<br> >

    To explore our extensive Fixed Income list, with dynamic rankings, please see Link

    Risk Premia

    Catalyst Funds : Systematic Alpha  :  7.39% [0.00]<br> Oxeye Capital Management : Oxeye (BOPS) 5X  :  5.09% [5.38]<br> First Private : Private Wealth  :  2.71% [85.15]<br> Credit Suisse Multialternative : Credit Suisse Multialternative  :  1.97% [0.00]<br> DNB Asset Management : DNB Multi Asset  :  1.46% [69.60]<br> Nordea Asset Management : Nordea 1  Alpha 7 MA Fund  :  -0.73% [681.60]<br> Allspring : Alternative Risk  :  -1.07% [0.00]<br> Nordea Asset Management : Nordea 1  Alpha 10 MA Fund  :  -1.16% [5442.00]<br> AQR Capital Management : Alternative Risk Premia  :  -1.20% [0.00]<br> Nordea Asset Management : Nordea 1  Alpha 15 MA Fund  :  -1.64% [5325.60]<br> >

    Catalyst Funds : Systematic Alpha  :  7.39% [0.00]<br> Oxeye Capital Management : Oxeye (BOPS) 5X  :  5.09% [5.38]<br> AQR Capital Management : Style Premia Alternative  :  0.82% [951.92]<br> AQR Capital Management : Alternative Risk Premia  :  -1.20% [0.00]<br> Danske Bank Asset Management : Global Alternative Opportunities  :  1.37% [489.60]<br> Nordea Asset Management : Nordea 1  Alpha 7 MA Fund  :  -0.73% [681.60]<br> Nordea Asset Management : Nordea 1  Alpha 10 MA Fund  :  -1.16% [5442.00]<br> Nordea Asset Management : Nordea 1  Alpha 15 MA Fund  :  -1.64% [5325.60]<br> >

    To explore our extensive Risk Premia list, with dynamic rankings, please see Link

    Crypto

    Principles Karlheinz Niebuhr Funk : PRINCIPLES  :  103.5% [0.00]<br> Princess : BOSTI22  :  66.08% [0.00]<br> BitcoinTradingStrategy : BITCOINTRADINGSTRATEGY  :  54.13% [0.00]<br> TheCryptoOwl Strategy : THECRYPTOOWL  :  52.85% [0.00]<br> INVESTMOX : INVESTMOXROLLERCOASTER INVESTMOX Rollercoaster  :  41.53% [0.00]<br> P-Hat Fund : P-Hat Fund  :  -2.75% [14.21]<br> Silver Harbor Capital : Silver Harbor Partners  :  -3.54% [1.19]<br> Prophet Priest and King : KINGOFALL  :  -4.84% [0.00]<br> Crypto Asset Management : Strategy One  :  -7.81% [0.04]<br> Utopia Capital : UTOPIADEFI  :  -16.34% [0.00]<br> >

    TheCryptoOwl Strategy : THECRYPTOOWL  :  52.85% [0.00]<br> Princess : BOSTI22  :  66.08% [0.00]<br> Principles Karlheinz Niebuhr Funk : PRINCIPLES  :  103.5% [0.00]<br> Amigo Feliz II : AMIGOFELIZII  :  24.59% [0.00]<br> Hashdex : Nasdaq Bitcoin ETF  :  9.55% [60.88]<br> Bitcoin Crypto Assets : BITCOINCRYPTOASSETSFUND  :  4.75% [0.00]<br> Low Fees Top Fundamentals : Low Fees Top Fundamentals  :  33.11% [0.00]<br> Sustainable Crypto Selection : SCS Sustainable Crypto Selection  :  13.78% [0.00]<br> Prophet Priest and King : KINGOFALL  :  -4.84% [0.00]<br> GAMECHANGER FUND : GMFUND GAMECHANGER FUND  :  -0.14% [0.00]<br> >

    To explore our extensive Crypto Strategy list, with dynamic rankings, please see Link

    Past performance is not indicative of future results.

    •  

    A sneak peak on our CTA ETF project

    As one of our projects for 2023, we had promised to start looking at the CTA ETFs. The nice thing with these, except for costs and pricing transparency, is that they offer full portfolio details. We finally got started and have now started to collect the data to see how they replicate or execute Trend Following strategies.

    As a partial result, we started to collect data from $DBMF and $CTA, because they are offering interesting insights into design choices. There are five CTA ETFs with total assets north of one billion. They do not certainly not dominate the landscape for active trend followers, but they have grown rapidly. ETFD.com has a nifty list with facts and figures.

    Positions in percentage of NAV

    One thing to note is that the decisions made by each advisor are very different. We expect some of them to even out as we get more data. Some of the design decisions strike us as odd, but regardless of that fact, most of the CTA ETFs have done a good job of following fully-fledged managers.

    There is a relatively high position concentration, with the DBMF being the most concentrated portfolio, holding only 13 different Futures. The Simplify Managed Futures ETF has 47 different Futures contracts, but only 14 distinct Futures markets. The positions are spread over various maturities.

    Exposure over three days, adjusted for NAV

    As seen above, the notional exposure is dominated by Fixed Income, especially shorter-term fixed-income instruments (the SOFR contract, representing a 3-month instrument). To make the sector picture somewhat clearer, we can for instance adjust the Fixed Income exposure to "10-year" equivalents. Here we adjust the notional to indicate the rough equivalent of all of the Fixed Income exposure if it would have been a single ten-year bond position.

    While it is still early days, we note that CTAs are reducing the Fixed Income exposure relatively slowly. Some of the funds do not trade frequently. The chart is dynamic on the website but may not be so in email. The chart can be accessed here: https://datawrapper.dwcdn.net/lvd79/1/

    Sector Exposure (% of aggregated NAV)

    CTAs are still mostly short assets. Fixed Income and Equity positions contribute to the recent "whipsaws". The recent rally in Financial Assets has resulted in a small reduction of these positions. As long as the market is in Christmas rally mode, CTAs look to be wrongfooted.

    Thanks for reading, we aim to publish one more update this year and will be on holiday between Christmas and New Year.

    •  

    Hedge Fund Performance – Nov 23

    Surging equity markets helped Hedge Funds to a positive November, bond rally caused headwinds for CTAs, Crypto Managers making a comeback.

    Across our traditional alternative indices, we note that our Risk Parity and Risk Premia have printed the strongest numbers for the year. This is in part driven by the strong performance of the beta, but also the comeback of several option-related strategies (for instance the option writing CTA index is printing strong numbers).

    The strong equity markets (US: 8.9%) helped to lift the average Hedge Fund to strong results. Equity Long/Short was one of the main beneficiaries of the rally and printed a positive return of 3.2%. One of the drivers of the equity rally was softer inflation numbers, which also resulted in a bond rally.

    Equity Long Short is bouncing back in line with equity markets.

    For CTAs, the action was much less favorable in November. Bond markets rallied, which caused short-ish positions for CTAs to incur losses. Our correlation monitoring still indicates a short position for CTA.

    CTA Indices still negatively correlated with bonds

    While the 4th quarter is usually strong for CTAs, this year, there has been a distinctive lack of trends in the last quarter and the trend seems to have continued into December.

    NilssonHedge’s Daily CTA index continues to print lackluster returns

    On the Crypto manager side, we note that the impact of the Bitcoin rally has had a positive effect on directional Crypto Strategies, and while lagging behind the BTC, this is a strong comeback.

    NilssonHedge Crypto Index consists primarily of Directional Traders

    While some distance from its prior peak, the NilssonHedge Crypto Index has recorded a gain of 56% for 2023. But, the average manager is still in a 60% drawdown and needs to generate another 150% to bring back the index to the prior high. The math of drawdowns and high risk investing can be daunting at times.

    Don’t forget to signup for our weekly updates.

    •  

    Top 50 Hedge Funds – 3Q22 Update

    Global Investment Report’s survey of the Top 50 hedge funds is unique industry research. This year is the 20th edition of the survey, which previously has been featured in The Wall Street Journal, Barron’s, FinancialTimes, and Institutional Investor. An exceptional feature of the annual survey: it then tracks the subsequent performance of the select 50 funds while discussing evolving macro and industry trends.

    Inside this issue:

    I had the opportunity to sit down again with Eric Uhlfelder, the author of the report, to discuss his 3rd quarter update. We discussed improving fund returns that outpaced the market during that time, what the peaking of interest rates and tightening bank lending might mean, and the market-topping performance of the Top 50 when looking back over the past two years.

    If you want to skip our chat, you can jump directly to his report by opening this link where there are more insights into recent performance.  And you can learn more about Eric’s work at Global Investment Report.

    Photo credit: Carin Drechsler-Marx

    The Fed

    We seem to be shifting towards a more stable interest rate environment as US rates appear to have peaked. Markets are expecting lower rates in 2024.

    Do you think that means the Fed Put is back in business again and should we expect easier trading conditions for larger hedge funds?

    I think the Fed support of markets was already demonstrated when it recently decided to keep rates steady even after US GDP growth came in at an astonishing rate of 5% with solid employment numbers.   I think its actions had much (but not all) to do with three straight months of market declines, which clipped off more than 8% from the S&P 500.

    So everyone was happy to see rates holding steady, but some were mystified that macroeconomic conditions still appear to demand more restrictive monetary policy.

    On that front, the Fed is continuing to quietly put upward pressure on rates through its robust quantitative tightening ($75 billion per month), which I believe is a good thing.  But over the past month, we’ve seen Treasury yields easing.

    If we’ve learned anything over the past 20 years, it’s the need for the government to keep some powder dry for the next crisis.  And this segues right into your question: will the Fed ease tightening if markets conditions get dicey?

    Save for a market collapse, I don’t think the Fed will cut rates if macro conditions don’t merit it.  Taking some air out of the markets is probably a good thing.  But when you look at the equally-weighted S&P 500, performance is far more modest, which further confuses matters.

    US Elections

    Will next year’s US presidential election impact monetary policy?

    In theory it shouldn’t because the Fed is independent.  That said, I would think the administration would want to get all the support it can muster to help offset the current economic doubts that polls persistently show.  Declining 401Ks and rising unemployment are certainly two things Biden doesn’t want to be facing in the summer of 2024.

    As for easier trading conditions, I think you’re really asking: will there be more discernable trends for managers to ride?  I have no idea.  Hedge funds are being paid handsomely for their investment acumen, so frankly I don’t think that should really matter.  But we know it does.

    Closing the Performance Gap

    Reflecting on your 3Q22 update title that references the underperformance of the Top 50 versus the market (“Closing the Gap…Sort of…”), you’re suggesting some doubts about whether hedge funds—even the most consistently-performing ones—can manage through the current uncertainty? 

    Everyone’s familiar with the adage that the market can stay irrational longer than investors can remain solvent.  That’s what many managers are so fearful of because they see the disconnect between what should be happening with soaring rates and geopolitical risks versus the good times a portion of the market is still enjoying. Institutionalization of the hedge fund industry has imbued caution in the way managers are erring.

    That’s not to say that most of the Top 50 aren’t making money.  They are, and some are doing very well (see table below).  But on average, not so much.  And I’m not sure how as a group this most consistent list of managers can escape the disconnect between what the market is doing and what worries them.

    Source: Global Investment Report, BarclayHedge, and underlying funds.

    Active Management

    Sounds like you’re questioning the merit of active management.

    No.  Last year, the Top 50 collectively outperformed the market by nearly 24 percentage points.  If you add in this year to the calculus, these funds are still outperforming the market over a nearly two-year stretch.  (Note: more than two-thirds of last year’s funds made this year’s list.)

    That sounds like I’m making an excuse for this year’s performance. Not really.  I’m trying to understand it, because selecting time frames for judging performance is always subjective.  But it does put this year’s returns into a broader perspective.

    Investors pay for active hedge fund management to generate more consistent returns with less volatility.  That’s what we’re seeing.  In 2022, the Top 50 managers generated average gains of more than 5.25%.  They are on track to generate about the same level of returns for 2023.

    The S&P lost more than -18% last year and this year through November the market is up more than 20%.  So over this two-year period, investors would’ve done better being in the Top 50 instead of the market.

    Is a recession around the corner?

    The last chart in the quarterly update indicates banks are significantly tightening lending standards and historically that has foreshadowed recessions.  Please explain.

    The Bloomberg Chart (above) you’re referencing, which correlates tighter lending standards and recessions since 1990, currently highlights two factors: one, there’s a time lag between when rates sharply change and are then felt in large pieces of the economy; and two, there’s already evidence of rising default rates across the board, led by auto loans and credit cards, with mortgages following suit.

    Bloomberg reported in early October that, “The latest reading shows that about half of large and mid-sized banks are imposing tougher criteria for commercial and industrial loans . . . The impact is set to be felt in the fourth quarter of this year and when businesses can’t borrow as easily, it usually leads to weaker investment and hiring.”

    One thing that could challenge that forecast is the exponential growth of the shadow banking industry, which includes hedge funds that lend.  Since the financial crisis, many non-bank lending entities have done well filling in where banks have left a void.  But in the recent past, they weren’t faced with firms needing to refinance cheap money with much more expensive loans.  That begs the question: can troubled companies manage with near and at double-digit interest rates?

    Opportunities and Risks for Credit Funds

    How should hedge fund investors handicap that possibility? Will it provide additional opportunities to credit funds?

    The argument smaller fund managers make: they target smaller companies and loans that larger lenders don’t bother with.  Their due diligence seeks value in lending when there’s proof of sufficient cash flow to repay short-term loans, typically less than three years.  These managers also claim to lend only when they are high up the capital structure, i.e., first in line for payment or well positioned to exploit post-bankruptcy reorg equity.

    The real problem for underlying investors is knowing that managers stay within their wheelhouse or will they be tempted by significantly discounted paper and high yields to take on more risk?

    How can investors discern the level of risk taking?

    It’s not easy.  But several things LPs can do is to maintain regular communications with the PM about its lending standards.  Ask to see them.  Make sure they are indeed maintaining first-lien status and that borrowers’ businesses and financial status are well vetted and understood.  

    Then ask how often loans are marked to market and what it takes before a declining valuation actually shows up in a fund’s balance sheet? Also ask managers if their pace of loan restructuring and bankruptcies is increasing or stable.  These are usually good indicators whether or not they are digging themselves into a hole.

    Another telling metric is to see what kind of financial skin the principles of firms doing the borrowing have in their business.   And the same goes for your hedge fund managers.  The more the better.

    This sort of due diligence can help assess risk.  But it assuredly doesn’t eliminate it.  If you can’t get specific information on these points, that’s not a good sign.

    Due Diligence

    You stopped reporting on two funds in your list.  I understand that this is rather unique. Could you please elaborate?

    Correct. This is the first time I’ve stopped reporting on any fund after many years of managing a global hedge fund survey.  And the reasons for doing so are highly unusual, not involving liquidity or gating issues.

    The Ramius Merger Strategy (47th ranked) was launched more than a decade ago.  The fund was one of the most consistently performing within its strategy.  Its net annualized returns over the past five years and since inception were around 7%. 

    I profiled Ramius last year.  It was part of Cowen Capital, which managed nearly $15 billion in assets.  But earlier this year, TD Bank closed on its purchase of the asset manager.  According to sources inside the fund, the bank oddly decided to close down the fund due to the lack of investor interest.

    Leibniz EMOTION (7th-ranked) returns will no longer be posted because a recent disclosure indicates the fund has been reporting “simulated” (re pro forma) numbers.

    This was the first year I included this statistical arbitrage fund in the survey.  I spoke with the manager.  The fund reports to various reputable databases. It has a reasonable presentation document and DDQ, where the manager reveals an impressive professional pedigree.  Early this year, With Intelligence published an article that clearly stated the Leibniz Group was managing more than $1.5 billion and the fund itself had been linked with many well-established asset managers, including Soros Fund Management and Schonfeld Strategic Advisors.  And the manager was profiled in the Hedge Fund Journal, as one of the Fifty Rising Stars (Tomorrow’s Titans 2021 page 23). 

    I’m not questioning whether the performance numbers I cited were accurate. But what I’ve just learned made it unclear if they reflect actual investor returns. Footnotes in a recently seen Leibniz document state simulated numbers were mixed into the results.

    As of this interview, Leibniz has not responded to my request for further clarity.

    Bottom line: Both examples highlight the need for all potential investors to perform their own in depth due diligence before even considering investing.  The value of this survey is to reveal a breadth of the most consistently performing managers. But I always emphasize my work is but a starting point to help narrow the search for funds that may be worth a deeper diver.

    Thanks, Eric, this has been a really interesting discussion. A version of the quarterly report and main survey (not for commercial distribution) can be downloaded here.

    •  
    ❌