❌

Reading view

Here's Why Skyworks' Qorvo Deal Is a Buy (and Why It Isn't)

Skyworks Solutions (NASDAQ: SWKS) could emerge from its combination with Qorvo with greater scale, broader markets, and a significantly different earnings profile. The opportunity hinges on whether management can capture $500 million in planned synergies, expand beyond smartphones, and manage the additional debt.

Stock prices used were the market prices of Sept. 17, 2026. The video was published on Sept. 30, 2026.

Missed Nvidia in 2009? This Rare Signal Is Flashing Again. In 2009, a "Double Down" signal flashed for a little-known chipmaker called Nvidia. For the first time in years, that same "Total Conviction" signal is flashing for a company 1/100th the size of Nvidia. Continue »

Should you buy stock in Skyworks Solutions right now?

Before you buy stock in Skyworks Solutions, consider this:

The Motley Fool Stock Advisor analyst team just identified what they believe are the 10 best stocks for investors to buy now… and Skyworks Solutions wasn’t one of them. The 10 stocks that made the cut could produce monster returns in the coming years.

Consider when Netflix made this list on December 17, 2004... if you invested $1,000 at the time of our recommendation, you’d have $375,240!* Or when Nvidia made this list on April 15, 2005... if you invested $1,000 at the time of our recommendation, you’d have $1,403,292!*

Now, it’s worth noting Stock Advisor’s total average return is 932% — a market-crushing outperformance compared to 211% for the S&P 500. Don't miss the latest top 10 list, available with Stock Advisor, and join an investing community built by individual investors for individual investors.

See the 10 stocks »

*Stock Advisor returns as of October 1, 2026.

Rick Orford has no position in any of the stocks mentioned. The Motley Fool has no position in any of the stocks mentioned. The Motley Fool has a disclosure policy. Rick Orford is an affiliate of The Motley Fool and may be compensated for promoting its services. If you choose to subscribe through their link, they will earn some extra money that supports their channel. Their opinions remain their own and are unaffected by The Motley Fool.

  •  

If a Bear Market Is Coming, History Says the Most Successful Investors All Share This 1 Habit

Key Points

  • The S&P 500 has climbed 12% in 2026, but the markets still face headwinds, from inflation to surging debt.

  • Bear markets, where stocks drop 20% from recent highs, can make investors feel forced to panic-sell.

  • History shows investors can't time the market, and some of the best days for stocks occur during bear markets.

The S&P 500 (SNPINDEX: ^GSPC) is up 12% so far in 2026, but that doesn't mean investors have forgotten about the headwinds the stock market faces. Stubborn inflation, rising interest rates to combat it, and $40 trillion in debt are all challenges the U.S. economy is trying to navigate.

That's not saying that stocks in general can't keep climbing, but with the S&P 500 slightly down over the last month, the reality of those challenges may be sinking in. And the worry is always that if the S&P 500 rally derails, a bear market may loom, clawing back those gains as stock prices fall 20% from recent highs.

Missed Nvidia in 2009? This Rare Signal Is Flashing Again. In 2009, a "Double Down" signal flashed for a little-known chipmaker called Nvidia. For the first time in years, that same "Total Conviction" signal is flashing for a company 1/100th the size of Nvidia. Continue »

History, however, suggests that there's one habit successful investors can follow, even during a full-fledged bear market.

A bear and a bull facing off.

Image source: Getty Images.

The surprising truth about bear markets

Surprisingly enough, some of the best days to invest are when the markets are in a free-for-all. According to Hartford Funds, from 1996 through 2025, 48% of the best days to invest in the S&P 500 were during bear markets. The second-best time to invest was during the first two months of a bull market (28% of the best days to invest), while the third-best time to invest was during the rest of a bull market (24% of the best days to invest).

Moreover, according to the data, missing the best days for the S&P 500 can actually cost you money. For example, a hypothetical $10,000 investment in the S&P 500 in 1996 would have been worth $192,167 by the end of 2025. But for anyone who had sold and missed just the 10 best days of the market during all that time, that investment return drops by 56%, turning into $85,490. It continues to get worse from there: Missing the 20 best days yields just $49,551, and missing the 30 best days yields only $31,123.

The investable lesson

The most important habit for successful investing is that, no matter how tempting it may be to sell a stock during a bear market, it's almost always better to hold the shares. But another lesson is that more aggressive investors may want to consider buying additional shares of a company during this time. Bear markets won't last forever; the average length is 9.6 months. In comparison, bull markets tend to last 2.7 years. Also, while stocks lose an average of 35% during a bear market, they also gain an average of 112% during a bull market.

While seeing a stock lose 35% of its value in less than a year can feel gut-wrenching, having a portfolio of high-conviction positions already established can help offset knee-jerk reactions. Not only will an investor want to hold on to shares of those companies because they already believe in the wealth they could build over the long term, but they'd also want to buy more shares to take advantage of price drops.

Should you buy stock in S&P 500 Index right now?

Before you buy stock in S&P 500 Index, consider this:

The Motley Fool Stock Advisor analyst team just identified what they believe are the 10 best stocks for investors to buy now… and S&P 500 Index wasn’t one of them. The 10 stocks that made the cut could produce monster returns in the coming years.

Consider when Netflix made this list on December 17, 2004... if you invested $1,000 at the time of our recommendation, you’d have $375,240!* Or when Nvidia made this list on April 15, 2005... if you invested $1,000 at the time of our recommendation, you’d have $1,403,292!*

Now, it’s worth noting Stock Advisor’s total average return is 932% — a market-crushing outperformance compared to 211% for the S&P 500. Don't miss the latest top 10 list, available with Stock Advisor, and join an investing community built by individual investors for individual investors.

See the 10 stocks »

*Stock Advisor returns as of October 1, 2026.

Jack Delaney has no position in any of the stocks mentioned. The Motley Fool has no position in any of the stocks mentioned. The Motley Fool has a disclosure policy.

  •  

This AI Stock Is Trading Near Record Highs. Is It Too Late to Buy?

Key Points

  • Amphenol's stock is about 3% below its all-time high after gaining 311.6% in the last three years.

  • The company's connectors and cables link AI processors, and its IT datacom business is roughly four times its size from two years ago.

  • Orders of $10.7 billion topped sales of $8.8 billion, resulting in a healthy book-to-bill ratio of 1.23.

Amphenol (NYSE: APH) makes connectors, cables, and sensors. Nobody has ever put a cable assembly on a magazine cover. I mean, aside from very niche industry mags. Yet, on Oct. 1, the stock sits 3.2% below a recent all-time high, and the AI boom is a big reason.

A run like that raises the obvious question about whether the easy money is gone. The business results suggest it isn't, at least not yet.

Missed AI’s "Act 1"? Act 2 Could Be 15x Bigger. Most investors think they missed the AI boat because they didn't buy Nvidia in 2005. But according to our analysts, we’re only at the end of "Act 1"—the R&D phase. "Act 2" is the global rollout. Continue »

Two hands pushing together coaxial cable connectors.

Image source: Getty Images.

Plumbing for the AI boom

The company holds the least glamorous seat at the AI party: the one that connects the processors. CEO Adam Norwitt calls interconnect the central nervous system of AI, and the logic is hard to dispute. A server rack that sells for $3 million is worth very little if the connectors never arrive. Amphenol's IT datacom business is roughly four times its size two years ago.

Start with the second quarter. Sales of $8.8 billion rose 55% year over year. Organic growth was 30%. Adjusted earnings per share of $1.35 jumped 67%. Orders reached $10.7 billion, a book-to-bill ratio of 1.23, meaning customers ordered 23% more than Amphenol shipped. That gap is the closest thing to a forward indicator in the report, and it points up.

Loud numbers, quiet CEO

Norwitt avoids the spotlight. At a recent Citi conference, he told the crowd that he doesn't do interviews and that the company announces none of its customer commitments, including long-term non-cancelable orders.

But he doesn't have to say much.

Quarterly orders of $10.7 billion against sales of $8.8 billion say plenty without an adrenaline-packed press release. That makes a nice change in an AI sector that often seems to run on video clips, social media posts, and headlines.

Slow and steady beats the hotshots

Here's the part that should interest anyone worried about being late. Amphenol is up 27.9% this year. Respectable, but well behind the company's closest rivals. Corning (NYSE: GLW) gained 81.1%, Flex (NASDAQ: FLEX) stock rose 85.9%, and Littelfuse (NASDAQ: LFUS) posted a 71.7% year-to-date run.

And the recent trends have been in Amphenol's favor. Over the past quarter, Amphenol gained 4.9% while Flex fell 18% and Corning dropped 19.4%. Tech giants are still planning and building massive AI data centers, but there's public pushback ahead of the midterm elections. The AI-adjacent crowd has been running harder and wobbling more, while Amphenol is holding steady.

Cheaper than the neighbors

The profits aren't thin, either. Operating margin is 28.1%, the highest in the peer group. The CommScope purchase, at $10.5 billion, is now expected to deliver $4.6 billion in sales this year, up from an earlier forecast of $4.1 billion.

At 26.4 times forward earnings, the stock trades at a lower multiple than Corning (36.6) and Cognex (30.6). The PEG ratio of 0.9 suggests the market isn't fully valuing growth. The dividend yield of 0.6% is a rounding error, and short interest is only 1.3% of the float. Few investors are betting against Amphenol's rising stock.

So, is it too late?

None of this makes Amphenol's stock a bargain, and 311.6% over three years has a way of making a new buyer feel tardy. Moreover, investors are currently paying an AI multiple for a mostly old-school product catalog. Still, the third-quarter guide calls for sales growth of 50% to 52%.

Is it too late? For the first quadrupling in three years, sure. The next leg is a separate question, and the bulging order book is making a decent bull case.

Should you buy stock in Amphenol right now?

Before you buy stock in Amphenol, consider this:

The Motley Fool Stock Advisor analyst team just identified what they believe are the 10 best stocks for investors to buy now… and Amphenol wasn’t one of them. The 10 stocks that made the cut could produce monster returns in the coming years.

Consider when Netflix made this list on December 17, 2004... if you invested $1,000 at the time of our recommendation, you’d have $375,240!* Or when Nvidia made this list on April 15, 2005... if you invested $1,000 at the time of our recommendation, you’d have $1,403,292!*

Now, it’s worth noting Stock Advisor’s total average return is 932% — a market-crushing outperformance compared to 211% for the S&P 500. Don't miss the latest top 10 list, available with Stock Advisor, and join an investing community built by individual investors for individual investors.

See the 10 stocks »

*Stock Advisor returns as of October 1, 2026.

Anders Bylund has no position in any of the stocks mentioned. The Motley Fool has positions in and recommends Amphenol, Cognex, and Corning. The Motley Fool recommends Flex. The Motley Fool has a disclosure policy.

  •  

ASML vs. SK Hynix: What Revenue Trends Reveal to Investors About These Artificial Intelligence Companies

Key Points

  • SK Hynix currently generates a higher overall revenue total at the end of each period than ASML Holding.

  • Throughout the course of the last eight quarters, ASML maintained steady quarter-over-quarter revenue totals, while SK Hynix demonstrated a distinct quarter-over-quarter acceleration in its reported results.

  • As these financial patterns continue to develop, investors should watch whether the existing revenue gap between the two companies continues to widen or begins to narrow in upcoming quarters.

ASML Holding: Steady and Gradual Quarterly Revenue Growth

ASML Holding (NASDAQ:ASML) generates its revenue primarily by supplying advanced extreme ultraviolet lithography equipment, specialized wafer inspection systems, and related computational control software to integrated circuit manufacturers operating in locations across the globe.

It recently announced plans to increase manufacturing capacity for specific immersion systems by 30%, launched a collaborative industry initiative with multiple foundries for larger photomasks, and initiated construction on an additional corporate engineering campus in the Netherlands.

SK Hynix: Rapid and Sustained Quarterly Revenue Expansion

SK Hynix (NASDAQ:SKHY) earns its revenue primarily by designing, producing, and selling a wide variety of advanced memory semiconductors, including various customized flash memory products tailored specifically for complex technical computing and mobile applications.

It recently completed an oversubscribed initial listing of its American Depositary Receipts on the Nasdaq exchange, reassigned three senior vice chairpersons to oversee global strategy, and simultaneously faced a class action antitrust lawsuit regarding component pricing.

Why Revenue Matters for Investors

Revenue provides individual investors with a transparent, direct baseline measurement of all incoming capital over a specific timeframe before any operational business expenses are formally deducted. Closely tracking this top-line financial figure helps investors understand the total scale and growth trajectory of a business.

ASML Holding vs. SK Hynix Revenue chart

Quarterly Revenue for ASML Holding and SK Hynix

Calendar quarterASML Holding RevenueSK Hynix Revenue
Q3 2024$8.2 billion (quarter ended Sept. 30, 2024)$12.9 billion (quarter ended Sept. 30, 2024)
Q4 2024$9.9 billion (quarter ended Dec. 31, 2024)$14.1 billion (quarter ended Dec. 31, 2024)
Q1 2025$8.2 billion (quarter ended March 31, 2025)$12.1 billion (quarter ended March 31, 2025)
Q2 2025$8.7 billion (quarter ended June 30, 2025)$15.8 billion (quarter ended June 30, 2025)
Q3 2025$8.8 billion (quarter ended Sept. 30, 2025)$17.6 billion (quarter ended Sept. 30, 2025)
Q4 2025$11.3 billion (quarter ended Dec. 31, 2025)$22.6 billion (quarter ended Dec. 31, 2025)
Q1 2026$10.3 billion (quarter ended March 31, 2026)$35.7 billion (quarter ended March 31, 2026)
Q2 2026$10.8 billion (quarter ended June 30, 2026)$52.6 billion (quarter ended June 30, 2026)

Data source: Financial Modeling Prep. ASML Holding's figures are converted from euros to U.S. dollars. SK Hynix's figures are converted from South Korean won to U.S. dollars. Data as of Sept. 25, 2026.

Foolish Take

For investors interested in gaining exposure to the artificial intelligence boom, ASML and SK Hynix are two great companies to invest in. Both provide key products to the AI industry, and as a result, are seeing year-over-year revenue growth.

That said, examining their sales trends provides investors with revealing insights. ASML's extreme ultraviolet (EUV) lithography equipment is essential for semiconductor manufacturers to produce AI chips, giving the company a legal monopoly since competitors have not been entirely successful in providing rival EUV tools. However, the complex machinery takes time to build, resulting in a slow revenue ramp for ASML.

In contrast, SK Hynix manufactures high-bandwidth memory (HBM) products, which can be produced faster. The company's massive sales growth in recent quarters is evidence that tech giants are pouring funds into memory components right now. The demand is so great, it's led to rising memory prices, which further fuels SK Hynix's spectacular sales ascent.

Don’t miss this second chance at a potentially lucrative opportunity

Ever feel like you missed the boat in buying the most successful stocks? Then you’ll want to hear this.

On rare occasions, our expert team of analysts issues a “Double Down” stock recommendation for companies that they think are about to pop. If you’re worried you’ve already missed your chance to invest, now is the best time to buy before it’s too late. And the numbers speak for themselves:

  • Nvidia: if you invested $1,000 when we doubled down in 2009, you’d have $593,741!*
  • Apple: if you invested $1,000 when we doubled down in 2008, you’d have $63,526!*
  • Netflix: if you invested $1,000 when we doubled down in 2004, you’d have $375,240!*

Right now, we’re issuing “Double Down” alerts for three incredible companies, available when you join Stock Advisor, and there may not be another chance like this anytime soon.

See the 3 stocks »

*Stock Advisor returns as of October 1, 2026.

Robert Izquierdo has positions in ASML. The Motley Fool has positions in and recommends ASML. The Motley Fool has a disclosure policy.

  •  

Nvidia Authorizes a Record $150 Billion in Stock Buybacks. The Real Prize Is Where the Rest of Its Cash Is Going.

Key Points

  • Innovation is sewn into the fabric of Nvidia’s company culture.

  • Nvidia is generating so much cash that it can afford to aggressively invest in next-generation computing platforms and return capital to shareholders.

  • Nvidia's AI roadmap extends far beyond data center compute.

Nvidia's (NASDAQ: NVDA) Board of Directors authorized a $150 billon increase to its share repurchase program, bringing the total to $235 billion. The announcement was the largest single stock buyback authorization in U.S. corporate history.

For context, Toyota Motor -- which sells more cars than any other manufacturer in the world -- has a market cap of $223 billion.

Missed AI’s "Act 1"? Act 2 Could Be 15x Bigger. Most investors think they missed the AI boat because they didn't buy Nvidia in 2005. But according to our analysts, we’re only at the end of "Act 1"—the R&D phase. "Act 2" is the global rollout. Continue »

Here's why Nvidia's buyback program is great news for investors, and why the bigger story is what Nvidia is doing with the rest of its cash.

Nvidia’s logo on a grey sign in front of Nvidia’s headquarters.

Image source: Nvidia.

High margin revenue growth fuels free cash flow

Nvidia's free cash flow (FCF) has exploded in recent years due to its rapid revenue growth and high margins. Nvidia returned 60% of FCF to investors through buybacks and dividends in the first half of fiscal 2027, and has a long-term target of returning at least 50% of FCF.

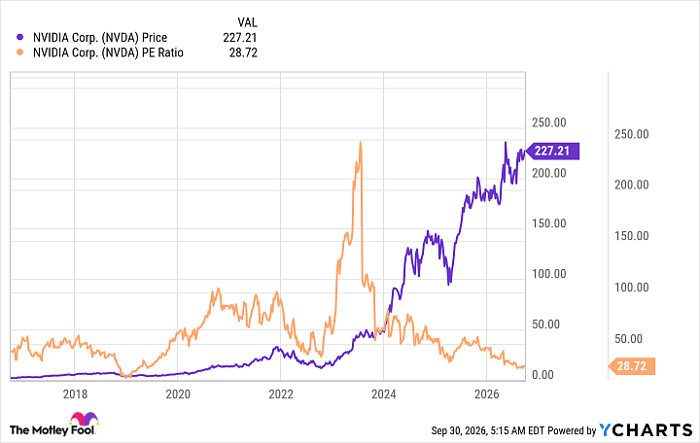
NVDA Revenue (TTM) Chart

NVDA Revenue (TTM) data by YCharts

Nvidia is converting around 75 cents of every dollar in sales into gross profit, 64 cents into bottom-line after-tax profit, and around 42 cents into FCF. Nvidia's growth and high margins are partly due to insatiable demand for artificial intelligence (AI) compute -- which is benefiting the broader semiconductor industry. But Nvidia also has a highly effective product development pipeline that has produced three new compute platforms in four years. These aren't marginal improvements either.

Its Grace Blackwell platform, announced in March 2024, was magnitudes better than Hopper, launched in March 2022. In January 2026, Nvidia announced its Vera Rubin platform. Compared to Blackwell, Rubin delivers a 90% reduction in inference costs and a 75% reduction in the number of graphics processing units (GPUs) needed for training.

Nvidia has been the poster child of the AI boom since OpenAI released ChatGPT to the public in November 2022. But it's what the company has developed since that should be getting more attention.

Nvidia began shipping Rubin in August and already expects it to account for 20% of data center revenue in the third quarter of fiscal 2027, which it will report in November. Demand for Rubin is so massive that Nvidia is guiding for 70% year-over-year revenue growth in fiscal 2028. Higher memory chip costs have yet to make a substantial dent in Nvidia's gross margins -- a testament to its pricing power.

Rubin's efficiency is not solely due to Nvidia's making a more powerful GPU. It's also because Rubin comes in a rack-scale offering that includes multiple chips and networking components, which Nvidia calls extreme co-design. This co-design allows Nvidia to control a larger share of the data center addressable market, and in turn, offers significant performance improvements for its customers that justify the high price tag. The Nvidia NVL72 is a plug-and-play offering for AI data centers that features seven new chip designs, including 72 Rubin GPUs and 36 Vera central processing units.

Innovating at the speed of light

Nvidia's record buyback authorization is a product of its impeccable profitability and sheer size. It is not, however, a sign that the company is transitioning into a stodgy, low-to-moderate growth company.

In his book The Nvidia Way, author Tae Kim discusses how Nvidia's Speed of Light concept was an integral reason the company was able to endure an intensely competitive landscape in its early years. The concept is rooted in pushing the limits of what Nvidia's talent and resources can deliver under expedited timelines, rather than using prior accomplishments or competitors' actions as a yardstick.

In the 1990s, other chip companies would operate on a one to two-year product development cycle, which left them vulnerable to riding a big hit only to see their market share erode if their next launch failed. Nvidia fell into the same trap and almost went bankrupt multiple times. Nvidia then condensed its product launches to six months as a way to keep cash flow coming and avoid taking its competitive moat for granted.

Nvidia CEO Jensen Huang embodies Nvidia's relentless work culture to this day. Nvidia could have easily ridden the coattails of Blackwell for longer and kept Rubin in its back pocket, but Nvidia doesn't behave like the world's most valuable company. It behaves like a company that doesn't take its industry-leading position for granted.

Nvidia also recognizes that its heavy reliance on a handful of hyperscale customers leaves it vulnerable to cyclical spending pullbacks. This is why evolving beyond one-off chip sales to rack-scale data center solutions that deliver the greatest cost efficiency for its customers is so important. On top of that, Nvidia is making compute more accessible and transferable to a non-hyperscale customer base by partnering with financial institutions to create an investable AI infrastructure asset class. Third-party capital will fund the build-out of AI infrastructure that can be sold to AI labs, AI start-ups, cloud providers, and enterprises seeking the flexibility to use varying levels of compute without the risks and capital commitments of building it themselves.

Nvidia remains a high-octane growth stock

A bloated buyback budget can sometimes indicate a company is out of good ideas and looking for ways to appease shareholders. But Nvidia's record authorization is simply a product of how profitable its business has become and of management's confidence in its roadmap to generate even higher FCF going forward as AI compute demand increases.

Nvidia's buyback announcement does not mean the company is taking its foot off the gas when it comes to AI innovation. Nvidia's culture still prioritizes organic growth over everything else. There's every reason to believe that will continue, given Nvidia's optimism about compute demand for agentic AI and physical AI, such as self-driving cars and robotics.

Should you buy stock in Nvidia right now?

Before you buy stock in Nvidia, consider this:

The Motley Fool Stock Advisor analyst team just identified what they believe are the 10 best stocks for investors to buy now… and Nvidia wasn’t one of them. The 10 stocks that made the cut could produce monster returns in the coming years.

Consider when Netflix made this list on December 17, 2004... if you invested $1,000 at the time of our recommendation, you’d have $375,240!* Or when Nvidia made this list on April 15, 2005... if you invested $1,000 at the time of our recommendation, you’d have $1,403,292!*

Now, it’s worth noting Stock Advisor’s total average return is 932% — a market-crushing outperformance compared to 211% for the S&P 500. Don't miss the latest top 10 list, available with Stock Advisor, and join an investing community built by individual investors for individual investors.

See the 10 stocks »

*Stock Advisor returns as of October 1, 2026.

Daniel Foelber has positions in Nvidia. The Motley Fool has positions in and recommends Nvidia. The Motley Fool has a disclosure policy.

  •  

Applied Materials vs. AMD: Which AI Semiconductor Stock Is a Better Buy in 2026?

Key Points

  • Applied Materials supplies manufacturing equipment and related services to the companies that fabricate semiconductors.

  • Advanced Micro Devices grew revenue about 34% in 2025, with gains in both its data center segment and its client and gaming segment.

  • Net margin at Applied Materials was about 24.7% in fiscal 2025, which ended in October 2025, roughly double the 12.5% that AMD posted.

Choosing between Applied Materials (NASDAQ:AMAT) and Advanced Micro Devices (NASDAQ:AMD) means weighing a highly profitable chip equipment supplier against a faster-growing chip designer.

Applied Materials makes the equipment that chip factories use to produce semiconductors. AMD designs processors for products ranging from game consoles to large data centers and relies on outside foundries to manufacture them. Both sell into the demand that has drawn investors to artificial intelligence (AI) stocks, but they offer very different risk and reward profiles.

The case for Applied Materials

Alongside its manufacturing equipment, Applied Materials sells related services and factory automation software. The company occupies a highly technical niche among semiconductor stocks, selling to the large manufacturers that fabricate chips. That customer base is concentrated, and two customers accounted for approximately 19% and 15% of net revenue in fiscal 2025, which ended in October 2025.

In fiscal 2025, revenue reached nearly $28.4 billion, up about 4.4% from the previous year. The company reported net income of roughly $7.0 billion for the same period. Revenue and pre-tax income both rose, but the net margin, which measures how much profit is kept from every dollar of sales, declined to approximately 24.7% from 26.4% as the provision for income taxes more than doubled.

As of Oct. 26, 2025, the debt-to-equity ratio was roughly 0.3x. That ratio compares total debt with shareholders' equity, and a figure this low points to a conservative approach to borrowing. The current ratio, which compares short-term assets to short-term liabilities, was approximately 2.6x. Free cash flow, which the company calculates as operating cash flow minus capital expenditures, totaled nearly $5.7 billion for the fiscal year.

The case for Advanced Micro Devices

AMD designs processors for data centers and personal computers, as well as the semi-custom chips inside game consoles. A small number of customers account for a large share of its revenue, and cloud and hyperscale data center operators buy a substantial portion of its data center products.

In October 2025, AMD signed an agreement with OpenAI to deploy 6 gigawatts of its graphics processing units (GPUs), and in February 2026 it announced a similar agreement with Meta Platforms (NASDAQ:META) covering up to 6 gigawatts. Its chips also power the PlayStation 5 from Sony (NYSE:SONY) and the Xbox Series S and X consoles from Microsoft (NASDAQ:MSFT).

In 2025, revenue reached about $34.6 billion, up about 34.3% from the previous year. Growth came from the data center segment, where revenue rose 32%, and from the client and gaming segment, where it rose 51%. Net income for the period was roughly $4.3 billion, with a net margin of about 12.5%, held down in part by research and development spending, which rose about 25% to $8.1 billion.

As of Dec. 27, 2025, the debt-to-equity ratio was approximately 0.05x on a total debt-to-shareholders' equity basis. The current ratio stood at nearly 2.9x, indicating ample capacity to cover short-term obligations. Free cash flow for the year was roughly $5.5 billion under AMD's own definition, which starts with operating cash flow from continuing operations and subtracts capital expenditures.

That measure excludes about $1.2 billion of operating cash flow from discontinued operations, the ZT Systems manufacturing business that AMD sold in October 2025. Stock-based compensation of about $1.6 billion equaled roughly 25% of operating cash flow from continuing operations. Because it is a non-cash expense added back to cash flow in the cash flow statement, it increases reported cash generation.

Risk profile comparison

Applied Materials faces significant risks from evolving export controls and trade policies, particularly those involving China, which accounted for about 30% of its revenue in fiscal 2025. On Feb. 11, 2026, the company agreed to pay $252.5 million to the U.S. Commerce Department to resolve allegations that certain customer shipments to China between November 2020 and July 2022 did not comply with export regulations.

The Justice Department and the Securities and Exchange Commission closed their related investigations without action. The semiconductor industry has also historically been cyclical. The company says AI-related demand is difficult to forecast, and shifting demand can pressure its margins and cash flow.

AMD sells into highly competitive markets against rivals such as Nvidia (NASDAQ:NVDA) and Intel (NASDAQ:INTC). The company relies on third parties to manufacture its chips, including Taiwan Semiconductor Manufacturing (NYSE:TSM) and GlobalFoundries (NASDAQ:GFS), so any disruption at these foundries would directly affect its ability to deliver products. U.S. export controls on its Instinct MI308 data center GPUs also restrict sales to China, and AMD's 2025 results included approximately $440 million of net inventory and related charges tied to those controls.

Dilution is another risk for AMD shareholders. The company has issued warrants to OpenAI and Meta Platforms, each covering up to 160 million shares at an exercise price of $0.01 per share, that vest as the customers reach GPU purchase milestones and AMD's stock reaches specified price targets.

Together, the warrants equal about 20% of the roughly 1.63 billion shares outstanding as of late July 2026, and none had vested as of June 27, 2026. On Sept. 28, 2026, AMD also announced an agreement to acquire World Labs, an AI model and research lab, in an all-stock transaction valued at approximately $8.2 billion.

Valuation comparison

Applied Materials carries the lower forward price-to-earnings (P/E) and price-to-sales (P/S) ratios, and AMD grew revenue much faster in 2025.

MetricApplied MaterialsAdvanced Micro Devices
Forward P/E23.4x39.5x
P/S ratio11.9x24.2x

Valuation metrics include sourcing from Financial Modeling Prep (FMP) and may differ from other data providers.

Which stock would I buy in 2026?

Applied Materials looks like the better buy to me, though I'd treat it as a position to add to over time. Chip equipment demand moves in cycles, and the stock has already more than doubled in the past year.

What tips the comparison is how each business has trended since the full-year figures above. Applied Materials reported record revenue for its fiscal third quarter on Aug. 13, 2026. The midpoint of management's guidance for the quarter ending in October implies sales growth of about 50% from a year earlier, roughly twice the pace it posted just a year ago. AMD's revenue also grew about 50% in its second quarter, but its Aug. 4 outlook points to somewhat slower growth in the third quarter. The growth gap that supports AMD's richer multiples appears to be narrowing.

AMD shareholders also face a dilution question that Applied Materials shareholders don't. The warrants from OpenAI and Meta Platforms could add about a fifth to the share count if every milestone is met, and the pending World Labs purchase would be paid for in stock. The warrants are tied to large chip orders, so the trade may prove worthwhile, but it raises the bar for per-share results.

None of this makes AMD a stock to avoid. It is the bigger business with more direct exposure to AI computing, and for investors who hold a diversified portfolio for five years or more, there's room to own both.

Should you buy stock in Applied Materials right now?

Before you buy stock in Applied Materials, consider this:

The Motley Fool Stock Advisor analyst team just identified what they believe are the 10 best stocks for investors to buy now… and Applied Materials wasn’t one of them. The 10 stocks that made the cut could produce monster returns in the coming years.

Consider when Netflix made this list on December 17, 2004... if you invested $1,000 at the time of our recommendation, you’d have $375,240!* Or when Nvidia made this list on April 15, 2005... if you invested $1,000 at the time of our recommendation, you’d have $1,403,292!*

Now, it’s worth noting Stock Advisor’s total average return is 932% — a market-crushing outperformance compared to 211% for the S&P 500. Don't miss the latest top 10 list, available with Stock Advisor, and join an investing community built by individual investors for individual investors.

See the 10 stocks »

*Stock Advisor returns as of October 1, 2026.

Mike Schwenk has no position in any of the stocks mentioned. The Motley Fool has positions in and recommends Advanced Micro Devices, Applied Materials, Globalfoundries, Intel, Meta Platforms, Microsoft, Nvidia, and Taiwan Semiconductor Manufacturing. The Motley Fool has a disclosure policy.

  •  

Is the Schwab International Equity ETF or Vanguard Total World Stock ETF Better for Long-Term Diversification?

Key Points

  • Vanguard Total World Stock ETF provides comprehensive exposure to both domestic and international markets, while Schwab International Equity ETF focuses solely on developed ex-U.S. stocks.

  • Schwab International Equity ETF is the more cost-effective choice with an expense ratio of 0.03% compared to 0.06% for the Vanguard fund.

  • Investors prioritizing current income may prefer Schwab International Equity ETF, which offers a 3.0% dividend yield compared to 1.5% for Vanguard Total World Stock ETF.

Vanguard Total World Stock ETF (NYSEMKT:VT) provides investors with exposure to both U.S. and international markets, whereas Schwab International Equity ETF (NYSEMKT:SCHF) serves as a low-cost specialist for developed economies outside the United States.

While both funds offer global reach, the Vanguard Total World Stock ETF follows the FTSE Global All Cap Index to capture the entire investable world. In contrast, the Schwab International Equity ETF tracks the FTSE Developed ex US Index, making it a dedicated tool for those wanting to isolate international developed markets at a rock-bottom price point.

Snapshot (cost & size)

MetricSCHFVT
IssuerSchwabVanguard
Share price (as of 9/28/26)$27.72$158.81
Expense ratio0.03%0.06%
1-yr return (as of 9/28/26)24.2%18.0%
Dividend yield3.0%1.5%
Beta0.820.92
AUM$67.8 billion$101.7 billion

Beta measures price volatility relative to the S&P 500; beta is calculated from monthly returns over the available fund history (up to five years). The 1-yr return represents total return over the trailing 12 months. Dividend yield is the trailing-12-month distribution yield.

The Schwab International Equity ETF is a more affordable option for investors, carrying a low 0.03% expense ratio compared to 0.06% for the Vanguard Total World Stock ETF. This 0.03-percentage-point difference can affect long-term compounding over decades. Additionally, the Schwab fund offers a significantly higher payout, with a 3% yield versus 1.5% for the Vanguard fund.

Performance & risk comparison

MetricSCHFVT
Max drawdown (5 yr)(29.1%)(26.4%)
Growth of $1,000 over 5 years (total return)$1,660$1,710

What's inside

The Vanguard Total World Stock ETF casts a wide net, holding more than 10,000 securities across the globe. Its portfolio leans heavily into technology at 30%, followed by financial services at 16% and industrials at 11%. Its largest positions include Nvidia at 4.3%, Apple at 3.8%, and Microsoft at 3.1%. The fund was launched in 2008. Vanguard Total World Stock ETF has paid $2.41 per share over the trailing 12 months, which on its recent ~$158.81 share price works out to a 1.5% yield.

The Schwab International Equity ETF focuses more narrowly on developed markets outside the U.S., with a portfolio of 1,442 holdings. Its sector allocation is led by financial services at 25%, technology at 17.7%, and industrials at 17.6%. Its largest positions include Samsung Electronics at 3.2%, SK Hynix at 2.5%, and ASML Holding at 2.4%. The fund was launched in 2009. Schwab International Equity ETF has paid $0.84 per share over the trailing 12 months, which on its recent ~$27.72 share price works out to a 3% yield.

For more guidance on ETF investing, check out the full guide at this link.

Which looks like the better buy

When you're looking to diversify your stock portfolio, leaning toward international funds is a good idea. Vanguard's Total World Stock ETF is often suggested as a good starting point, as it covers both domestic and foreign stocks in both developed and emerging markets. It's relatively inexpensive to own, and while its exposure to emerging markets comes with some risk, its breadth across 10,000 holdings gives it a good deal of stability. For long-term investors, it's an easy set-it-and-forget-it holding. But investors who are truly seeking diversification may not be satisfied with VT's approach. Indeed, its top three names are familiar U.S. tech giants, and while it offers a slightly higher dividend yield, it's underperformed the S&P 500 index over the last five years.

SCHF leans further into the international diversification theme, providing access to large- and mid-cap stocks from developed countries outside the U.S., including South Korea and Canada. Its market cap and geographic limits protect investors from the most extreme risk, but the fund has demonstrated a sharper five-year maximum drawdown. Like VT, it’s also underperformed the S&P 500 over the last five years. That said, it's also cheaper to own and generates more dividend income than VT. And it gives you exposure to stocks that may not already be in your portfolio.

Should you buy stock in Vanguard International Equity Index Funds - Vanguard Total World Stock ETF right now?

Before you buy stock in Vanguard International Equity Index Funds - Vanguard Total World Stock ETF, consider this:

The Motley Fool Stock Advisor analyst team just identified what they believe are the 10 best stocks for investors to buy now… and Vanguard International Equity Index Funds - Vanguard Total World Stock ETF wasn’t one of them. The 10 stocks that made the cut could produce monster returns in the coming years.

Consider when Netflix made this list on December 17, 2004... if you invested $1,000 at the time of our recommendation, you’d have $375,240!* Or when Nvidia made this list on April 15, 2005... if you invested $1,000 at the time of our recommendation, you’d have $1,403,292!*

Now, it’s worth noting Stock Advisor’s total average return is 932% — a market-crushing outperformance compared to 211% for the S&P 500. Don't miss the latest top 10 list, available with Stock Advisor, and join an investing community built by individual investors for individual investors.

See the 10 stocks »

*Stock Advisor returns as of October 1, 2026.

Sarah Sidlow has positions in Apple, Microsoft, Nvidia, and Vanguard International Equity Index Funds - Vanguard Total World Stock ETF. The Motley Fool has positions in and recommends ASML, Apple, Microsoft, and Nvidia. The Motley Fool has a disclosure policy.

  •  

If You Invest $100 Per Month in Realty Income (O) Stock, Here's the Passive Dividend Income It Could Generate Over 10 Years

Key Points

Realty Income (NYSE: O), one of the world's largest real estate investment trusts (REITs) with 15,500 commercial properties, has raised its dividend 136 times since its public debut. It's also one of the few REITs that pays monthly dividends, and it pays a hefty forward yield of 6%.

What will happen if you invest $100 monthly in Realty Income for 10 years?

Over the past 10 years, Realty Income generated a total return of 33% with reinvested dividends. A $12,000 investment would have grown to about $16,000.

Missed AI’s "Act 1"? Act 2 Could Be 15x Bigger. Most investors think they missed the AI boat because they didn't buy Nvidia in 2005. But according to our analysts, we’re only at the end of "Act 1"—the R&D phase. "Act 2" is the global rollout. Continue »

An investor studies a stock chart.

Image source: Getty Images.

But if you had spread that $12,000 investment into $100 monthly investments over 10 years and reinvested your monthly dividends, your investment would be worth $21,450 today. That big gap can be attributed to the magic of dollar-cost averaging and compound returns.

By always investing $100 in Realty Income every month, you'd have bought more shares when its price was lower and fewer shares when it was higher. That dollar-cost averaging approach smoothed out your long-term gains, especially during the interest rate spikes that depressed the stock price. Your reinvested dividends also contributed to those compound gains.

Realty Income should remain a reliable dividend stock for income-oriented investors over the next ten years. But if you simply buy and forget it -- instead of reinvesting and compounding your returns monthly -- you'll likely leave a lot of money on the table.

Should you buy stock in Realty Income right now?

Before you buy stock in Realty Income, consider this:

The Motley Fool Stock Advisor analyst team just identified what they believe are the 10 best stocks for investors to buy now… and Realty Income wasn’t one of them. The 10 stocks that made the cut could produce monster returns in the coming years.

Consider when Netflix made this list on December 17, 2004... if you invested $1,000 at the time of our recommendation, you’d have $375,240!* Or when Nvidia made this list on April 15, 2005... if you invested $1,000 at the time of our recommendation, you’d have $1,403,292!*

Now, it’s worth noting Stock Advisor’s total average return is 932% — a market-crushing outperformance compared to 211% for the S&P 500. Don't miss the latest top 10 list, available with Stock Advisor, and join an investing community built by individual investors for individual investors.

See the 10 stocks »

*Stock Advisor returns as of October 1, 2026.

Leo Sun has positions in Realty Income. The Motley Fool has positions in and recommends Realty Income. The Motley Fool has a disclosure policy.

  •  

ASML vs. Applied Digital: Which Is the Better Semiconductor Equipment Stock to Own for the Next 1 Year?

Key Points

  • ASML plans to raise the company’s low-NA EUV capacity by roughly 30% in 2027.

  • Applied Materials is benefiting from multiple AI-driven chipmaking trends.

  • Applied Materials offers faster expected earnings growth at a lower forward valuation.

ASML Holding (NASDAQ: ASML) and Applied Materials (NASDAQ: AMAT) are both benefiting from the artificial intelligence (AI) chip boom but in very different ways.

ASML's extreme ultraviolet (EUV) lithography machines are used to print the most complex circuits in leading-edge chips. As chipmakers pack more computing power into smaller chips, they need more precise manufacturing equipment. This trend has been driving demand for ASML's systems.

Missed Nvidia in 2009? This Rare Signal Is Flashing Again. In 2009, a "Double Down" signal flashed for a little-known chipmaker called Nvidia. For the first time in years, that same "Total Conviction" signal is flashing for a company 1/100th the size of Nvidia. Continue »

Applied Materials is also playing a crucial role in manufacturing advanced chips. The company supplies equipment used at several stages of chip production, including creating and shaping materials, checking for defects, and packaging chips together. Demand for these tools is rising as AI chips become more complex and increasingly use technologies such as high bandwidth memory and advanced packaging.

Let's see which stock is the better choice for investors right now.

Analyst analyzing stock charts on three desktop screens.

Image source: Getty Images.

ASML's impressive demand visibility

ASML's position as the only commercial supplier of EUV lithography systems is well established. The company has exceptionally strong visibility into demand for 2027. Revenue rose by nearly 21.2% year over year to 9.3 billion euros in the second quarter of 2026 (ending June 28). The company expects net sales in 2026 to fall in the range of 43 billion to 45 billion euros.

Low-NA EUV, ASML's current-generation extreme ultraviolet lithography technology, is used to print extremely small circuit patterns on advanced chips. The company expects to increase low-NA EUV capacity by roughly 30% in 2027, from around 65 systems in 2026. Yet management says it is already close to receiving all the low-NA EUV orders it needs for 2027. This suggests production capacity, rather than a lack of customer orders, could become the bigger near-term constraint.

ASML's newer High-NA EUV technology is another potential growth driver. High-NA EUV allows chipmakers to print even smaller and more precise features on advanced chips than ASML's current EUV systems. This technology is already moving into commercial production.

Intel is using High-NA EUV on selected layers of chips made with its Intel 18A manufacturing process. The company says it has already begun shipping the first high-volume logic product manufactured using High-NA EUV.

Applied Materials has multiple AI-powered growth drivers

Applied Materials is particularly well-positioned in some of the fastest-growing areas of semiconductor equipment spending. The company says that leading-edge chip manufacturing, DRAM memory, and advanced packaging are driving roughly 80% of the growth in wafer fabrication equipment spending.

Financial results were also impressive. The company's revenue jumped 25% year over year to $9.1 billion, while generally accepted accounting principles (GAAP) earnings per share rose 43% year over year to $3.17 in the third quarter of fiscal 2026 (ending July 26). Management also expects advanced packaging revenue to grow more than 70% in calendar 2026.

Hence, Applied Materials is benefiting not only from customers making more chips but also from the increasing complexity of AI chips, which require more manufacturing steps.

However, investor expectations also seem to have risen sharply. Shares of Applied Materials have soared by nearly 89.4%, while ASML stock is up by roughly 65.6% so far in 2026 (as of Sept. 28). Applied Materials' shares also fell more than 5% after its third-quarter earnings report, even though the company reported strong growth and issued revenue guidance above Wall Street's expectations.

Reuters attributed the decline to already-high investor expectations. This suggests the market may now require more than just strong results from the company.

China creates different risks for the two companies

Both technology companies face restrictions on selling certain advanced chipmaking equipment to China, but the risks differ significantly for each.

ASML expects China to account for around 20% of its total 2026 sales. China has also started producing its own immersion deep ultraviolet (DUV) lithography machines, an older but still widely used technology for printing circuit patterns on chips. However, Reuters reported that these systems are still being tested and remain behind ASML's technology and reliability.

Applied Materials also has significant exposure to China. China accounted for 28% of the company's total revenue in the third quarter. The company also faces a more immediate competitive threat from Chinese equipment makers in some of its core markets.

Reuters reported that Samsung Electronics and SK Hynix have been testing equipment from Chinese chip-equipment maker Advanced Micro-Fabrication Equipment at their factories in China. Chinese suppliers are making progress in areas such as etch and deposition, where Applied Materials also competes.

Hence, ASML could eventually face greater competition in DUV lithography, but China still lacks a commercial alternative to its advanced EUV systems. Applied Materials faces a more immediate threat, since Chinese suppliers are already gaining ground in some of the etch and deposition markets where it competes.

Which stock is a better pick over the next year?

ASML is trading at roughly 30.8 times forward one-year earnings, compared with about 27.4 for Applied Materials (as of Sept. 28). Yet analysts expect the consensus EPS to grow roughly 35% year over year for ASML and almost 44.3% for Applied Materials in the next fiscal year. So Applied Materials appears to be offering faster expected growth at the lower valuation multiple.

Hence, for the next year, Applied Materials seems to be a better pick. ASML offers stronger demand visibility and a harder-to-replicate moat, but Applied Materials' lower valuation and faster expected earnings growth make it a more attractive short-term pick. But investor expectations are already high, so Applied Materials will need to keep delivering strong results to see robust share price returns in the next year.

Don’t miss this second chance at a potentially lucrative opportunity

Ever feel like you missed the boat in buying the most successful stocks? Then you’ll want to hear this.

On rare occasions, our expert team of analysts issues a “Double Down” stock recommendation for companies that they think are about to pop. If you’re worried you’ve already missed your chance to invest, now is the best time to buy before it’s too late. And the numbers speak for themselves:

  • Nvidia: if you invested $1,000 when we doubled down in 2009, you’d have $593,741!*
  • Apple: if you invested $1,000 when we doubled down in 2008, you’d have $63,526!*
  • Netflix: if you invested $1,000 when we doubled down in 2004, you’d have $375,240!*

Right now, we’re issuing “Double Down” alerts for three incredible companies, available when you join Stock Advisor, and there may not be another chance like this anytime soon.

See the 3 stocks »

*Stock Advisor returns as of October 1, 2026.

Manali Pradhan, CFA has no position in any of the stocks mentioned. The Motley Fool has positions in and recommends ASML, Applied Materials, and Intel. The Motley Fool has a disclosure policy.

  •  

Axsome Therapeutics vs. Vertex Pharmaceuticals: Which Biotech Stock Is a Better Buy in 2026?

Key Points

  • Axsome Therapeutics is delivering explosive revenue growth as it scales its commercial portfolio for central nervous system disorders.

  • Vertex Pharmaceuticals remains a highly profitable giant with absolute dominance in cystic fibrosis and expanding reach in gene therapy.

  • Both companies are building compelling drug portfolios in different disease areas. Which stage of the biotech journey fits your investing style better?

Choosing between Axsome Therapeutics (NASDAQ:AXSM) and Vertex Pharmaceuticals (NASDAQ:VRTX) means weighing aggressive revenue growth against established, highly profitable dominance in the global biotechnology market. Which is the better buy today?

Axsome focuses on central nervous system disorders with a rapidly expanding commercial portfolio, while Vertex is a cash flow powerhouse led by its cystic fibrosis treatments. Both companies represent different risk and reward profiles in the healthcare market, making them favorites for various types of investors.

The case for Axsome Therapeutics

Axsome Therapeutics focuses on developing and commercializing therapies for central nervous system conditions, including depression, migraine, and narcolepsy. As a growing player among biotech stocks, the company generates revenue from its approved products, Auvelity and Sunosi. It has recently resolved patent litigation for Sunosi through settlement agreements that establish a framework for generic entry starting in 2040, providing long-term clarity for that specific product line.

In FY 2025, revenue reached nearly $638.5 million, representing a significant growth of roughly 65.5% compared to the previous year. Despite this rapid expansion in sales, the company reported a net loss of approximately $183.2 million for the period. This net margin, which measures the percentage of revenue remaining as profit after all expenses, was a negative 28.7%, which was an improvement from deeper losses in prior years.

As of its December 2025 balance sheet, the debt-to-equity ratio is roughly 2.7x, meaning total debt is nearly three times the value of shareholder equity. The current ratio, which measures a company's ability to cover its short-term obligations with short-term assets, is approximately 1.4x. During FY 2025, free cash flow was negative $93.9 million, which is the cash remaining after the business paid for its operations and capital investments.

The case for Vertex Pharmaceuticals

Vertex Pharmaceuticals is a biotechnology leader known for its portfolio of medicines treating cystic fibrosis, such as Trikafta and Kalydeco. The company also markets therapies for sickle cell disease and has recently introduced Journavx for acute pain management. By maintaining extensive networks of authorized treatment centers and broad payer coverage, the business ensures its specialized therapies reach patients across global markets.

In FY 2025, revenue reached approximately $12.1 billion, which reflects a year over year growth of nearly 9.6%. The company is highly profitable, reporting net income of close to $4.0 billion for the fiscal year. This resulted in a net margin of approximately 32.7%, showing that Vertex retains nearly a third of its revenue as profit after accounting for all of its costs.

As of its December 2025 balance sheet, the debt-to-equity ratio is close to 0.2x, indicating that total debt is quite low relative to shareholder equity. Its current ratio is approximately 2.9x, suggesting a strong ability to meet short-term financial commitments with its existing assets. The company generated roughly $3.2 billion in free cash flow during FY 2025, which represents the cash left over after paying for operations and capital equipment.

Risk profile comparison

Axsome faces several operational and financial risks, including a history of net losses and a recurring need for additional funding to sustain its clinical trials. The company also deals with competition from generic versions of its products, such as recent regulatory filings for generic Auvelity and Symbravo. Regulatory hurdles remain a challenge, illustrated by a previous Refuse to File letter for its candidate AXS-14, alongside a heavy dependence on third-party manufacturers for supply.

Vertex contends with significant revenue concentration since most of its sales come from cystic fibrosis treatments, making it vulnerable to any manufacturing or safety disruptions in that area. Product development is complex and carries risks of failure, such as the setback for its VX-264 program. Furthermore, the company faces pricing pressures from government regulators and must successfully integrate acquisitions like Crinetics Pharmaceuticals and Alpine Immune Sciences while competing with CRISPR Therapeutics (NASDAQ:CRSP).

Valuation comparison

Vertex appears more conservatively valued based on its Forward P/E relative to future earnings estimates, while Axsome commands a higher P/S ratio measuring price against sales.

MetricAxsome TherapeuticsVertex Pharmaceuticals
Forward P/E44.6x27.2x
P/S ratio16.7x10.7x

Valuation metrics sourced from Financial Modeling Prep (FMP) and may differ from other data providers.

Which stock would I buy in 2026?

I'd go with Vertex Pharmaceuticals. It has built one of the most profitable and diversified drug portfolios in biotech, and the pipeline keeps expanding into new disease areas that could sustain that growth for years. Its cystic fibrosis franchise now treats the vast majority of patients living with the disease, and a new pain drug is gaining commercial traction alongside it. A recently completed acquisition adds a kidney disease drug awaiting an imminent FDA approval decision. The balance sheet is flush with cash, and management just raised its full-year outlook.

Axsome has quickly built a very strong commercial drug portfolio, with a new FDA approval for a condition affecting many Alzheimer's patients adding a promising new indication. For investors who want earlier-stage biotech exposure with commercial products already on the market, it is a good candidate.

The challenge for Axsome right now is that building a commercial drug business is expensive, and the costs are rising faster than the revenue. Missing estimates in the most recent quarter is a reminder that the path to profitability leaves little room for stumbles. Vertex faces no such uncertainty. It has already done the hard work of building a profitable, diversified business, and it keeps adding to it. That's why it's my pick.

Should you buy stock in Axsome Therapeutics right now?

Before you buy stock in Axsome Therapeutics, consider this:

The Motley Fool Stock Advisor analyst team just identified what they believe are the 10 best stocks for investors to buy now… and Axsome Therapeutics wasn’t one of them. The 10 stocks that made the cut could produce monster returns in the coming years.

Consider when Netflix made this list on December 17, 2004... if you invested $1,000 at the time of our recommendation, you’d have $375,240!* Or when Nvidia made this list on April 15, 2005... if you invested $1,000 at the time of our recommendation, you’d have $1,403,292!*

Now, it’s worth noting Stock Advisor’s total average return is 932% — a market-crushing outperformance compared to 211% for the S&P 500. Don't miss the latest top 10 list, available with Stock Advisor, and join an investing community built by individual investors for individual investors.

See the 10 stocks »

*Stock Advisor returns as of October 1, 2026.

Sara Appino has no position in any of the stocks mentioned. The Motley Fool has positions in and recommends Axsome Therapeutics and Vertex Pharmaceuticals. The Motley Fool recommends CRISPR Therapeutics. The Motley Fool has a disclosure policy.

  •  

Bristol-Myers Squibb vs. Johnson & Johnson: Comparing Quarterly Revenue Scale

Key Points

  • Johnson & Johnson generates consistently higher quarterly revenue than Bristol-Myers Squibb, maintaining a clear lead in total dollars over the entire observed eight-quarter period without any interruption.

  • Both companies experienced a gentle pattern of quarter-over-quarter revenue growth over the last two calendar years, though the exact quarterly figures occasionally fluctuated between consecutive reporting periods.

  • Investors should monitor whether the existing revenue gap between the two companies continues to gradually expand or begins to narrow during upcoming quarterly reporting cycles.

Bristol Myers Squibb: Slow and Steady Revenue Growth

Bristol Myers Squibb (NYSE:BMY) operates as a global biopharmaceutical entity that researches, develops, and commercializes a worldwide medicinal portfolio spanning therapeutic areas like hematology, oncology, and cardiovascular health, offering pharmaceutical products such as Revlimid and Eliquis.

It received accelerated regulatory approval from the U.S. Food and Drug Administration for its Zenbexus combination therapy for adult patients with multiple myeloma in August 2026, and it selected Houston for a new $2.3 billion multi-modal manufacturing campus designed to increase its production capacity for next-generation medicines.

Johnson & Johnson: Maintaining a Larger Revenue Base

Johnson & Johnson (NYSE:JNJ) functions as a broad healthcare holding company that engages in the research, development, manufacture, and global sale of products primarily through its dedicated innovative medicine and medical technology segments.

It finalized a $1 billion cash acquisition of Firefly Bio in July 2026 to integrate a targeted antibody-drug conjugate platform, while it also secured regulatory approval for its IMAAVY treatment for patients dealing with warm autoimmune hemolytic anemia.

Why Revenue Matters for Investors

Revenue here refers to the data provider's standardized income-statement revenue line item, which gives investors a direct baseline measurement of the total volume of money a business brings in from its core commercial operations before deducting any associated operating expenses, interest, or taxes.

Bristol-Myers Squibb vs. Johnson & Johnson Revenue chart

Comparing Quarterly Revenue for Bristol Myers Squibb and Johnson & Johnson

Calendar quarterBristol-Myers Squibb RevenueJohnson & Johnson Revenue
Q3 2024$11.9 billion (quarter ended Sept. 30, 2024)$22.5 billion (quarter ended Sept. 29, 2024)
Q4 2024$12.3 billion (quarter ended Dec. 31, 2024)$22.5 billion (quarter ended Dec. 29, 2024)
Q1 2025$11.2 billion (quarter ended March 31, 2025)$21.9 billion (quarter ended March 30, 2025)
Q2 2025$12.3 billion (quarter ended June 30, 2025)$23.7 billion (quarter ended June 29, 2025)
Q3 2025$12.2 billion (quarter ended Sept. 30, 2025)$24.0 billion (quarter ended Sept. 28, 2025)
Q4 2025$12.5 billion (quarter ended Dec. 31, 2025)$24.6 billion (quarter ended Dec. 28, 2025)
Q1 2026$11.5 billion (quarter ended March 31, 2026)$24.1 billion (quarter ended March 29, 2026)
Q2 2026$13.0 billion (quarter ended June 30, 2026)$25.3 billion (quarter ended June 28, 2026)

Data source: Financial Modeling Prep. Data as of Sept. 25, 2026.

Foolish Take

Both Bristol Myers Squibb and Johnson & Johnson are consistently, if slowly, growing their revenue, though Johnson & Johnson is obviously starting from a much larger base. In fact, despite Johnson & Johnson's revenue being about double that of Bristol Myers Squibb, over the period shown above, it grew its revenue at a slightly higher rate. That's impressive.

One thing to watch from here will be Johnson & Johnson's medical technology division, an area Bristol Myers Squibb, a biopharmaceuticals company, doesn't have. J&J's medtech division grew operational sales 3.6% in the second quarter, and in 2025, it generated $33.79 billion in revenue. It's growing the segment via both acquisitions and in-house research and development, which can be costly. However, once those products are approved and in use, they can generate exceptional revenue and high profit margins.

In July, J&J received FDA market authorization in the U.S. for its OTTAVA Robotic Surgical System, "the world's first table-integrated soft tissue robotic system." At the time of the announcement, a U.S. clinical trial for OTTAVA in inguinal hernia procedures was ongoing. Customer uptake and success with this system could provide a strong moat and a new recurring revenue stream for the legacy healthcare company.

Should you buy stock in Bristol Myers Squibb right now?

Before you buy stock in Bristol Myers Squibb, consider this:

The Motley Fool Stock Advisor analyst team just identified what they believe are the 10 best stocks for investors to buy now… and Bristol Myers Squibb wasn’t one of them. The 10 stocks that made the cut could produce monster returns in the coming years.

Consider when Netflix made this list on December 17, 2004... if you invested $1,000 at the time of our recommendation, you’d have $375,240!* Or when Nvidia made this list on April 15, 2005... if you invested $1,000 at the time of our recommendation, you’d have $1,403,292!*

Now, it’s worth noting Stock Advisor’s total average return is 932% — a market-crushing outperformance compared to 211% for the S&P 500. Don't miss the latest top 10 list, available with Stock Advisor, and join an investing community built by individual investors for individual investors.

See the 10 stocks »

*Stock Advisor returns as of October 1, 2026.

Sarah Sidlow has positions in Johnson & Johnson. The Motley Fool has positions in and recommends Bristol Myers Squibb. The Motley Fool recommends Johnson & Johnson. The Motley Fool has a disclosure policy.

  •  

Honeywell Split Into 3 Companies. Here's Which One I'd Buy for the Aerospace Boom.

Key Points

The need to modernize commercial and defense aerospace fleets is expected to drive increased spending in the sector. One report estimates that global aerospace spending will rise from $434.17 billion this year to $846.30 billion by 2035, a compound annual growth rate of 7.7% -- and so the industry is transforming as a result.

In 2024, one key player -- then known as just plain-old Honeywell International-- announced it would split its three segments of advanced materials, automation, and aerospace into three companies. In October of 2025, it spun off its advanced materials business into Solstice Advanced Materials (NASDAQ: SOLS). Three months ago, on June 29, the company completed the spinoff of Honeywell Technologies (NASDAQ: HON) for its automation business and Honeywell Aerospace (NASDAQ: HONA) for its aerospace business.

Missed Nvidia in 2009? This Rare Signal Is Flashing Again. In 2009, a "Double Down" signal flashed for a little-known chipmaker called Nvidia. For the first time in years, that same "Total Conviction" signal is flashing for a company 1/100th the size of Nvidia. Continue »

Deciding which Honeywell company is the right one to buy for the aerospace boom may seem like a trick question. The answer is so obvious, it can't be right, can it?

Jet plane on an airport tarmac.

Image source: Getty Images.

The choice isn't as simple as it seems

The name makes Honeywell Aerospace seem like the obvious stock to play the aerospace boom. The company builds aircraft engines, avionics, auxiliary power units, and other aviation systems for commercial and defense aircraft. However, the other two Honeywell companies each benefit from aerospace spending.

Solstice makes low-global-warming-potential hydrofluoroolefin solvents, which are critical for precision cleaning of sensitive flight instruments, oxygen lines, hydraulic systems, and jet turbine components. The company also makes high-purity chemicals, specialized blowing agents, and fluoropolymers used in semiconductors, radomes, thermal insulation, and circuit boards integrated into modern aircraft avionics.

Honeywell Technologies, which is what remains of Honeywell International, is a pure-play industrial automation company, but its products are critical to how aerospace equipment is manufactured, tested, and housed, including its distributed control systems, robotics, assembly line controls, and test facilities and environmental chambers.

So, the answer isn't so easy. To figure out which of these companies should thrive the most from an aerospace boom, you have to look back at the third quarter of 2025, when all three segments were under the same roof. In that quarter, Honeywell Aerospace reported 15% year-over-year sales growth, well ahead of the other two segments.

In the second quarter of this year, Honeywell Aerospace's first as an independent company, it reported sales of $4.5 billion, up 5% year over year. It also reported adjusted earnings per share of $1.87, down 32% from the same period last year, though that figure is somewhat skewed by short-term spinoff costs. It may take a while for the company to overcome those expenses, as its long-term debt increased to $15.85 billion from $4 million, reflecting financing moves related to its separation from Honeywell Technologies.

Investors have been lukewarm on the stock

Since its spinoff, the stock is down more than 18%, worse than the roughly 11% drop for Honeywell Technologiesso far this year and less than the 32% decline for Solstice stock. One reason for Honeywell Aerospace's decline is that it trimmed its full-year sales growth guidance from 7%-9% to 4%-5%.

Of the three, Solstice is predicting the most growth, 6%, at the midpoint, with Honeywell Technologiesexpecting 3% to 4% revenue growth.

The backlog is a big deal

As of the second quarter, Honeywell Aerospace had a backlog of $18.1 billion, and it continues to add to its orders. Year to date, Honeywell Aerospace has built significant commercial and defense momentum, securing an estimated $15 billion in lifetime value across a series of major new contract wins. Headlining these accomplishments is a historic deal with Indian carrier IndiGo, which selected Honeywell's flagship avionics and power systems for its massive order of 810 new Airbus A320neo family aircraft, marking the largest new-aircraft-selectable equipment win in the company's history.

In addition to major original equipment manufacturer (OEM) selections, Honeywell Aerospace continues to advance its retrofit, modification, and upgrade (RMU) growth strategy, highlighted by Aeromexico's intention to adopt its latest Surface Alerts (SURF-A) runway safety technology across its fleet of more than 100 Boeing 737NG and 737MAX aircraft. On the defense front, European OEMs have named Civitanavi Systems' ARGO 4000 inertial measurement unit as a preferred solution to integrate critical guidance capabilities into missile programs, unmanned platforms, maritime vessels, and land vehicles.

These orders provide great transparency of the company's earnings over the next couple of years. That backlog is largely tied to defense modernization programs, military avionics upgrades, and next-generation propulsion systems. The increase in defense budgets worldwide should give the company steady cash flow visibility even during broader economic pullbacks.

One of its biggest concerns is supply chain issues, but as a stand-alone company, it can focus on that issue more directly than when it was a segment of Honeywell International.

Taking the long-term view

Honeywell Aerospace, among the three Honeywell-related stocks, is best positioned to benefit from the aerospace boom. It has the most industry exposure of the three stocks, with Honeywell Technologies and Solstice having only tertiary exposure to aviation. Honeywell should also have more long-term growth, and its huge backlog of orders means it should have little difficulty paying down its debt.

Down the line, the stock could even offer a dividend or stock repurchases, making it more appetizing to investors. With more than $18.1 billion in revenue anticipated this year and a high-margin commercial aftermarket business, Honeywell Aerospace generates substantial free cash flow. This financial profile gives the board the flexibility to consider initiating a regular quarterly dividend once baseline operational and capital allocation priorities stabilize.

Should you buy stock in Honeywell Aerospace right now?

Before you buy stock in Honeywell Aerospace, consider this:

The Motley Fool Stock Advisor analyst team just identified what they believe are the 10 best stocks for investors to buy now… and Honeywell Aerospace wasn’t one of them. The 10 stocks that made the cut could produce monster returns in the coming years.

Consider when Netflix made this list on December 17, 2004... if you invested $1,000 at the time of our recommendation, you’d have $375,240!* Or when Nvidia made this list on April 15, 2005... if you invested $1,000 at the time of our recommendation, you’d have $1,403,292!*

Now, it’s worth noting Stock Advisor’s total average return is 932% — a market-crushing outperformance compared to 211% for the S&P 500. Don't miss the latest top 10 list, available with Stock Advisor, and join an investing community built by individual investors for individual investors.

See the 10 stocks »

*Stock Advisor returns as of October 1, 2026.

James Halley has no position in any of the stocks mentioned. The Motley Fool has positions in and recommends Honeywell Aerospace and Honeywell Technologies. The Motley Fool has a disclosure policy.

  •  

Arm vs. ASML: Which Semiconductor Stock Is a Better Buy in 2026?

Key Points

  • Arm designs the power-efficient chip architecture used in nearly all smartphones and is expanding into artificial intelligence data centers.

  • ASML maintains a critical monopoly on the lithography machines required to manufacture the world's most advanced processors.

  • Both companies sit at critical points in the semiconductor supply chain. Which is the better fit for your portfolio?

As the demand for high-performance computing accelerates, investors often struggle to choose between the architects of chip design and the manufacturers of chipmaking hardware. Choosing between Arm (NASDAQ:ARM) and ASML (NASDAQ:ASML) requires understanding their distinct roles.

Arm licenses its intellectual property to hundreds of companies, earning royalties on nearly every smartphone sold globally. Meanwhile, ASML provides the essential machinery that allows foundries to print those designs onto silicon. Both companies are vital players among semiconductor stocks, but they offer different paths to growth.

The case for Arm

Arm operates a high-margin business model centered on licensing its compute platform and central processing unit designs. The company provides the fundamental blueprints that power the mobile world and is increasingly gaining traction in the automotive and cloud data center sectors. Because it does not manufacture physical chips, its asset-light model allows it to scale across the entire industry without the heavy costs of factory ownership.

In the fiscal year ended March 31, 2026, revenue reached nearly $4.9 billion, representing growth of approximately 22.8% compared with the prior fiscal year. The company reported a net income of roughly $904.0 million for the period. While its net margin of approximately 18.4% was slightly lower than the previous year, the company continues to see strong adoption of its latest architecture versions.

As of its March 2026 balance sheet, the current ratio stands at approximately 6.0x, which measures a company's ability to cover its short-term liabilities with its short-term assets. The debt-to-equity ratio, which compares total debt to shareholder equity, is roughly 0.1x. Note that stock-based compensation represented roughly 69% of operating cash flow, which inflates reported cash generation since SBC is a non-cash expense added back in the cash flow statement.

The case for ASML

ASML occupies a unique position as the sole provider of extreme ultraviolet lithography machines. These massive, highly complex tools are the only way for chipmakers to produce the smallest and most advanced transistors. This technological moat makes the company an indispensable partner for any foundry aiming to support modern artificial intelligence applications.

In the fiscal year ended Dec. 31, 2025, revenue reached nearly $37.1 billion, a growth of approximately 15.6% over the prior fiscal year. The company achieved a net income of close to $10.9 billion for the year. This resulted in a healthy net margin of approximately 29.4%, reflecting the premium pricing power that comes with its specialized equipment monopoly.

As of its December 2025 balance sheet, the current ratio is approximately 1.3x. Its debt-to-equity ratio is roughly 0.1x, suggesting a conservative use of leverage relative to its equity. The company generated approximately $12.1 billion in free cash flow, which is the cash remaining after a business pays for its operating expenses and capital expenditures.

Risk profile comparison

Arm faces risks related to the concentration of its architecture in the mobile market, where growth has slowed compared to earlier decades. The company also contends with the rise of open-source alternatives like RISC-V, which could eventually challenge its licensing dominance. Additionally, geopolitical tensions can impact its ability to license technology in certain sensitive regions, potentially limiting its total addressable market.

ASML is highly sensitive to the capital expenditure cycles of a few major chip manufacturers. If these customers delay their expansion plans, the company's hardware orders can experience significant volatility. Furthermore, international trade restrictions on advanced lithography tools, particularly regarding shipments to certain markets, remain a persistent challenge that could cap its long-term revenue potential.

Valuation comparison

ASML appears significantly cheaper on a relative basis when comparing both its premium to earnings and its valuation relative to total sales.

MetricArmASML
Forward P/E139.3x39.2x
P/S ratio64.3x16.4x

Valuation metrics sourced from Financial Modeling Prep (FMP) and may differ from other data providers.

Which stock would I buy in 2026?

I'd go with ASML. Its position in the semiconductor industry is one of the most defensible in the world: It is the only company that makes the extreme ultraviolet lithography machines needed to produce the most advanced chips. Every chipmaker building AI hardware depends on ASML's equipment to do it, and there is no alternative. That kind of irreplaceable role in the global technology supply chain is extraordinarily rare.

There is a lot to like about how Arm makes its money. Its architecture powers virtually every smartphone, and royalty revenue more than doubled in the data center segment. This is a business that compounds reliably without depending on any single product cycle. For investors who value consistency and steady growth, it is a strong long-term hold.

Both companies benefit from the AI build-out, but from different angles. Arm earns a royalty when a chip is designed, while ASML earns revenue when that chip gets built. But as chip demand keeps growing, ASML sits at the only chokepoint in the entire supply chain that cannot be worked around. For a long-term investor, that is a compelling place to put your money.

Should you buy stock in Arm Holdings right now?

Before you buy stock in Arm Holdings, consider this:

The Motley Fool Stock Advisor analyst team just identified what they believe are the 10 best stocks for investors to buy now… and Arm Holdings wasn’t one of them. The 10 stocks that made the cut could produce monster returns in the coming years.

Consider when Netflix made this list on December 17, 2004... if you invested $1,000 at the time of our recommendation, you’d have $375,240!* Or when Nvidia made this list on April 15, 2005... if you invested $1,000 at the time of our recommendation, you’d have $1,403,292!*

Now, it’s worth noting Stock Advisor’s total average return is 932% — a market-crushing outperformance compared to 211% for the S&P 500. Don't miss the latest top 10 list, available with Stock Advisor, and join an investing community built by individual investors for individual investors.

See the 10 stocks »

*Stock Advisor returns as of October 1, 2026.

Sara Appino has no position in any of the stocks mentioned. The Motley Fool has positions in and recommends ASML and Arm Holdings. The Motley Fool has a disclosure policy.

  •  

Where Will Palantir Stock Be in 5 Years?

Key Points

Palantir Technologies (NASDAQ: PLTR) stock has made a parabolic jump lately after a difficult start to the year.

Shares of the artificial intelligence (AI) software specialist have shot up 60% over the past three months, driven by the company's accelerating growth and the healthy prospects of the AI software market. But can Palantir stock sustain its healthy momentum over the next five years and make investors richer?

Missed AI’s "Act 1"? Act 2 Could Be 15x Bigger. Most investors think they missed the AI boat because they didn't buy Nvidia in 2005. But according to our analysts, we’re only at the end of "Act 1"—the R&D phase. "Act 2" is the global rollout. Continue »

Let's find out.

Palantir company name and logo superimposed on a grey background with a modern glass building.

Image source: The Motley Fool.

Palantir's addressable market is poised to take off

Palantir's Artificial Intelligence Platform (AIP) has played a central role in accelerating the company's growth over the past three and a half years. The platform was launched in April 2023 to help enterprises and governments integrate generative AI into their operations, and it has been extremely successful.

AIP has not only helped increase Palantir's customer count but also encouraged more spending by existing customers. As a result, Palantir has seen a significant increase in profitability over the past three years, along with accelerating revenue growth.

PLTR Revenue (TTM) Chart

Data by YCharts

The good news for Palantir investors is that the AI platforms market that the company serves is poised to take off over the next five years. Advisory and research provider Futurum Group estimates that the AI platforms market could grow from $110 billion in 2025 to $497 billion in 2030 in a base-case scenario. It is worth noting that Futurum expects the market size to reach $358 billion in 2030 under a bear scenario, at a compound annual growth rate (CAGR) of 27%.

The bull case scenario suggests a 49% CAGR through 2030, with the market size poised to reach $811 billion by the end of the forecast period. Palantir, therefore, is scratching the surface of a huge growth opportunity that could send its shares soaring over the next five years.

The stock's incredible rally seems sustainable

Palantir's 2025 revenue increased by 56% to $4.48 billion. The company anticipates almost $8.16 billion in revenue for 2026, which would be an 82% increase over last year. So, Palantir is growing faster than the AI software platforms space, and more importantly, its growth rate is accelerating.

We have already seen that Palantir's end market could increase at a 49% CAGR through 2030 in a bull-case scenario. The productivity gains from AI adoption can indeed help the market clock such impressive growth. For instance, economists at the University of California, Berkeley, and the London School of Economics and Political Science note that AI has increased software engineers' productivity by almost 33% between November 2022 and December 2025, as reported by The Register.

Given that Palantir's AIP helps customers boost productivity and reduce redundancy, the company can continue to grow faster than the end market. Assuming Palantir's revenue increases at 60% a year for the next five years, at a slightly stronger pace than the AI software platforms market's projected growth, its top line could reach $85.5 billion after five years (using 2026's $8.16 billion revenue estimate as the base).

If Palantir trades at even 10 times sales at that time, a significant discount to its price-to-sales ratio of 80, its market cap could reach $855 billion. That implies potential upside of 90% over the next five years. However, investors can expect greater upside in this AI stock, as its above-average growth rate is likely to be rewarded with a premium valuation.

Should you buy stock in Palantir Technologies right now?

Before you buy stock in Palantir Technologies, consider this:

The Motley Fool Stock Advisor analyst team just identified what they believe are the 10 best stocks for investors to buy now… and Palantir Technologies wasn’t one of them. The 10 stocks that made the cut could produce monster returns in the coming years.

Consider when Netflix made this list on December 17, 2004... if you invested $1,000 at the time of our recommendation, you’d have $375,240!* Or when Nvidia made this list on April 15, 2005... if you invested $1,000 at the time of our recommendation, you’d have $1,403,292!*

Now, it’s worth noting Stock Advisor’s total average return is 932% — a market-crushing outperformance compared to 211% for the S&P 500. Don't miss the latest top 10 list, available with Stock Advisor, and join an investing community built by individual investors for individual investors.

See the 10 stocks »

*Stock Advisor returns as of October 1, 2026.

Harsh Chauhan has no position in any of the stocks mentioned. The Motley Fool has positions in and recommends Palantir Technologies. The Motley Fool has a disclosure policy.

  •  

Should You Buy Nvidia Stock in October? What Its Decade-Low Valuation Signals

Key Points

  • As the world’s leading AI chip designer, Nvidia has seen earnings soar in the triple digits.

  • The company’s innovation is helping it maintain its market dominance.

Nvidia (NASDAQ: NVDA) has been the "go-to" stock for investors looking for an artificial intelligence (AI) win. The company has built a massive business that revolves around this high-growth industry, offering chips, complete systems, enterprise software, and more. All of this has translated into explosive revenue growth -- and the stock price has climbed in lockstep during most of this journey.

This year, Nvidia stock is still on the rise, but momentum has slowed amid investors' concerns about inflation and geopolitical problems. These worries often weigh on demand for growth-oriented stocks like Nvidia and other AI players as they depend on a strong economy. At the same time, some investors have also questioned the pace of investment in AI infrastructure and worry that any slowdown could be bad news for Nvidia.

Missed Nvidia in 2009? This Rare Signal Is Flashing Again. In 2009, a "Double Down" signal flashed for a little-known chipmaker called Nvidia. For the first time in years, that same "Total Conviction" signal is flashing for a company 1/100th the size of Nvidia. Continue »

Considering the full picture, should you buy Nvidia stock in October? Here's what its decade-low valuation signals.

An AI chip is shown.

Image source: Getty Images.

The three reasons behind Nvidia's successes

Before we talk valuation, let's take a look at the Nvidia story so far. This tech giant became an AI superpower for three reasons: First, it has the right product. Nvidia makes the world's top-performing graphics processing units, offering the speed and efficiency that make them perfect for AI workloads. Second, Nvidia recognized this well before the AI boom began and got in early. The company shifted the focus of its GPUs to AI about a decade ago. Finally, Nvidia regularly updates its GPUs, and this makes it difficult for rivals -- who started serving the AI market later in the story -- to catch up.

As I mentioned earlier, Nvidia hasn't stuck with only GPUs. The company expanded to offer a great variety of products and services so that customers don't have to seek out solutions from a number of providers. They could turn uniquely to Nvidia for a complete package. The company has also developed platforms to serve specific industries, such as automotive, and has expanded its reach through the AI ecosystem. For example, Nvidia recently agreed to buy open-source AI platform Hugging Face for more than $12 billion, a move that could further boost the popularity of the company's products and services.

Nvidia's efforts in the AI space have produced tremendous results from an earnings perspective, too. The company has delivered double- and triple-digit growth quarter after quarter in recent years. In the latest three-month period, revenue and profit climbed in the triple digits to $96 billion and $59 billion, respectively.

Nvidia's stock price momentum has slowed

Still, Nvidia's stock hasn't been as buoyant as it was over the past few years. After climbing 1,100% over the past three calendar years, Nvidia now is heading for a 20% increase in 2026. This isn't due to a specific problem at Nvidia, but instead to the market headwinds I spoke of above.

So, now the question is: Should you buy Nvidia stock in October? A great place to start is with a look at valuation. Nvidia's has tumbled, and the stock trades at 28x trailing 12-month earnings, near its lowest level in a decade.

This could be a rare bargain buying opportunity, considering Nvidia's role and strength in the AI market. As we can see from the chart below, after reaching such levels in the past, Nvidia went on to gain.

NVDA Chart

NVDA data by YCharts

Of course, it's important to note that the general market environment or even a temporary pause in AI spending could slow down the stock's progression. But these elements don't change the long-term AI outlook. Analysts expect the AI market to advance into the trillions of dollars as of early next decade, and this is supported by the idea that AI is in the early days of its real-world-use story. The technology has been developed, and it continues to develop, but the application of it is just beginning, and this suggests there's room for growth for many years to come.

Nvidia, as a chip designer that's proven its ability to maintain its lead and grow its presence, is well-positioned to benefit. That's why it's a great idea for long-term investors to buy Nvidia stock now in October, while it's trading at a decade-low valuation.

Should you buy stock in Nvidia right now?

Before you buy stock in Nvidia, consider this:

The Motley Fool Stock Advisor analyst team just identified what they believe are the 10 best stocks for investors to buy now… and Nvidia wasn’t one of them. The 10 stocks that made the cut could produce monster returns in the coming years.

Consider when Netflix made this list on December 17, 2004... if you invested $1,000 at the time of our recommendation, you’d have $375,240!* Or when Nvidia made this list on April 15, 2005... if you invested $1,000 at the time of our recommendation, you’d have $1,403,292!*

Now, it’s worth noting Stock Advisor’s total average return is 932% — a market-crushing outperformance compared to 211% for the S&P 500. Don't miss the latest top 10 list, available with Stock Advisor, and join an investing community built by individual investors for individual investors.

See the 10 stocks »

*Stock Advisor returns as of October 1, 2026.

Adria Cimino has no position in any of the stocks mentioned. The Motley Fool has positions in and recommends Nvidia. The Motley Fool has a disclosure policy.

  •  

Why Did Infosys Stock Pop on Thursday?

Key Points

  • Accenture beat on both top and bottom lines in its Q4 earnings report today.

  • Accenture stock went up immediately, but so did Infosys.

  • Infosys is scheduled to report its own earnings later this month.

Infosys (NYSE:INFY) stock jumped 6.6% through 2 p.m. ET Thursday -- not because of anything Infosys did, but because of what rival IT consultant Accenture (NYSE:ACN) just reported.

Heading into Accenture's Q4 earnings report this morning, analysts expected Accenture to report a $3.19 per share profit on just over $18 billion in quarterly sales. In fact, Accenture earned $3.29 per share on $18.7 billion in sales -- beating on both top and bottom lines.

Missed AI’s "Act 1"? Act 2 Could Be 15x Bigger. Most investors think they missed the AI boat because they didn't buy Nvidia in 2005. But according to our analysts, we’re only at the end of "Act 1"—the R&D phase. "Act 2" is the global rollout. Continue »

Gold question mark over a rising green stock market arrow laid out on graph paper.

Image source: Getty Images.

What Accenture's earnings beat (might) mean for Infosys

Accenture reported 6% sales growth in Q4, 370 basis points worth of operating margin improvement, and a huge increase in net income -- up 46%. (Free cash flow grew only 6% year over year, merely pacing revenue growth.)

Accenture also gave guidance for the coming fiscal year 2027, forecasting sales growth to slow somewhat to a range of 3% to 6%, but for profit margins to continue expanding, resulting in earnings growth of 6% to 9%.

Investors appear to be looking at Accenture's good Q4 news and decent guidance for the coming year, and extrapolating from this that Infosys may also report strong numbers (and guidance) when its own earnings come out on Oct. 23.

What's next for Infosys?

So what must Infosys report to match Accenture's earnings beat?

Analysts polled by Yahoo! Finance see the company growing sales 10.7% to $492.5 billion, with earnings growth of only 5% to $0.21 per share. That's a high bar for sales growth, relative to what Accenture just reported, but a really low bar on earnings growth.

At just 13.3 times trailing earnings, Infosys stock looks cheaper than Accenture at 14.7 times earnings. It'll need to grow earnings a lot faster than just 5%, however, to make it a buy in my book.

Should you buy stock in Infosys right now?

Before you buy stock in Infosys, consider this:

The Motley Fool Stock Advisor analyst team just identified what they believe are the 10 best stocks for investors to buy now… and Infosys wasn’t one of them. The 10 stocks that made the cut could produce monster returns in the coming years.

Consider when Netflix made this list on December 17, 2004... if you invested $1,000 at the time of our recommendation, you’d have $375,240!* Or when Nvidia made this list on April 15, 2005... if you invested $1,000 at the time of our recommendation, you’d have $1,403,292!*

Now, it’s worth noting Stock Advisor’s total average return is 932% — a market-crushing outperformance compared to 211% for the S&P 500. Don't miss the latest top 10 list, available with Stock Advisor, and join an investing community built by individual investors for individual investors.

See the 10 stocks »

*Stock Advisor returns as of October 1, 2026.

Rich Smith has no position in any of the stocks mentioned. The Motley Fool has positions in and recommends Accenture Plc. The Motley Fool recommends the following options: long January 2028 $260 calls on Accenture Plc and short January 2028 $280 calls on Accenture Plc. The Motley Fool has a disclosure policy.

  •  

Arm vs. Credo Technology Group: Which Tech Stock Is a Better Buy in 2026?

Key Points

  • Arm provides the energy-efficient compute architecture powering nearly all of the world's smartphones.

  • Credo Technology Group is experiencing explosive growth by providing high-speed connectivity solutions for AI data centers.

  • Speed or staying power? Credo and Arm offer two very different ways to own the AI infrastructure build-out.

As artificial intelligence reshapes the global data landscape, infrastructure providers are seeing unprecedented demand. Investors must decide between the widespread architectural reach of Arm (NASDAQ:ARM) and the specialized connectivity of Credo Technology Group (NASDAQ:CRDO).

Arm provides the fundamental blueprint for processors found in billions of devices, while Credo focuses on the high-speed pathways that move data between servers. Both companies are essential to the expansion of modern computing, but they differ significantly in scale, growth rates, and how the market values their future potential.

The case for Arm

Arm designs the fundamental compute platforms that power almost every smartphone on Earth. Instead of manufacturing chips directly, the company licenses its intellectual property to other manufacturers, earning royalties and licensing fees. This capital-light model allows it to maintain a presence in over 350 billion chips worldwide while expanding into data centers and edge computing.

In FY 2026, revenue reached nearly $4.9 billion, representing a year-over-year increase of approximately 22.8%. The company reported net income of roughly $904.0 million for the period, which resulted in a net margin of close to 18.4%. This performance highlights the company's ability to maintain profitability as it gains traction in the semiconductor stocks market.

As of its March 2026 balance sheet, the debt-to-equity ratio is approximately 0.1x, which measures total debt relative to shareholder equity. The current ratio, a measure of a company's ability to pay short-term obligations, stands at nearly 6.0x. For the same fiscal period, free cash flow was close to $979.0 million. Note that stock-based compensation represented roughly 69% of operating cash flow, which inflates reported cash generation since SBC is a non-cash expense added back in the cash flow statement.

The case for Credo Technology Group

Credo Technology Group provides high-speed connectivity solutions that enable data to travel efficiently through modern AI data centers. The company sells specialized products like Active Electrical Cables and optical transceivers to major cloud providers. Key commercial partners include Oracle (NYSE:ORCL) and Microsoft (NASDAQ:MSFT). Customer concentration like this adds a layer of risk to the business, as the top ten customers represent roughly 90% of total revenue.

In FY 2026, revenue reached nearly $1.3 billion, a massive jump of approximately 205.7% from the previous year. The company posted net income of close to $472.3 million, resulting in a net margin of roughly 35.4%. This surge in revenue and profitability reflects the intense demand for high-speed connectivity as hyperscalers scale their artificial intelligence infrastructure.

As of its May 2026 balance sheet, the debt-to-equity ratio is 0.0x, indicating the company has no debt. Its current ratio is approximately 10.2x, suggesting a very strong liquidity position for covering immediate liabilities. Free cash flow for the period was close to $407.0 million. Note that stock-based compensation represented roughly 39.3% of operating cash flow, which inflates reported cash generation since SBC is a non-cash expense added back in the cash flow statement.

Risk profile comparison

Arm faces risks related to its high dependency on the smartphone market, where growth has historically been cyclical. It also faces increasing competition from open-source architectures, which offer royalty-free alternatives to its proprietary designs. Furthermore, geopolitical tensions involving international trade could impact its ability to license technology in key global markets.

Credo Technology Group deals with significant revenue concentration, meaning the loss of a single hyperscale customer could severely impact financial results. The company competes against well-established giants such as Broadcom (NASDAQ:AVGO), Marvell Technology (NASDAQ:MRVL), and Astera Labs (NASDAQ:ALAB). It also relies on a fabless model, depending on Taiwan Semiconductor Manufacturing Company (NYSE:TSM) for manufacturing, which exposes it to potential supply chain disruptions.

Valuation comparison

Credo appears more attractively valued than Arm, as it trades at much lower multiples of sales over the past twelve months and future earnings estimates.

MetricArmCredo Technology Group
Forward P/E139.3x30.5x
P/S ratio64.3x22.5x

Valuation metrics sourced from Financial Modeling Prep (FMP) and may differ from other data providers.

Which stock would I buy in 2026?

I'd go with Credo Technology. The company has strung together one of the most impressive growth streaks in the semiconductor industry, with revenue approaching or exceeding triple digits for several consecutive quarters, gross margins above 70%, and guidance pointing to more than 85% revenue growth for the full year. Its connectivity chips and optical products are becoming essential inside the AI data centers being built by every major hyperscaler.

Arm's royalty model is one of the more durable business models in semiconductors. Its architecture powers virtually every smartphone and is rapidly expanding into AI data centers, with royalty revenue more than doubling in that segment. The business compounds reliably across billions of devices and does not depend on any single product cycle. For investors who value consistency above acceleration, it is a strong long-term hold.

Customer concentration is the one risk worth watching at Credo, since a handful of hyperscalers drive most of its revenue. But the demand behind those relationships keeps growing, and the results keep arriving ahead of expectations. For investors comfortable with that trade-off, Credo's growth trajectory is simply in a different league right now.

Should you buy stock in Arm Holdings right now?

Before you buy stock in Arm Holdings, consider this:

The Motley Fool Stock Advisor analyst team just identified what they believe are the 10 best stocks for investors to buy now… and Arm Holdings wasn’t one of them. The 10 stocks that made the cut could produce monster returns in the coming years.

Consider when Netflix made this list on December 17, 2004... if you invested $1,000 at the time of our recommendation, you’d have $375,240!* Or when Nvidia made this list on April 15, 2005... if you invested $1,000 at the time of our recommendation, you’d have $1,403,292!*

Now, it’s worth noting Stock Advisor’s total average return is 932% — a market-crushing outperformance compared to 211% for the S&P 500. Don't miss the latest top 10 list, available with Stock Advisor, and join an investing community built by individual investors for individual investors.

See the 10 stocks »

*Stock Advisor returns as of October 1, 2026.

Sara Appino has positions in Taiwan Semiconductor Manufacturing. The Motley Fool has positions in and recommends Arm Holdings, Broadcom, Marvell Technology, Microsoft, Oracle, and Taiwan Semiconductor Manufacturing. The Motley Fool recommends Astera Labs. The Motley Fool has a disclosure policy.

  •  

X-Energy Just Went Public in 2026. Here's How It Stacks Up Against Oklo, NuScale, and BWX Technologies.

Key Points

X-Energy (NASDAQ: XE), a developer of small modular reactors (SMRs), went public at $23 per share on April 24. But today, it trades at just $14. Let's see why X-Energy's stock dropped below its IPO price, and how it compares to three other popular nuclear energy stocks: Oklo (NYSE: OKLO), NuScale (NYSE: SMR), and BWX Technologies (NYSE: BWXT).

What does X-Energy do?

X-Energy's Xe-100 SMRs are much smaller than conventional nuclear reactors. A single Xe-100 generates only 80 MWe, whereas traditional reactors generate over 1,000 MWe. However, the Xe-100 can be deployed in modular "four packs" to expand a plant's capacity.

Missed AI’s "Act 1"? Act 2 Could Be 15x Bigger. Most investors think they missed the AI boat because they didn't buy Nvidia in 2005. But according to our analysts, we’re only at the end of "Act 1"—the R&D phase. "Act 2" is the global rollout. Continue »

Electrical transmission towers.

Image source: Getty Images.

SMRs can be more easily deployed in remote and off-grid areas. It's already landed major deals with Amazon, Dow, and Energy Northwest (a joint operating agency for public utility districts and municipalities across Washington state).

X-Energy has been scaling up its fuel production capacity to meet that demand, but it doesn't expect to deploy its first commercial reactors until the early 2030s. In 2025, the company still generated $109 million in revenue from its engineering services, government grants, and technical partnerships, while posting a net loss of $390 million. For 2026, analysts expect its revenue to rise another 94% to $212 million as its net loss widens to $430 million.

With a market cap of $4.1 billion, X-Energy trades at 19 times this year's sales. So even though it's dropped nearly 40% below its IPO price, it still can't be considered a bargain.

How does X-Energy compare to Oklo, NuScale, and BWX?

Oklo, NuScale, and BWX are also developing smaller nuclear reactors, but they've all adopted different technologies and strategies. Oklo develops microreactors, which are even smaller and only generate 1.5 MWe. They can also be chained together in their modular plants.

NuScale, which produces a 77 MWe SMR, is more comparable to X-Energy. But NuScale still uses conventional light-water reactor (LWR) technology and standard uranium rods. In contrast, X-Energy's Xe-100 uses high-temperature gas-cooled reactors (HTGRs) that consume TRISO (tri-structural isotropic) particle fuel. That key difference enables the Xe-100 to withstand much higher temperatures than NuScale's water-cooled SMRs.

Even though HTGR microreactors could be much safer than conventional reactors, the U.S. Nuclear Regulatory Commission (NRC) has only approved LWR designs (including NuScale's) so far. NuScale also expects to deploy its first microreactors in the early 2030s.

BWX -- the only large-scale manufacturer of specialized nuclear components, fuel systems, and naval reactor systems in North America -- sells smaller, transportable microreactors that generate 1-5 MWe. But that's only a small part of its massive business, which generates most of its revenue by selling reactors, fuel, and nuclear components to the U.S. Navy.

Is X-Energy's stock worth buying today?

X-Energy has several glaring weaknesses. First, it depends on a specific TRISO pebble fuel that isn't as readily available as uranium. To scale its business, it needs to ramp up the production of that proprietary fuel through its TRISO-X subsidiary.

Second, it trails far behind NuScale and other LWR SMR makers in regulatory clearance. Since TRISO pebble fuel is a newer and untested technology, the NRC will need to view it through a different lens before approving its first reactor designs. Lastly, X-Energy will remain overshadowed by bigger and more profitable nuclear giants -- like BWX -- in this unforgiving market for speculative, unprofitable companies trading at premium valuations.

While X-Energy's stock might take off once it clears its regulatory hurdles, increases its fuel production, and starts deploying its first commercial reactors, it will remain under pressure as long as rising Treasury yields continue to drive investors away from riskier stocks. Therefore, I'd avoid X-Energy and stick with more resilient market leaders like BWX.

Should you buy stock in X-Energy right now?

Before you buy stock in X-Energy, consider this:

The Motley Fool Stock Advisor analyst team just identified what they believe are the 10 best stocks for investors to buy now… and X-Energy wasn’t one of them. The 10 stocks that made the cut could produce monster returns in the coming years.

Consider when Netflix made this list on December 17, 2004... if you invested $1,000 at the time of our recommendation, you’d have $375,240!* Or when Nvidia made this list on April 15, 2005... if you invested $1,000 at the time of our recommendation, you’d have $1,403,292!*

Now, it’s worth noting Stock Advisor’s total average return is 932% — a market-crushing outperformance compared to 211% for the S&P 500. Don't miss the latest top 10 list, available with Stock Advisor, and join an investing community built by individual investors for individual investors.

See the 10 stocks »

*Stock Advisor returns as of October 1, 2026.

Leo Sun has positions in Amazon. The Motley Fool has positions in and recommends Amazon and BWX Technologies. The Motley Fool recommends NuScale Power. The Motley Fool has a disclosure policy.

  •  

Warren Buffett Just Stepped Down as Berkshire's Chairman After Delivering a 19.7% Annual Return Over 61 Years. Should Shareholders Be Concerned?

Key Points

Warren Buffett is 96 years old, noting in a letter to shareholders announcing his departure from Berkshire Hathaway (NYSE: BRKA)(NYSE: BRKB) that "Father Time always wins." After more than 60 years of leading the business, the transition to new leaders has happened fairly quickly. But it was planned well in advance, so investors probably don't need to be too concerned. Here's why.

Buffett can't be replaced

Warren Buffett is a cultural icon whose reach has extended far beyond Wall Street. That said, his investment success is legendary, with annualized returns of 19.7% during his tenure at Berkshire Hathaway. With no intention of slighting new CEO Greg Abel, he will never be Warren Buffett. But that's also a fairly reasonable statement, since Greg Abel is a different person. He will put his own imprint on the massive conglomerate that Warren Buffett basically created from the remains of a shirt manufacturer.

Missed Nvidia in 2009? This Rare Signal Is Flashing Again. In 2009, a "Double Down" signal flashed for a little-known chipmaker called Nvidia. For the first time in years, that same "Total Conviction" signal is flashing for a company 1/100th the size of Nvidia. Continue »

Warren Buffett speaking into microphones.

Image source: The Motley Fool.

Still, investors need to remember that Buffett worked with Abel for decades. He helped mold Abel into the leader he is today, including a fairly long period during which Abel was the chosen successor-in-waiting. Abel is steeped in Buffett's approach and will likely operate similarly to his predecessor on many matters. And, Buffett didn't exactly cut and run, since he moved from the CEO post to the role of chairman of the board.

That meant that Buffett was there to help Abel through the transition. Now, about nine months later, Buffett has stepped down from his new role, too. But this was a planned transition as well, with his son, Howard Buffett, taking his place. Howard Buffett has served on Berkshire Hathaway's board for 33 years and on the board of Coca-Cola (NYSE: KO), among others, so he has plenty of experience.

However, Howard Buffett's primary goal at Berkshire Hathaway is to "guard its culture and values – both worth more than anything on our balance sheet," according to Warren Buffett. Warren Buffett went on to explain that investors should "think of Howard as a policy the shareholders own and hope never to claim against." That was a cute tie-in to the company's insurance operations, but Warren Buffett has basically put in place both a hand-selected, personally trained CEO and a hand-selected safeguard for shareholders (in the role of chairman of the board).

Berkshire Hathaway will change, but probably not much

Just as Greg Abel is not Warren Buffett, Howard Buffett is not Warren Buffett either. So Berkshire Hathaway is going to change now that Warren Buffett has fully stepped away. But investors shouldn't be too concerned, because Warren Buffett has clearly worked thoughtfully and diligently to ensure as much continuity as possible during this transition period.

In fact, there's little more Warren Buffett could have done other than to stay on indefinitely. But, as he noted in his typical witty fashion, "Father Time always wins," and this transition was bound to happen sooner or later. Shareholders should feel lucky that he was around to orchestrate it as he did.

Should you buy stock in Berkshire Hathaway right now?

Before you buy stock in Berkshire Hathaway, consider this:

The Motley Fool Stock Advisor analyst team just identified what they believe are the 10 best stocks for investors to buy now… and Berkshire Hathaway wasn’t one of them. The 10 stocks that made the cut could produce monster returns in the coming years.

Consider when Netflix made this list on December 17, 2004... if you invested $1,000 at the time of our recommendation, you’d have $375,240!* Or when Nvidia made this list on April 15, 2005... if you invested $1,000 at the time of our recommendation, you’d have $1,403,292!*

Now, it’s worth noting Stock Advisor’s total average return is 932% — a market-crushing outperformance compared to 211% for the S&P 500. Don't miss the latest top 10 list, available with Stock Advisor, and join an investing community built by individual investors for individual investors.

See the 10 stocks »

*Stock Advisor returns as of October 1, 2026.

Reuben Gregg Brewer has no position in any of the stocks mentioned. The Motley Fool has positions in and recommends Berkshire Hathaway. The Motley Fool has a disclosure policy.

  •  

Applied Materials vs. Broadcom: Which Semiconductor Stock Is a Better Buy in 2026?

Key Points

  • Applied Materials maintains a dominant position in providing the essential equipment and materials engineering needed for chip manufacturing.

  • Broadcom offers a diversified revenue stream through its high-margin infrastructure software and specialized artificial intelligence networking chips.

Should you invest in the machines that build the chips or the company that designs them? Choosing between Applied Materials (NASDAQ:AMAT) and Broadcom (NASDAQ:AVGO) depends on your specific goals for 2026.

Applied Materials provides the heavy-duty equipment required to manufacture modern semiconductors, while Broadcom focuses on designing chips and enterprise software. Both companies are essential to global technology infrastructure, but they offer different paths to growth. This comparison evaluates their financials and risks to help you decide which stock is a better buy.

The case for Applied Materials

In its latest annual report, filed for the fiscal year ended in late 2025, Applied Materials described its leadership in materials engineering for the semiconductor industry. The company provides the essential equipment and software used by major manufacturers like Taiwan Semiconductor Manufacturing Company (NYSE:TSM) to build advanced chips. Customer concentration like this adds a layer of risk to the business, as two primary customers accounted for approximately 19% and 15% of its fiscal 2025 net revenue.

In FY 2025, revenue reached nearly $28.4 billion, indicating a growth rate of roughly 4.4% compared to the previous year. The company reported net income of approximately $7.0 billion for the same period. While revenue grew, net income slightly trailed the $7.2 billion reported in the prior fiscal year, reflecting slightly tighter net margins.

As of its October 2025 balance sheet, the debt-to-equity ratio was roughly 0.3x. This ratio measures total debt against shareholder equity, helping you understand how the company funds its operations. The current ratio, which measures the ability to cover short-term bills with current assets, was close to 2.6x. Free cash flow for the year was nearly $5.7 billion, representing the cash remaining after the business paid for its daily operations and equipment investments.

The case for Broadcom

In its latest annual report, Broadcom highlighted its evolution into a diversified infrastructure giant. The company is a key player among semiconductor stocks, designing chips for networking and wireless communication while expanding its software footprint. Major commercial developments include a massive chip commitment with Apple (NASDAQ:AAPL) and the integration of VMware to serve enterprise clients.

In FY 2025, revenue reached nearly $63.9 billion, representing a significant increase of approximately 23.9% over the previous year. Net income for the period was roughly $23.1 billion, a sharp rise from the $5.9 billion reported in FY 2024. This growth was largely driven by the full-year inclusion of software acquisitions and robust demand for artificial intelligence networking components.

As of its November 2025 balance sheet, the debt-to-equity ratio was approximately 0.8x. The current ratio was nearly 1.7x, suggesting a healthy balance between liquid assets and upcoming liabilities. Free cash flow for the fiscal year was close to $26.9 billion. Note that stock-based compensation represented roughly 27.5% of operating cash flow, which inflates reported cash generation since SBC is a non-cash expense added back in the cash flow statement.

Risk profile comparison

Applied Materials faces significant risks from international export controls, particularly regarding technology sales to China. These regulations can disrupt supply chains and limit access to one of its largest markets. Furthermore, the company is sensitive to the capital expenditure cycles of a small number of customers, making its revenue potentially volatile when those manufacturers reduce spending.

Broadcom relies heavily on a limited group of distributors and end customers, with five large buyers generating nearly 40% of its total revenue. The successful integration of large acquisitions like VMware is critical to its strategy, but it carries risks of legal costs and management distraction. The company also faces active antitrust scrutiny from regulators in the European Union regarding its software licensing practices.

Valuation comparison

Broadcom appears more attractively valued based on its lower multiple of future earnings estimates, while Applied Materials trades at a lower multiple of its total sales.

MetricApplied MaterialsBroadcom
Forward P/E36.1x29.8x
P/S ratio11.9x18.6x

Valuation metrics sourced from Financial Modeling Prep (FMP) and may differ from other data providers.

Which stock would I buy in 2026?

I'd go with Broadcom. Its custom AI accelerator business has become one of the most sought-after partnerships in the semiconductor industry, with supply commitments already secured to double AI revenue again next year. A customer roster that includes Google, Meta, OpenAI, and Anthropic is about as strong an endorsement as the AI industry offers, and free cash flow continues to expand alongside revenue.

Applied Materials is a well-run business with broad exposure across chip manufacturing equipment, and AI-driven demand for advanced semiconductors is pulling its orders forward. For investors who want diversified exposure to the chip manufacturing build-out without betting on any single end market, it is a solid choice.

But Applied Materials operates in a competitive landscape where customers have alternatives. Broadcom's hyperscaler relationships are deeper and harder to replicate, since once a major cloud company has designed its custom AI chip around Broadcom's architecture, the switching costs are enormous.

While most equipment companies win business one order at a time, Broadcom gets designed into the chip itself, which means the relationship only deepens as the customer scales. For a long-term investor, that compounding dynamic is very enticing.

Should you buy stock in Applied Materials right now?

Before you buy stock in Applied Materials, consider this:

The Motley Fool Stock Advisor analyst team just identified what they believe are the 10 best stocks for investors to buy now… and Applied Materials wasn’t one of them. The 10 stocks that made the cut could produce monster returns in the coming years.

Consider when Netflix made this list on December 17, 2004... if you invested $1,000 at the time of our recommendation, you’d have $375,240!* Or when Nvidia made this list on April 15, 2005... if you invested $1,000 at the time of our recommendation, you’d have $1,403,292!*

Now, it’s worth noting Stock Advisor’s total average return is 932% — a market-crushing outperformance compared to 211% for the S&P 500. Don't miss the latest top 10 list, available with Stock Advisor, and join an investing community built by individual investors for individual investors.

See the 10 stocks »

*Stock Advisor returns as of October 1, 2026.

Sara Appino has positions in Apple and Taiwan Semiconductor Manufacturing. The Motley Fool has positions in and recommends Apple, Applied Materials, Broadcom, Meta Platforms, and Taiwan Semiconductor Manufacturing. The Motley Fool has a disclosure policy.

  •  

Anthropic Could Beat OpenAI to Wall Street by Over a Year

Key Points

  • Anthropic's 2025 revenue increased by 1,050% from 2024.

  • Most of Anthropic's spending has gone toward buying computing power and building out AI infrastructure.

  • OpenAI's $122 billion capital raise in March gives it more runway to go public later.

With the world a few years into the AI gold rush, frontier labs OpenAI and Anthropic are ramping up their plans to go public. OpenAI first flirted with the idea earlier this year, setting an initial target for late 2026. It has since pushed back its planned IPO to 2027, and Anthropic has taken another step closer by putting together its IPO prospectus.

Releasing an IPO prospectus -- which provides a detailed dive into a company's financial standing and business outlook -- is a major step on the road to an IPO. After eyeing a late 2026 time frame, it now looks like Anthropic could beat OpenAI to the punch by quite a bit, according to the prospectus, which Reuters reporters have gotten access to.

Missed AI’s "Act 1"? Act 2 Could Be 15x Bigger. Most investors think they missed the AI boat because they didn't buy Nvidia in 2005. But according to our analysts, we’re only at the end of "Act 1"—the R&D phase. "Act 2" is the global rollout. Continue »

Both OpenAI and Anthropic are aiming to go public with valuations as high as $2 trillion. If it happened today, it would make either company the world's seventh most valuable public company, just ahead of Space Exploration Technologies (SpaceX), which set a new IPO valuation record on June 12, when it debuted with a market cap of $1.77 trillion.

A chip with "AI" on it inside of a digital brain.

Image source: Getty Images.

Big spending plans ahead for Anthropic

Anthropic's IPO prospectus showed what many expected: fast-growing revenue and large losses. Last year, its revenue jumped 1,050% year over year to $4.6 billion, but its operating loss (losses from core operations) widened to $8.06 billion from $5.08 billion in 2024.

It technically had an on-paper net loss of $42 billion, but $34 billion of that was from accounting charges, so I wouldn't hold that against its business too much.

Like many other big-name tech companies right now, Anthropic is spending heavily on building AI infrastructure and buying compute power from cloud providers like Amazon (AWS) and Alphabet (Google Cloud) to keep training and scaling its Claude models. It spent $7.33 billion on that in 2025, accounting for 58% of all its operating expenses.

Anthropic says it plans to spend $518 billion on infrastructure and computing power in the coming years, which is staggering, to say the least.

Anthropic could be the trial run

Assuming Anthropic beats OpenAI to the public market, it will be everyday investors' first chance to invest in a pure-play AI frontier lab (a company that creates state-of-the-art AI models). That's likely to come with a lot of interest and even more scrutiny -- especially if its valuation is close to the $2 trillion mark.

During a private funding round in March, OpenAI raised $122 billion at a $852 billion valuation for the company, so it may be less pressed to rush to join the public market and take on everything that comes with that. Whether it's having to deliver quarterly earnings reports that please Wall Street or facing increased regulatory scrutiny, OpenAI can kick the can down the road a bit if it wants to.

This isn't to say Anthropic needs to go public right now -- it has $20.28 billion in cash, cash equivalents, and short-term investments on its books -- but it does have a lot of incentive to do so.

Where to invest $1,000 right now

When our analyst team has a stock tip, it can pay to listen. After all, Stock Advisor’s total average return is 932%* — a market-crushing outperformance compared to 211% for the S&P 500.

They just revealed what they believe are the 10 best stocks for investors to buy right now, available when you join Stock Advisor.

See the stocks »

*Stock Advisor returns as of October 1, 2026.

Stefon Walters has no position in any of the stocks mentioned. The Motley Fool has positions in and recommends Alphabet and Amazon. The Motley Fool has a disclosure policy.

  •  

Applied Materials vs. ASML: Which Technology Stock Is a Better Buy in 2026?

Key Points

  • Applied Materials provides a broad portfolio of materials engineering tools essential for diverse semiconductor manufacturing stages.

  • ASML maintains a unique global monopoly on extreme ultraviolet lithography systems required for the most advanced chips.

As the artificial intelligence boom shifts from hype to hardware, choosing between Applied Materials (NASDAQ:AMAT) and ASML(NASDAQ:ASML) requires understanding the specialized tools that make modern computing possible.

These giants operate at different stages of the manufacturing process. While one provides a broad suite of materials engineering tools, the other holds a near-monopoly on the machines that print patterns on advanced chips.

The case for Applied Materials

Applied Materials sells a wide variety of equipment used to deposit, remove, and modify materials on silicon wafers. Its customers include global leaders in the foundry, logic, and memory markets who depend on these tools to build complex chip architectures. In fiscal 2025, two customers accounted for approximately 19% and 15% of net revenue, respectively, while a partnership with TSMC supports critical technology requirements for artificial intelligence.

In FY 2025, revenue reached nearly $28.4 billion, which represents growth of approximately 4.4% compared to the prior year. The company reported net income of close to $7.0 billion for the same period, demonstrating its ability to remain consistently profitable in a shifting market. This resulted in a net margin of 24.7%, which is a measure of how much profit is kept from every dollar of sales after all expenses are paid.

As of its October 2025 balance sheet, the debt-to-equity ratio was roughly 0.3x, which compares total debt to shareholder equity to show conservative borrowing levels. The current ratio, measuring the ability to pay short-term debts with short-term assets, was approximately 2.6x. Free cash flow, or the cash remaining after paying for capital expenditures, totaled nearly $5.7 billion and supports the company's ongoing research and development efforts along with its shareholder returns.

The case for ASML

ASML is the sole global provider of extreme ultraviolet (EUV) lithography systems used to print incredibly small patterns on the most advanced chips. By supplying these mission-critical machines to the broader semiconductor stocks landscape, the company has become an essential partner for every major manufacturer. Its proprietary technology is fundamental to the production of high-performance processors used in artificial intelligence and sophisticated mobile devices that require massive computing power.

In FY 2025, revenue reached close to $37.1 billion, representing growth of roughly 15.6% over the prior year. The company reported net income of approximately $10.9 billion during this fiscal year, showing substantial growth in its bottom line. It achieved a net margin of 29.4%, which shows that the business converts a high percentage of sales into actual profit for its shareholders after accounting for all operating costs.

As of its December 2025 balance sheet, the debt-to-equity ratio was approximately 0.1x, which indicates a very light debt load compared to its equity base. The company maintained a current ratio of roughly 1.3x, which compares short-term assets to short-term liabilities to assess the company's immediate liquidity. Free cash flow for the fiscal year reached nearly $12.1 billion, providing the company with ample capital to develop the next generation of high-aperture lithography machines.

Risk profile comparison

Applied Materials faces ongoing costs and scrutiny regarding export control compliance, including a $252 million settlement in February 2026. The business is highly sensitive to geopolitical trade tensions between the U.S. and China, which can disrupt supply chains. Furthermore, its reliance on a few large customers like Intel (NASDAQ:INTC) and competition from firms like KLA (NASDAQ:KLAC) makes it vulnerable to shifts in spending cycles.

ASML operates under strict export restrictions that limit its ability to sell advanced systems to certain markets, particularly China. Because its machines are incredibly complex, any disruption in its global supply chain can significantly delay deliveries and impact revenue. Additionally, the high cost of its next-generation machines may lead to slower adoption by customers like Advanced Micro Devices (NASDAQ:AMD).

Valuation comparison

Applied Materials looks cheaper than ASML based on its Forward P/E, which tracks price against earnings estimates, and its P/S ratio measuring sales over the past twelve months.

MetricApplied MaterialsASML
Forward P/E36.1x39.2x
P/S ratio11.9x16.4x

Valuation metrics sourced from Financial Modeling Prep (FMP) and may differ from other data providers.

Which stock would I buy in 2026?

Although both companies are extraordinary, ASML is the clear winner here. Its position in the semiconductor industry is unlike almost anything else in the market: It is the only company in the world that makes the EUV machines needed to produce the most advanced chips. Every chipmaker racing to build AI hardware, from TSMC to Samsung to Intel, depends on ASML's equipment to do it. That kind of monopoly position is extraordinarily rare.

The most recent quarter backed that up convincingly. Revenue grew more than 20% year over year, the company raised its full-year outlook substantially, and AI-driven demand for advanced logic and memory chips keeps pulling orders forward.

Applied Materials is a strong business with broad exposure across chip manufacturing equipment. But it operates in a more competitive landscape where customers have alternatives. ASML has no real competition at the cutting edge of chip manufacturing. For investors thinking in years rather than quarters, owning that kind of irreplaceable position in the global technology supply chain is a straightforward long-term thesis.

Should you buy stock in Applied Materials right now?

Before you buy stock in Applied Materials, consider this:

The Motley Fool Stock Advisor analyst team just identified what they believe are the 10 best stocks for investors to buy now… and Applied Materials wasn’t one of them. The 10 stocks that made the cut could produce monster returns in the coming years.

Consider when Netflix made this list on December 17, 2004... if you invested $1,000 at the time of our recommendation, you’d have $375,240!* Or when Nvidia made this list on April 15, 2005... if you invested $1,000 at the time of our recommendation, you’d have $1,403,292!*

Now, it’s worth noting Stock Advisor’s total average return is 932% — a market-crushing outperformance compared to 211% for the S&P 500. Don't miss the latest top 10 list, available with Stock Advisor, and join an investing community built by individual investors for individual investors.

See the 10 stocks »

*Stock Advisor returns as of October 1, 2026.

Sara Appino has positions in Taiwan Semiconductor Manufacturing. The Motley Fool has positions in and recommends ASML, Advanced Micro Devices, Applied Materials, Intel, KLA, and Taiwan Semiconductor Manufacturing. The Motley Fool has a disclosure policy.

  •  

Market Cap Explained: It's the Single Number I Check Before Buying Any Stock

Key Points

  • The market cap is the total value of a publicly traded company's outstanding shares.

  • Companies with smaller market caps offer a better shot at 10x returns, as long as their fundamentals are also good.

  • It's more feasible for a $2 billion company to eventually be worth $20 billion than it is for a $2 trillion company to eventually reach a $20 trillion valuation.

The market cap reflects the total dollar value of a publicly traded company's outstanding shares. If a company has 1 billion shares at $8 per share, it has an $8 billion market cap.

I look at this number before buying any stock because it highlights an investment's growth potential. While market cap isn't the only thing to consider, it's a critical part of my stock analyses. Here's why I put so much value into this number.

Missed Nvidia in 2009? This Rare Signal Is Flashing Again. In 2009, a "Double Down" signal flashed for a little-known chipmaker called Nvidia. For the first time in years, that same "Total Conviction" signal is flashing for a company 1/100th the size of Nvidia. Continue »

Charts and graphs with a sticky note that says "small cap."

Image source: Getty Images.

The different types of market caps

A $5 trillion company is a bit different from a $500 million company, and that's why investors use multiple categories to describe stocks by market cap. Here's the brief summary:

  • Micro-cap stocks: Market cap under $300 million
  • Small-cap stocks: Market cap between $300 million and $2 billion
  • Mid-cap stocks: Market cap between $2 billion and $10 billion
  • Large-cap stocks: Market cap between $10 billion and $200 billion
  • Mega-cap stocks: Market cap above $200 billion

Smaller companies are riskier but have a higher potential upside, while large-cap and mega-cap stocks are treated as more mature companies. They have a lower potential upside, but they also have less risk.

Large-cap and mega-cap stocks can still outperform smaller companies. Mega-cap stock Nvidia (NASDAQ: NVDA) is up by more than 20% year to date, easily outperforming the S&P 500 and most small companies.

However, I usually stay away from large-cap and mega-cap stocks. Some micro-cap stocks are in my portfolio, but my sweet spot is small-cap and mid-cap stocks.

Finding the next Nvidia requires understanding market caps

Many investors wish they could find the next Nvidia. Some people actively search for those types of growth stocks, while others read articles that explain why a certain stock can become the next Nvidia.

In most cases, this means looking for a stock that can deliver a 10x return, and for that, you have to focus on smaller companies.

Micron (NASDAQ: MU) has become a large player in the AI trade as its memory chips continue to fly off the shelves. However, Micron also has a $1.2 trillion market cap. The company would have to reach a $12 trillion market cap, more than twice Nvidia's current valuation, to produce a 10x return.

It's much easier for a $2 billion company to become a $20 billion company than it is for a $1.2 trillion company to soon command a $12 trillion valuation. That's why my memory plays are Penguin Solutions (NASDAQ: PENG) and Netlist (OTC: NLST) instead of Micron. Both of these companies have market caps under $5 billion and have more than doubled their memory revenue year over year.

A low market cap does not guarantee better returns

I'm not just buying more shares of Penguin Solutions and Netlist because I like their market caps. I primarily build these positions because of good fundamentals. They are exposed to the growing memory chip industry and have attractive multiyear tailwinds.

A market cap under $10 billion serves as an invitation for me to do more digging. Then I review earnings reports and presentations to assess the company's current direction.

Most stocks underperform the broader market, and that's especially true for smaller companies. The Russell 2000 Index, the small-cap benchmark, is up by less than 30% over the past five years. The S&P 500 has gained more than 70% over that same stretch.

Ironically, the Russell 2000 Index is a great place to find smaller companies that can crush the giants. However, this benchmark is filled with too many small-cap companies, which minimizes the impact of 10x performers. For instance, the benchmark's largest holding makes up less than 0.5% of the entire fund.

Companies with smaller market caps are more volatile and can result in significant capital losses for some positions. However, a single small-cap stock that can 10x will undo the losses of smaller positions. Prioritizing companies with smaller market caps increases the likelihood of compelling returns, but it's an opportunity only suitable for investors who can stay on top of their investments and read the news every day to learn new things.

Should you buy stock in Nvidia right now?

Before you buy stock in Nvidia, consider this:

The Motley Fool Stock Advisor analyst team just identified what they believe are the 10 best stocks for investors to buy now… and Nvidia wasn’t one of them. The 10 stocks that made the cut could produce monster returns in the coming years.

Consider when Netflix made this list on December 17, 2004... if you invested $1,000 at the time of our recommendation, you’d have $375,240!* Or when Nvidia made this list on April 15, 2005... if you invested $1,000 at the time of our recommendation, you’d have $1,403,292!*

Now, it’s worth noting Stock Advisor’s total average return is 932% — a market-crushing outperformance compared to 211% for the S&P 500. Don't miss the latest top 10 list, available with Stock Advisor, and join an investing community built by individual investors for individual investors.

See the 10 stocks »

*Stock Advisor returns as of October 1, 2026.

Marc Guberti has positions in Netlist and Penguin Solutions. The Motley Fool has positions in and recommends Micron Technology, Nvidia, and Penguin Solutions. The Motley Fool has a disclosure policy.

  •  

Is IBM Stock a Buy?

Key Points

  • IBM's stock has dropped 22% over the last three months, but the weakness traces to a cyclical mainframe lull.

  • Big Blue's generative AI consulting book has reached $5.5 billion.

  • Shares trade at 17.3 times forward earnings and sit 31.8% below June's all-time high.

International Business Machines' (NYSE: IBM) stock isn't setting the world on fire right now. As of Oct. 1, the tech veteran's shares have dropped 2% in a month and 22% over the last quarter. Big Blue's stock is changing hands at 3.1 times trailing sales and 15.5 times free cash flow -- lukewarm multiples usually attached to slow-growth retailers rather than innovative tech giants.

Big Blue's boring advantages

Here's a fun contrast. While the biggest names in tech pour hundreds of billions of dollars into AI data centers and fight over consumers' attention, IBM is leaning back in a comfortable chair. It already owns mainframes and Linux machines that run the world's banks, and those customers aren't going anywhere.

Missed AI’s "Act 1"? Act 2 Could Be 15x Bigger. Most investors think they missed the AI boat because they didn't buy Nvidia in 2005. But according to our analysts, we’re only at the end of "Act 1"—the R&D phase. "Act 2" is the global rollout. Continue »

IBM's stability doesn't make headlines. Mainframes are cyclical, and the latest quarter was a lull. But a lull in a business that makes up only 15% of IBM's total revenues is hardly a crisis. At the same time, Red Hat's OpenShift grew 29%, and distributed infrastructure sales jumped 37% year over year. Yet, IBM's stock crashed in July after reporting record results.

I'm not done talking about IBM's unique qualities. There are consulting services, the cash-cow nobody brags about at dinner parties. IBM's generative AI consulting book alone is $5.5 billion and growing. Helping other companies figure out how to install, manage, and use AI is a tidy business when the giant companies have budget constraints.

IBM's AI strategy is refreshingly low-drama, too. There's no frontier model, no multibillion-dollar GPU land grab. Just software for the places where code can't leave the building, like the self-hosted version of its Bob development tool.

White IBM logo on a blue background.

Image source: The Motley Fool.

Paid to wait

Meanwhile, shareholders collect a 3% dividend yield while waiting. Only 2.4% of Big Blue's float is sold short, so almost nobody is betting against the stock. Almost nobody is loudly betting for it, either. At 17.3 times forward earnings and 31.8% below June's all-time peak, that seems backward.

Mainframe cycles will keep being bumpy. Patient investors can live with that. I think IBM's stock is a fantastic buy right now.

Should you buy stock in International Business Machines right now?

Before you buy stock in International Business Machines, consider this:

The Motley Fool Stock Advisor analyst team just identified what they believe are the 10 best stocks for investors to buy now… and International Business Machines wasn’t one of them. The 10 stocks that made the cut could produce monster returns in the coming years.

Consider when Netflix made this list on December 17, 2004... if you invested $1,000 at the time of our recommendation, you’d have $375,240!* Or when Nvidia made this list on April 15, 2005... if you invested $1,000 at the time of our recommendation, you’d have $1,403,292!*

Now, it’s worth noting Stock Advisor’s total average return is 933% — a market-crushing outperformance compared to 211% for the S&P 500. Don't miss the latest top 10 list, available with Stock Advisor, and join an investing community built by individual investors for individual investors.

See the 10 stocks »

*Stock Advisor returns as of October 1, 2026.

Anders Bylund has positions in International Business Machines. The Motley Fool has positions in and recommends International Business Machines. The Motley Fool has a disclosure policy.

  •  

Abbott Laboratories vs. Intuitive Surgical: Which Healthcare Stock Is a Better Buy in 2026?

Key Points

  • Abbott Laboratories offers a highly diversified revenue stream across medical devices, diagnostics, and nutrition.

  • Intuitive Surgical maintains a dominant lead in robotic-assisted surgery with high recurring revenue from instruments and services.

  • Which healthcare giant offers the better balance of growth and value for your portfolio?

As healthcare costs and procedure volumes continue to shift globally, investors must decide between two titans of the industry. Choosing between Abbott Laboratories (NYSE:ABT) and Intuitive Surgical (NASDAQ:ISRG) requires weighing diversified stability against high-growth specialized technology.

Abbott provides a broad array of medical products used in daily care, while Intuitive focuses on the specialized niche of robotic-assisted surgery. These companies are often compared because they represent different ways to invest in the future of medical technology and hospital spending.

The case for Abbott Laboratories

Abbott Laboratories operates a diversified business model that spans diabetes care, cardiovascular devices, diagnostics, and nutrition. It sells products to a wide range of customers, including hospitals, wholesalers, and government agencies, which helps it weather fluctuations in any single market. In early 2026, the company entered a definitive agreement to acquire Exact Sciences to strengthen its presence in the cancer diagnostics market.

In FY 2025, revenue reached nearly $44.3 billion, representing a growth of roughly 5.7% compared to the previous year. The company reported net income of approximately $6.5 billion for the period, resulting in a net margin of close to 14.7%. This performance reflects steady demand across its various healthcare segments, particularly in its medical device and diagnostic divisions.

Abbott maintains a stable financial position with a debt-to-equity ratio of nearly 0.3x as of its December 2025 balance sheet. This ratio, which compares total debt to shareholder equity, suggests a conservative approach to borrowing. The company also reported a current ratio of roughly 1.6x, indicating it has enough short-term assets to cover its immediate liabilities. Free cash flow, or the cash left after paying for operating costs and capital expenditures, reached approximately $7.4 billion in FY 2025.

The case for Intuitive Surgical

Intuitive Surgical is the pioneer of robotic-assisted surgery, primarily through its da Vinci and Ion systems. The company operates a "razor and blade" business model, where the initial sale of a robotic system leads to years of recurring revenue from instruments, accessories, and maintenance services. Its primary customers are hospitals and ambulatory surgery centers, and it has recently expanded its direct sales reach into several European markets to improve its medical device stocks presence.

In FY 2025, revenue reached roughly $10.1 billion, which was a significant increase of approximately 20.5% over the prior year. Net income for the same period was close to $2.9 billion, yielding a strong net margin of nearly 28.4%. This robust profitability is driven by the high volume of surgical procedures performed using its installed base of robots worldwide.

As of its December 2025 balance sheet, the company has a debt-to-equity ratio of 0.0x, indicating that shareholder equity far exceeds its total debt. Its current ratio stands at approximately 4.9x, showing a very high level of liquidity to meet short-term obligations. Free cash flow for FY 2025 was nearly $2.5 billion. Note that stock-based compensation represented roughly 26% of operating cash flow, which inflates reported cash generation since SBC is a non-cash expense added back in the cash flow statement.

Risk profile comparison

Abbott Laboratories faces risks related to its complex manufacturing and supply chain, particularly its reliance on single-source suppliers for certain products. The company is also dealing with significant ongoing litigation involving product liability claims for infant formula and potential False Claims Act allegations. Intense competition from rivals like Medtronic (NYSE:MDT) and Johnson & Johnson (NYSE:JNJ) means Abbott must constantly innovate to protect its market share in the medical device and diagnostics sectors.

Intuitive Surgical faces competition from alternative surgical approaches and new robotic entrants like Medtronic and SS Innovations International (NASDAQ:SSII). Macroeconomic pressures could lead hospitals to tighten their capital spending budgets, potentially delaying the purchase of expensive new robotic systems. Additionally, the company is vulnerable to supply chain issues involving rare earth elements and must navigate increasingly strict global regulations regarding AI-enabled medical devices and patient data privacy.

Valuation comparison

Abbott Laboratories appears to be the more conservatively priced option, while Intuitive Surgical carries a higher premium due to its faster revenue growth.

MetricAbbott LaboratoriesIntuitive Surgical
Forward P/E18.5x37.2x
P/S ratio3.8x12.9x

Valuation metrics sourced from Financial Modeling Prep (FMP) and may differ from other data providers.

The Forward P/E ratio compares the current stock price to future earnings estimates, while the P/S ratio measures the market value against sales over the past twelve months.

Which stock would I buy in 2026?

I'd go with Intuitive Surgical. Its installed base of nearly 12,000 da Vinci surgical systems is a major, durable competitive advantage in healthcare. Once a hospital has trained its surgeons on the platform and built its workflows around it, switching is rarely worth the disruption. Recurring revenue accounts for roughly 85% of total revenue, procedures grew at a strong double-digit rate in the most recent quarter, and the company beat earnings estimates by a wide margin while raising its gross margin outlook.

Abbott Laboratories deserves credit for running a well-diversified healthcare business across medical devices, diagnostics, and nutrition, and its acquisition of Exact Sciences adds a more exciting diagnostics story. For investors who want broad healthcare exposure alongside a growing dividend, it is a solid choice.

But Intuitive is growing faster, with a more focused business and a platform that keeps deepening its relationships with every hospital that adopts it. For a patient investor, that compounding advantage is worth owning.

Should you buy stock in Abbott Laboratories right now?

Before you buy stock in Abbott Laboratories, consider this:

The Motley Fool Stock Advisor analyst team just identified what they believe are the 10 best stocks for investors to buy now… and Abbott Laboratories wasn’t one of them. The 10 stocks that made the cut could produce monster returns in the coming years.

Consider when Netflix made this list on December 17, 2004... if you invested $1,000 at the time of our recommendation, you’d have $375,240!* Or when Nvidia made this list on April 15, 2005... if you invested $1,000 at the time of our recommendation, you’d have $1,403,292!*

Now, it’s worth noting Stock Advisor’s total average return is 933% — a market-crushing outperformance compared to 211% for the S&P 500. Don't miss the latest top 10 list, available with Stock Advisor, and join an investing community built by individual investors for individual investors.

See the 10 stocks »

*Stock Advisor returns as of October 1, 2026.

Sara Appino has no position in any of the stocks mentioned. The Motley Fool has positions in and recommends Abbott Laboratories, Intuitive Surgical, and Medtronic. The Motley Fool recommends the following options: long January 2028 $520 calls on Intuitive Surgical and short January 2028 $530 calls on Intuitive Surgical. The Motley Fool has a disclosure policy.

  •  

Can Oklo and NuScale Power Survive a Stock Market Crash? (Hint: Yes, but It's Complicated)

Key Points

Experts increasingly agree that nuclear energy presents a compelling long-term opportunity for investors.

Research from Bank of America projects nuclear to be a $10 trillion global opportunity over the next couple of decades. The benefits won't be evenly spread throughout the nuclear sector, however.

Missed Nvidia in 2009? This Rare Signal Is Flashing Again. In 2009, a "Double Down" signal flashed for a little-known chipmaker called Nvidia. For the first time in years, that same "Total Conviction" signal is flashing for a company 1/100th the size of Nvidia. Continue »

The majority of the nuclear renaissance will be dominated by conventional nuclear power plants. Many big tech companies, for instance, are either restarting old nuclear reactors or constructing new facilities. Starting around 2030, however, Bank of America believes a relatively new kind of nuclear energy will begin scaling: small modular reactors, or SMRs. By 2050, up to 20% of the world's nuclear power would come from SMRs.

"Amid surging electricity demand, driven in part by the rise in AI/data centers, nuclear energy offers a potential solution," concludes Bank of America's research. "And new advancements in technology may now make the tipping point in sight for small modular reactors (SMRs) to reshape nuclear energy supply chains over the next decade."

From this perspective, SMR stocks including NuScale Power (NYSE: SMR) and Oklo (NYSE: OKLO) appear like promising investments, especially considering both companies have seen their valuations drop by roughly 50% this year. But as Bank of America's research suggests, mass SMR adoption could still be decades away. With how capital-intensive the industry is, both companies could face serious challenges during a bear market or economic weakness.

Can NuScale and Oklo survive a market crash? The answer is likely yes. But understanding how a sell-off could impact each company is critical before making an investment.

Here's how NuScale and Oklo could suffer during a market crash

SMR adoption is expected to rise globally over the coming decades. Importantly, only two SMR systems are currently in commercial operation. More than 80, however, are in development.

Given this, NuScale and Oklo have yet to successfully commercialize any of their SMR designs, despite both companies having impressive customer pipelines. NuScale may not get its first SMR project online until the 2030s. Oklo may get a system online sooner, but the company isn't even approved by U.S. regulators to begin deployment. Some of Oklo's bigger projects, meanwhile, have a start date of 2030 or later.

Building nuclear power plants, even miniature ones, is capital-intensive. So until Oklo and NuScale actually get a project up and running, investors should expect both companies to continue producing losses. Last quarter, NuScale posted a net loss of roughly $355 million, whereas Oklo lost around $105 million.

A depiction of a nuclear atom in fission.

Image source: Getty Images.

This is where both Oklo and NuScale could get in trouble during a market downturn. Both companies have impressive technologies chasing lucrative long-term growth runways. But continued losses, coupled with distant revenue streams, force these nuclear developers to rely on capital markets to survive. This summer, NuScale unveiled a $750 million share sale. Weeks later, Oklo announced its own $1 billion share sale.

Share sales dilute shareholders. When equity prices are high, this dilution is less impactful. When stock market prices fall, however, dilution can be onerous.

Given each company's liquidity position, NuScale and Oklo won't be facing severe financial constraints anytime soon. If their share sales are executed as planned, insolvency risk drops even further. That should prove true even during a market correction.

What could happen during a market crash, however, is a heavy amount of shareholder dilution at rock-bottom prices. This is what investors should be worried about during a bear market.

Should you buy stock in NuScale Power right now?

Before you buy stock in NuScale Power, consider this:

The Motley Fool Stock Advisor analyst team just identified what they believe are the 10 best stocks for investors to buy now… and NuScale Power wasn’t one of them. The 10 stocks that made the cut could produce monster returns in the coming years.

Consider when Netflix made this list on December 17, 2004... if you invested $1,000 at the time of our recommendation, you’d have $375,240!* Or when Nvidia made this list on April 15, 2005... if you invested $1,000 at the time of our recommendation, you’d have $1,403,292!*

Now, it’s worth noting Stock Advisor’s total average return is 933% — a market-crushing outperformance compared to 211% for the S&P 500. Don't miss the latest top 10 list, available with Stock Advisor, and join an investing community built by individual investors for individual investors.

See the 10 stocks »

*Stock Advisor returns as of October 1, 2026.

Bank of America is an advertising partner of Motley Fool Money. Ryan Vanzo has no position in any of the stocks mentioned. The Motley Fool recommends NuScale Power. The Motley Fool has a disclosure policy.

  •  

Not Cars. Not Energy Storage. Tesla's Robotics and Robotaxi Ambitions Are the Real Reason the Stock Is Priced Like a Tech Company.

Key Points

  • Tesla shares are priced shockingly high, even by technology stock standards.

  • Given the potential profit centers the company is currently developing, however, this premium valuation makes sense.

  • It could take far longer than most investors might expect for the business to justify the stock's current valuation.

Most investors understand that you typically have to pay a premium price to buy good growth stocks. But shares of electric vehicle (EV) maker Tesla (NASDAQ: TSLA) are taking the premise to an extreme. The stock's currently priced at 200 times this year's projected earnings of $1.75 per share, and over 160 times next year's expected earnings of $2.16 per share. That's expensive by any standard, including in the technology sector.

The valuation (sort of) makes sense, though, when you understand what Tesla is in the process of becoming. Soon, it will no longer be an EV company that also makes and markets solar panels and energy-storage batteries. Instead, the plan is for it to be a robotics and robotaxi outfit that also manufactures electric vehicles. Investors are pricing the stock based on this hoped-for future rather than what the business is doing in the present. Here's what they need to know.

Missed AI’s "Act 1"? Act 2 Could Be 15x Bigger. Most investors think they missed the AI boat because they didn't buy Nvidia in 2005. But according to our analysts, we’re only at the end of "Act 1"—the R&D phase. "Act 2" is the global rollout. Continue »

Comparing and contrasting

Although the company is winding down its solar roof tile business, it still makes and markets its own solar panels, as well as the energy storage equipment that makes these panels practical power sources. Moreover, EVs remain Tesla's biggest business -- accounting for $20.5 billion of its $28.2 billion in Q2 revenue -- and Tesla is still the second-biggest name in the global EV market, right behind China's BYD. Moreover, last quarter's year-over-year top-line growth of 26% suggests the company still has a little bit of magic left.

Its stock's price, however, has left the organization's fiscal results in the rear-view mirror.

Shares aren't expensive simply because Tesla is struggling to turn its revenues into profits, to be clear. The stock's also expensive by revenue standards, trading at 13 times trailing-12-month sales versus the S&P 500's trailing price-to-sales ratio of 3.7. For further comparison, the S&P 500 is currently trading at a trailing price-to-earnings ratio of 23.5 and a forward P/E of just under 20. Based on these numbers, Tesla trades at valuations between 4 and 10 times those of the average publicly traded company.

It's not like we've never seen something like this before, though. Sometimes, a company eventually grows into such steep valuations. Think Amazon, for example.

The market's pricing in growth that hasn't even started yet

Getting straight to the point, investors are pricing in a large amount of the future growth they expect from Tesla, as opposed to pricing the stock based on the business's current results. And there are two key components to this highly anticipated future. One of them is robotaxis.

Tesla's robotaxi ride-hailing venture, which at this early stage still relies largely on its Model Y vehicles, is up and running in a handful of markets. Its purpose-built Cybercab, however, represents the next generation of this venture's tech. Although the company has only rolled out a small fleet of Cybercabs in one market so far-- Austin, Texas -- it's reportedly planning to launch Cybercab-supported robotaxi services in a dozen states before the end of this year.

Although the development of these autonomous taxis has been agonizingly slow, once they're ready for wider-spread commercialization, the deployment is apt to happen fast. This will plug Tesla into a robotaxi market that Goldman Sachs expects to grow from nearly nothing now to $415 billion globally by 2035, with $48 billion of that being generated within the United States alone.

A Tesla Cybercab is parked on the street, waiting for a passenger.

Image source: Tesla.

The other factor pumping up Tesla stock's premium valuation is arguably even more exciting. That's Tesla's entry into the AI-enabled humanoid robotics space. CEO Elon Musk suggested early this year that the company would be commercially selling its humanoid Optimus robots at scale by the end of 2027, and he hasn't said anything since to suggest that the timeline will have to be pushed back.

The commercial debut of these robots could be game-changing for the company -- not to mention the world -- in light of Musk's assessment that "Optimus will be not just Tesla's biggest product ever, but probably the biggest product ever." Although that remains to be seen, Barclays believes the market for humanoid work robots will grow to $200 billion annually by 2035. While even Musk concedes his company is facing stiff robotics competition from China, just capturing a healthy fraction of this potential business could be a boon for Tesla and its shareholders.

The growth Tesla needs from robots and robotaxis

So how much optimism about the robotics and robotaxi businesses are investors pricing in here? It's difficult to say for sure. But we can come up with a rough idea.

As it stands right now, Tesla is on pace to do on the order of $106 billion worth of EV, solar panel, and battery-storage business this year, en route to a top line of over $120 billion next year. How much more revenue would the company need to generate with robotaxis and Optimus to make its current $1.4 trillion market cap make sense? Even allowing for the type of premium valuation that many technology stocks achieve, Tesla would need a top line on the order of $300 billion to $400 billion for its current stock price to reflect a valuation in line with its peers. That's about 3 times its current sales, and most of that growth will need to come from robots and robotaxis rather than EVs and solar, as both of those businesses are now running into competitive headwinds.

Or if you want to look at the matter through the lens of earnings, Tesla's earnings per share would arguably need to quintuple -- at a minimum -- to justify the stock's current price. That would put its annual bottom line in the ballpark of $10 per share (or hopefully more) to bring the stock to a valuation that's closer to that of a typical technology company. It's likely that to deliver that type of earnings growth will take improving contributions from all of the businesses it's going to be in for the foreseeable future.

And that's just to justify the stock's price today. For Tesla shares to validly grow in value, the company will need even more top- and bottom-line growth than that.

The thing is, if the outlooks for the worldwide robotaxi and humanoid AI robot businesses are anywhere near on target, Tesla may well reach these lofty sales and earnings numbers -- eventually.

The difficult part for current shareholders and interested investors will be the waiting and the volatility stemming from the uncertainty. While Cybercab is reportedly almost ready for widespread commercialization and Tesla's Optimus robots are supposed to go into scaled-up commercial production before the end of 2027, don't forget that Musk has something of a penchant for underestimating time frames. That could leave things very unpredictable for this stock in the meantime.

Don’t miss this second chance at a potentially lucrative opportunity

Ever feel like you missed the boat in buying the most successful stocks? Then you’ll want to hear this.

On rare occasions, our expert team of analysts issues a “Double Down” stock recommendation for companies that they think are about to pop. If you’re worried you’ve already missed your chance to invest, now is the best time to buy before it’s too late. And the numbers speak for themselves:

  • Nvidia: if you invested $1,000 when we doubled down in 2009, you’d have $593,741!*
  • Apple: if you invested $1,000 when we doubled down in 2008, you’d have $63,526!*
  • Netflix: if you invested $1,000 when we doubled down in 2004, you’d have $375,240!*

Right now, we’re issuing “Double Down” alerts for three incredible companies, available when you join Stock Advisor, and there may not be another chance like this anytime soon.

See the 3 stocks »

*Stock Advisor returns as of October 1, 2026.

James Brumley has no position in any of the stocks mentioned. The Motley Fool has positions in and recommends Amazon, Goldman Sachs Group, and Tesla. The Motley Fool recommends BYD Company and Barclays Plc. The Motley Fool has a disclosure policy.

  •  

Why Constellation Energy Stock Is Rising Today

Key Points

  • Constellation has signed a new power purchase agreement for its nuclear power plant in Maryland.

  • Shares of Constellation are trading at 2.7 times trailing sales.

  • Constellation is a compelling option for conservative investors seeking exposure to nuclear energy.

Starting off October on a bullish note, Constellation Energy (NASDAQ:CEG) stock is powering higher today after the power producer announced a new power purchase agreement with Amazon.

As of 1:06 p.m. ET, shares of Constellation Energy are up 2.3%, paring back an earlier gain of 6.4%.

Missed Nvidia in 2009? This Rare Signal Is Flashing Again. In 2009, a "Double Down" signal flashed for a little-known chipmaker called Nvidia. For the first time in years, that same "Total Conviction" signal is flashing for a company 1/100th the size of Nvidia. Continue »

Stock trader celebrates with papers amid monitors displaying financial market charts.

Image source: Getty Images.

Maryland's only nuclear power plant is about to get a lot more powerful

Constellation and Amazon announced yesterday that they have inked a 20-year, 690-megawatt power agreement that will support $3 billion in facility upgrades and the expansion of the Calvert Cliffs Clean Energy Center, which includes two nuclear reactors, in Maryland.

The investment will help Constellation add about 190 megawatts between 2030 and 2032 to the facility, which currently has a 1,790-megawatt generation capacity.

Additionally, the two companies announced a related retail supply agreement to support Amazon operations in the 13-state PJM market, where electricity is bought, sold, and distributed across the Mid-Atlantic and parts of the Midwest.

Is it too late to buy Constellation stock now?

Unlike stocks of companies developing advanced nuclear reactors, Constellation stock offers investors a more conservative way to gain exposure to the nuclear renaissance the United States is currently experiencing. While shares of Constellation are bumping higher today, they have hardly soared to a valuation that would make them undesirable, trading at only 2.7 times trailing sales.

Should you buy stock in Constellation Energy right now?

Before you buy stock in Constellation Energy, consider this:

The Motley Fool Stock Advisor analyst team just identified what they believe are the 10 best stocks for investors to buy now… and Constellation Energy wasn’t one of them. The 10 stocks that made the cut could produce monster returns in the coming years.

Consider when Netflix made this list on December 17, 2004... if you invested $1,000 at the time of our recommendation, you’d have $375,240!* Or when Nvidia made this list on April 15, 2005... if you invested $1,000 at the time of our recommendation, you’d have $1,403,292!*

Now, it’s worth noting Stock Advisor’s total average return is 933% — a market-crushing outperformance compared to 211% for the S&P 500. Don't miss the latest top 10 list, available with Stock Advisor, and join an investing community built by individual investors for individual investors.

See the 10 stocks »

*Stock Advisor returns as of October 1, 2026.

Scott Levine has no position in any of the stocks mentioned. The Motley Fool has positions in and recommends Amazon and Constellation Energy. The Motley Fool has a disclosure policy.

  •  

Alphabet vs. Amazon vs. Microsoft: Which "Magnificent Seven" Stock Is the Better Buy Right Now?

Key Points

  • The ways consumers and companies use computing technologies is a big reason for the performance disparities between these tech giants.

  • Although the underlying dynamic will change again at some point, that shift is at least a couple of years away.

The truth is, in the long run, you'd probably be just fine with any of them. If you've only got room in your portfolio right now for one new position among "Magnificent Seven" members Alphabet (NASDAQ: GOOG)(NASDAQ: GOOGL), Amazon (NASDAQ: AMZN), and Microsoft (NASDAQ: MSFT), however, it should arguably be Google parent Alphabet. Here's why.

Why not Microsoft or Amazon?

If you already hold stakes in Amazon or Microsoft, you're hardly doomed. Microsoft remains the centerpiece of the personal and professional computing business, and Amazon is still the king of e-commerce as well as the leader in the cloud computing market.

Missed Nvidia in 2009? This Rare Signal Is Flashing Again. In 2009, a "Double Down" signal flashed for a little-known chipmaker called Nvidia. For the first time in years, that same "Total Conviction" signal is flashing for a company 1/100th the size of Nvidia. Continue »

In a valuation environment that leaves no room for error or weakness, however, those two bring company-specific concerns to the table that could turn into stumbling blocks.

An investor sitting at a desk in front of a laptop is reading a printed document.

Image source: Getty Images.

For Microsoft, the key concern is its waning relevancy within the workplace, or for that matter, at home. Although its productivity software titles like Word and Excel are still popular enough, Microsoft Office's dominance in the basic enterprise software arena continues to wane. It's ceding ground to Google Workspace, which is increasingly seen as less restrictive to use.

The company's also losing ground on the chat-based AI assistant front. Sure, Microsoft recently touted the fact that its Copilot app serves 30 million paying Microsoft 365 Copilot customers.

Yet take a look at the details. While this professional version of Copilot integrates nicely into the cloud-based/subscription-based version of Microsoft Office 365, the AI tool isn't necessarily being sought out by users. Rather, many of these subscribers are being added to existing Office 365 subscriptions, whether those subscribers asked for it or not (very likely at nominal additional costs). And it's still tethered to productivity software that's slowly losing market share. Meanwhile, the free-to-use consumer-facing version of Copilot only accounts for about 3% of the AI chatbot market while ChatGPT boasts a commanding share of 79%, according to data from Statcounter.

Statcounter adds that Microsoft's flagship operating system, Windows, is also losing ground. It slid to a record low market share of 63% in August thanks to soaring use of Apple's OS and even open-source Linux, both of which reached record market shares that month. In this vein, Microsoft has now reported two consecutive quarterly declines in Windows' revenue.

Connect the dots. It's not doing anything "wrong," per se. Microsoft's cloud business appears to be thriving, in fact, with revenues up 27% year over year a quarter ago, thanks to AI-driven demand. The company's just running into headwinds on too many other fronts -- even its video gaming arm, which suffered a 10% slump in revenue for the quarter ending in June.

As for Amazon, the worry is simpler and far more straightforward. It's planning on spending an enormous sum on capital investments this year -- mostly on AI infrastructure -- with no assurance that this capex will curb the deterioration in its share of the cloud computing market. Though it's on pace to shell out $220 billion on capital expenditures in fiscal 2026, numbers from Synergy Research Group indicate Amazon Web Services' market share has continued shrinking from 2020's peak of 34% to 28% as of Q2 of this year. Microsoft Azure has also been sliding, by the way. Meanwhile, third-place Google Cloud has been gaining share.

Microsoft and Amazon are both losing cloud computing market share to Alphabet's Google.

Data source: Synergy Research Group. Chart by author.

Sure, there's more to both companies than their cloud businesses. But it's difficult to deny that every technology company is prioritizing the cloud opportunities being driven by AI's growth. These two names aren't knocking it out of the park on this front.

Why Alphabet

Google parent Alphabet is knocking it out of the park on the cloud computing front, of course, reporting 82% year-over-year revenue growth for this arm during the second quarter. Whatever it's doing (particularly as it pertains to AI) is clearly working.

Moreover, unlike Microsoft and Amazon, everything else Alphabet is doing is also working well.

Take its search business as an example. Google's advertising revenue -- including YouTube -- grew by more than 14% during the second quarter, with search-based advertising revenue specifically improving 15%. Subscription-based revenue and device revenue (Google makes its own smartphones and owns the Android mobile operating system, which funnels people to the Play Store) grew by more than 15% year over year.

The company is demonstrating strength in ways that don't appear directly on its income statement, too. Statcounter's numbers suggest that Android is at least maintaining its leading share of 67% of the worldwide mobile operating system market. And within the United States, TV ratings agency Nielsen reports YouTube is the most-watched streaming platform in terms of total viewing time, and is growing its share largely at the expense of venerable Netflix.

This leadership doesn't directly generate revenue. It does, however, confirm that Alphabet is doing the things that generate revenue, and doing them well.

Now, and for a while

This won't always be the case, of course. There was a time when Microsoft could do nothing wrong. Ditto for Amazon. Those times may come again for those two, just as a time may come when macro conditions don't favor Alphabet's strengths as much.

The environment right now and for the foreseeable future, however, is one that favors Google's parent far more than it does the iconic software and e-commerce giants.

The personal computing space has been democratized, for instance, not just by more hardware choices (mobile devices are now viable alternatives to traditional desktops and laptops), but also by the wider adoption of options other than Windows or Microsoft's productivity software. Amazon's early lack of in-house technological development capabilities, meanwhile, is still a key reason its cloud business is losing share to Alphabet.

Alphabet, conversely, entered this era of connected computing ideally positioned. Not only is Google Search a perfect jumping-off point for Alphabet's AI-powered chat assistant, Gemini, but the demand for more mobile computing has turned Android into a critical platform. Recently rising streaming subscription prices have also made YouTube more attractive as a free-to-use alternative.

This backdrop and these conditions will eventually change. They aren't apt to change for a while, though, which means they should provide sustained tailwinds for Alphabet. Yes, the stock has essentially drifted since May, but this dynamic is much bigger than a few tepid months.

Should you buy stock in Alphabet right now?

Before you buy stock in Alphabet, consider this:

The Motley Fool Stock Advisor analyst team just identified what they believe are the 10 best stocks for investors to buy now… and Alphabet wasn’t one of them. The 10 stocks that made the cut could produce monster returns in the coming years.

Consider when Netflix made this list on December 17, 2004... if you invested $1,000 at the time of our recommendation, you’d have $375,240!* Or when Nvidia made this list on April 15, 2005... if you invested $1,000 at the time of our recommendation, you’d have $1,403,292!*

Now, it’s worth noting Stock Advisor’s total average return is 933% — a market-crushing outperformance compared to 211% for the S&P 500. Don't miss the latest top 10 list, available with Stock Advisor, and join an investing community built by individual investors for individual investors.

See the 10 stocks »

*Stock Advisor returns as of October 1, 2026.

James Brumley has positions in Alphabet. The Motley Fool has positions in and recommends Alphabet, Amazon, Microsoft, and Netflix. The Motley Fool has a disclosure policy.

  •  

Firefly Aerospace Is the Space Stock Nobody Is Talking About

Key Points

Firefly Aerospace (NASDAQ: FLY) is doing a lot more than launching rockets. The company is actually building an entire space transportation business around four major platforms: its Alpha rocket, Blue Ghost lunar lander, Elytra orbital vehicle, and the larger Eclipse rocket being developed with Northrop Grumman. And the numbers indicate Firefly is no slouch.

Q2 revenue reached a record $117.7 million, up 659% year over year, and management expects between $420 million and $450 million in revenue for 2026. Firefly also picked up more than half a dozen contracts during the quarter.

Missed AI’s "Act 1"? Act 2 Could Be 15x Bigger. Most investors think they missed the AI boat because they didn't buy Nvidia in 2005. But according to our analysts, we’re only at the end of "Act 1"—the R&D phase. "Act 2" is the global rollout. Continue »

To the moon!

Rocket launch.

Image source: Getty Images.

Firefly became the first commercial space company to successfully land on the moon, and it now has six contracted lunar missions. A recent $144 million NASA contract added another Blue Ghost mission, while a separate $75 million subcontract will use Firefly's Elytra spacecraft to deliver four drones to the moon's south pole.

The company is also expanding production capacity. Its new Texas cleanroom is designed to increase production of Blue Ghost and Elytra spacecraft, and it's developing a larger lunar lander capable of carrying heavier cargo, vehicles, infrastructure, and power systems to the moon.

Then there's defense. Firefly subsidiary SciTec recently won a $94 million Space Force contract, while Elytra is being developed for missions including satellite delivery, surveillance, communications, and even the removal of old satellites from orbit.

Of course, Firefly isn't a risk-free investment. The company lost $92.3 million in Q2, and developing rockets and spacecraft requires enormous amounts of capital. But Firefly doesn't need to be as big as Space Exploration Technologies or RocketLab to build a valuable business. It just needs to capture a piece of the growing market for launches, lunar missions, orbital services, and national-security space infrastructure.

With revenue accelerating and several major platforms moving deeper into production, Firefly is becoming much more than another speculative rocket company.

Should you buy stock in Firefly Aerospace right now?

Before you buy stock in Firefly Aerospace, consider this:

The Motley Fool Stock Advisor analyst team just identified what they believe are the 10 best stocks for investors to buy now… and Firefly Aerospace wasn’t one of them. The 10 stocks that made the cut could produce monster returns in the coming years.

Consider when Netflix made this list on December 17, 2004... if you invested $1,000 at the time of our recommendation, you’d have $375,240!* Or when Nvidia made this list on April 15, 2005... if you invested $1,000 at the time of our recommendation, you’d have $1,403,292!*

Now, it’s worth noting Stock Advisor’s total average return is 933% — a market-crushing outperformance compared to 211% for the S&P 500. Don't miss the latest top 10 list, available with Stock Advisor, and join an investing community built by individual investors for individual investors.

See the 10 stocks »

*Stock Advisor returns as of October 1, 2026.

Jeff Siegel has no position in any of the stocks mentioned. The Motley Fool has positions in and recommends Firefly Aerospace and Rocket Lab. The Motley Fool has a disclosure policy.

  •  

2027 COLA Countdown: Social Security Retirees Should Mark Their Calendars for Oct. 14

Key Points

There are always a few dates that Social Security retirees should mark on their calendars every year, and one of them is fast approaching.

A big part of the Social Security program is the annual cost-of-living adjustment (COLA), which determines how much a retiree's benefits will increase the following year. The goal of the COLA is to maintain the purchasing power of benefits in the face of inflation.

Missed Nvidia in 2009? This Rare Signal Is Flashing Again. In 2009, a "Double Down" signal flashed for a little-known chipmaker called Nvidia. For the first time in years, that same "Total Conviction" signal is flashing for a company 1/100th the size of Nvidia. Continue »

Projected estimates for the 2027 COLA have bounced around all year long, but on Oct. 14, retirees will finally gain some clarity.

Two people sitting at a table.

Image source: Getty Images.

COLA season is winding down

Retirees are in the midst of COLA season, which occurs in the third quarter of each year from July through September.

Because the purpose of the COLA is to maintain the purchasing power of Social Security benefits, the way the COLA is determined is through inflation data. Essentially, the Social Security Administration (SSA) and other stakeholders want benefits to rise in tandem with overall inflation.

While the market focuses on inflation metrics such as the Personal Consumption Expenditures (PCE) Price Index and the Consumer Price Index for All Urban Consumers (CPI-U), the COLA is based on the Consumer Price Index for Urban Wage Earners and Clerical Workers (CPI-W).

The CPI-W is a subset of the CPI-U and is intended to better reflect the prices of goods and services that are more relevant to retirees, although whether this benchmark actually achieves this is heavily debated among Social Security experts.

The SSA calculates the following year's COLA by averaging the CPI-W for July, August, and September and comparing it to the three-month average from the previous year. The percentage difference is the next year's COLA, and COLAs can never be negative.

Where does the COLA watch stand?

As mentioned, COLA projections have fluctuated significantly this year due to shifts in inflation expectations. At the very beginning of the year, investors expected inflation to subside and return to the Federal Reserve's 2% target, paving the way for multiple interest rate cuts this year. But then the Iran war happened, leading to soaring oil prices, which have driven up inflation.

Even excluding gas and food prices, core inflation has not yet shown a clear trend toward 2%, prompting the Federal Reserve to unanimously raise its benchmark overnight lending rate by a quarter point recently.

As a result of all this, COLA expectations have increased. In July, the CPI-W rose 3.4% on a year-over-year basis. In August, the CPI-W rose 3.5%. The nonpartisan Senior Citizens League (SCL), which closely monitors Social Security developments, now predicts the 2027 COLA at 3.5%.

Based on data from August, a 3.5% COLA would increase the average retired worker's monthly check by about $73 to roughly $2,161 per month, or by $876 annually, to total annual benefits of $25,927. A 3.5% COLA would be the highest since 2022, when benefits rose an unprecedented 8.7% due to the highest inflation in 40 years.

On Oct. 14, the U.S. Bureau of Labor Statistics will release the September reading of both the CPI-U and CPI-W, providing the final puzzle piece regarding the 2027 COLA. The Federal Reserve Bank of Cleveland's Nowcasting tool currently projects the CPI-U to rise 0.5% in September and be up nearly 3.6% year over year. That would be the highest reading since May.

Because the CPI-W is a subset of the CPI-U, it will likely be similar to whatever the CPI-U ultimately is. Oil prices have jumped this month amid volatility in negotiations between the U.S. and Iran, but as of this writing on Sept. 28, they are higher than at the start of the month.

Retirees should wait until the final CPI-W number is released before budgeting expenses for next year. They should also remember that a higher COLA is a double-edged sword. Sure, it increases benefits, but it also means the cost of living has risen, so retirees should remember to account for this when budgeting and not necessarily treat a higher COLA as more money to spend.

The $23,760 Social Security bonus most retirees completely overlook

If you're like most Americans, you're a few years (or more) behind on your retirement savings. But a handful of little-known "Social Security secrets" could help ensure a boost in your retirement income.

One easy trick could pay you as much as $23,760 more... each year! Once you learn how to maximize your Social Security benefits, we think you could retire confidently with the peace of mind we're all after. Join Stock Advisor to learn more about these strategies.

View the "Social Security secrets" »

The Motley Fool has a disclosure policy.

  •  

Better iShares Financial ETF: European-Targeted EUFN vs. IAT's U.S. Regional Banks Focus

Key Points

  • The iShares MSCI Europe Financials ETF offers a significantly higher dividend yield and has historically shown lower volatility than the iShares U.S. Regional Banks ETF.

  • The iShares U.S. Regional Banks ETF carries a lower expense ratio but is much smaller by assets under management (AUM) and more concentrated in its portfolio.

  • The European-focused fund has delivered stronger 1-year and 5-year returns while maintaining a lower maximum drawdown over the last five years.

The iShares U.S. Regional Banks ETF (NYSEMKT:IAT) and iShares MSCI Europe Financials ETF (NASDAQ:EUFN) provide targeted banking exposure, with the European fund offering broader diversification and higher income potential.

Investors looking at the financial sector often choose between domestic focus and international diversification. Comparing a regional banking fund to a broad European financial fund highlights differences in concentration, dividend potential, and risk profiles, ranging from localized U.S. credit cycles to the systemic regulatory environments of the Eurozone.

This comparison examines how investors might balance the concentrated exposure of a regional portfolio against the broader reach of developed European institutions.

Snapshot (cost & size)

MetricIATEUFN
IssueriSharesiShares
Share price$57.97 (as of 2026-09-28)$40.85 (as of 2026-09-28)
Expense ratio0.37%0.49%
1-yr return (as of 2026-09-28)12.2%25.0%
Dividend yield2.9%4.1%
Beta0.920.78
AUM$614.1 million$4.0 billion

Beta measures price volatility relative to the S&P 500; beta is calculated from monthly returns over the available fund history (up to five years). The 1-year return represents total return over the trailing 12 months. Dividend yield is the trailing-12-month distribution yield.

The iShares U.S. Regional Banks ETF maintains a cost advantage with its 0.37% expense ratio, making it a relatively efficient choice for domestic bank exposure. On the income side, the iShares MSCI Europe Financials ETF offers a more substantial yield, as its 4.1% payout provides a notable margin over the 2.9% distribution from the American fund. This yield gap of 1.22 ppt may be a deciding factor for income-focused investors.

Furthermore, with $4.0 billion in assets under management (AUM), the European fund is considerably larger than the domestic regional bank fund, which manages $614.1 million.

Performance & risk comparison

MetricIATEUFN
Max drawdown (5 yr)(55.6%)(35.2%)
Growth of $1,000 over 5 years (total return)$1,105$2,637

The iShares MSCI Europe Financials ETF aims to replicate a benchmark of companies within the financial services industry in developed European markets. Its portfolio includes 84 positions, primarily concentrated in financial services at 98%, with minor 1% allocations to technology and industrials. Its largest positions include HSBC Holdings at 9.66%, Banco Santander at 5.76%, and Allianz at 5.13%. This fund was launched in 2010, and has paid $1.65 per share over the trailing 12 months, which on its recent ~$40.85 share price works out to a 4.1% yield.

The iShares U.S. Regional Banks ETF seeks to mirror the performance of an index consisting of domestic stocks specifically within the regional banking industry. It is significantly more concentrated than its European peer, holding just 30 positions with 100% exposure to financial services. Top holdings include Us Bancorp at 15.14%, PNC Financial Services Group at 14.82%, and Truist Financial at 9.59%. This fund was launched in 2006, and has paid $1.64 per share over the trailing 12 months, which on its recent ~$57.97 share price works out to a 2.9% yield.

For more guidance on ETF investing, check out the full guide at this link.

Which looks like the better buy

The iShares MSCI Europe Financials ETF (EUFN) and iShares U.S. Regional Banks ETF (IAT) gives you very different types of exposure to the financial sector. Choosing between them comes down to whether you want to invest in the European financial market or "main street USA." That said, several additional factors may sway the decision to one fund, or you could invest in both to gain global exposure as the holdings do not overlap.

IAT's regional banks focus means you're investing in local economies within the U.S. It delivers a solid dividend yield, and smaller banks have the potential to outperform larger companies. However, those benefits come with far greater volatility, as demonstrated by the ETF's larger max drawdown. Also, its AUM is much smaller, so the liquidity isn't as great as the European-targeted fund.

EUFN is ideal for conservative investors, given its lower volatility. It's an all-around excellent ETF compared to IAT, delivering a better total return, higher dividend yield, and a greater AUM. These pros are offset by a larger expense ratio, as well as currency risks that can impact your return.

Should you buy stock in iShares Trust - iShares Msci Europe Financials ETF right now?

Before you buy stock in iShares Trust - iShares Msci Europe Financials ETF, consider this:

The Motley Fool Stock Advisor analyst team just identified what they believe are the 10 best stocks for investors to buy now… and iShares Trust - iShares Msci Europe Financials ETF wasn’t one of them. The 10 stocks that made the cut could produce monster returns in the coming years.

Consider when Netflix made this list on December 17, 2004... if you invested $1,000 at the time of our recommendation, you’d have $375,240!* Or when Nvidia made this list on April 15, 2005... if you invested $1,000 at the time of our recommendation, you’d have $1,403,292!*

Now, it’s worth noting Stock Advisor’s total average return is 933% — a market-crushing outperformance compared to 211% for the S&P 500. Don't miss the latest top 10 list, available with Stock Advisor, and join an investing community built by individual investors for individual investors.

See the 10 stocks »

*Stock Advisor returns as of October 1, 2026.

HSBC Holdings is an advertising partner of Motley Fool Money. Robert Izquierdo has no position in any of the stocks mentioned. The Motley Fool has positions in and recommends Truist Financial and U.S. Bancorp. The Motley Fool recommends HSBC Holdings. The Motley Fool has a disclosure policy.

  •  

How Do the Invesco KBW Bank ETF (KBWB) and the State Street Regional Banking Fund ETF (KRE) Compare With Each Other?

Key Points

  • Invesco KBW Bank ETF offers higher 1-year total returns and greater growth over five years than State Street SPDR S&P Regional Banking ETF.

  • While both ETFs share the same expense ratio, Invesco KBW Bank ETF has a concentrated portfolio of 26 holdings compared to 167 for State Street SPDR S&P Regional Banking ETF.

  • State Street SPDR S&P Regional Banking ETF focuses exclusively on regional banks, whereas Invesco KBW Bank ETF includes national money center banks and thrift institutions.

The State Street SPDR S&P Regional Banking ETF (NYSEMKT:KRE) and Invesco KBW Bank ETF (NASDAQ:KBWB) offer distinct paths into the banking sector, with one focusing on smaller regional players and the other targeting large national institutions.

Both funds provide exposure to U.S. financial institutions, but their portfolio construction leads to different risk-reward profiles. While the State Street fund casts a wide net across 167 smaller lenders to capture the regional banking industry, the Invesco fund provides highly concentrated exposure to 26 of the heavyweights that dominate the American financial landscape.

Snapshot (cost & size)

MetricKREKBWB
IssuerSPDRInvesco
Share price$70.55 (as of 2026-09-28)$88.66 (as of 2026-09-28)
Expense ratio0.35%0.35%
1-yr return (as of Sept. 28, 2026)12.5%14.7%
Dividend yield2.3%2.1%
Beta0.871.05
AUM$3.8 billion$6.4 billion

Beta measures price volatility relative to the S&P 500; beta is calculated from monthly returns over the available fund history (up to five years). The 1-yr return represents total return over the trailing 12 months. Dividend yield is the trailing-12-month distribution yield.

Both funds have an identical expense ratio of 0.35%, so investors may choose between them based on strategy rather than management costs. The Invesco fund offers a slightly lower dividend yield of 2.1%, compared with 2.3% for the State Street fund, reflecting a minor difference in annual income potential.

Performance & risk comparison

MetricKREKBWB
Max drawdown (5 yr)(52.7%)(49.3%)
Growth of $1,000 over 5 years (total return)$1,179$1,496

What's inside

The Invesco KBW Bank ETF concentrates on 26 holdings within the financial services sector. Its largest positions include JPMorgan Chase & Co (NYSE:JPM) at 8.10%, Wells Fargo & Co (NYSE:WFC) at 8.01%, and Morgan Stanley (NYSE:MS) at 7.77%. The fund was launched in 2011. Invesco KBW Bank ETF has paid $1.87 per share over the trailing 12 months, which, on its recent ~$89 share price, works out to a 2.1% yield.

The State Street SPDR S&P Regional Banking ETF tracks 167 holdings, focusing entirely on financial services companies. Its top holdings include United Bankshares (NASDAQ:UBSI) at 1.15%, Old National Bancorp (NASDAQ:ONB) at 1.14%, and East West Bancorp (NASDAQ:EWBC) at 1.14%. It was launched in 2006. State Street SPDR S&P Regional Banking ETF has paid $1.61 per share over the trailing 12 months, which, on its recent ~$71 share price, works out to a 2.3% yield.

For more guidance on ETF investing, check out the full guide at this link.

Which looks like the better buy

To compare the State Street SPDR S&P Regional Banking ETF (KRE) and Invesco KBW Bank ETF (KBWB), investors should consider several key details. Let's see what they tell us about each fund.

First, we should discuss how the strategies for these funds differ. Crucially, KRE is a fund that focuses on regional banks. These are smaller banking institutions that serve local communities up to entire regions. KBWB, conversely, holds national money-center bank stocks, with a few large regional banks thrown in.

Two other important factors are historical performance and income potential. As for performance, KBWB wins the head-to-head matchup. Since 2016, KBWB has generated a total return of 210%, equating to a compound annual growth rate (CAGR) of 12%. Meanwhile, KRE has delivered a total return of 111%, with a 7.8% CAGR. Both funds have underperformed the S&P 500 over this same period. Turning to income potential, KRE boasts a dividend yield of 2.32%, while KBWB offers 2.14%, giving KRE a slight edge among income-focused investors.

One final factor to weigh is cost. But in this regard, there is no difference. Both funds have an expense ratio of 0.35%, which ranks somewhat near the average for ETFs. For context, a person who invests $10,000 in either fund should expect to pay $35 per year in fees.

To conclude, although KRE and KBWB are both financial ETFs, they target specific sub-sectors of the financial landscape. KRE may be favored by investors seeking small-cap exposure or those looking to derive more income from their investments. KBWB is an option for investors seeking concentrated exposure to major U.S. banks.

Should you buy stock in Invesco Exchange-Traded Fund Trust II - Invesco Kbw Bank ETF right now?

Before you buy stock in Invesco Exchange-Traded Fund Trust II - Invesco Kbw Bank ETF, consider this:

The Motley Fool Stock Advisor analyst team just identified what they believe are the 10 best stocks for investors to buy now… and Invesco Exchange-Traded Fund Trust II - Invesco Kbw Bank ETF wasn’t one of them. The 10 stocks that made the cut could produce monster returns in the coming years.

Consider when Netflix made this list on December 17, 2004... if you invested $1,000 at the time of our recommendation, you’d have $375,240!* Or when Nvidia made this list on April 15, 2005... if you invested $1,000 at the time of our recommendation, you’d have $1,403,292!*

Now, it’s worth noting Stock Advisor’s total average return is 933% — a market-crushing outperformance compared to 211% for the S&P 500. Don't miss the latest top 10 list, available with Stock Advisor, and join an investing community built by individual investors for individual investors.

See the 10 stocks »

*Stock Advisor returns as of October 1, 2026.

Wells Fargo is an advertising partner of Motley Fool Money. JPMorgan Chase is an advertising partner of Motley Fool Money. Jake Lerch has positions in SPDR Series Trust - State Street SPDR S&P Regional Banking ETF. The Motley Fool has positions in and recommends JPMorgan Chase. The Motley Fool has a disclosure policy.

  •  

Royalty Pharma Owns a Piece of 16 Blockbuster Drugs -- Is the Stock a Buy?

Key Points

  • Royalty Pharma offers exposure to a diversified portfolio of promising drug products and candidates.

  • Its approach provides an optimal way to gain exposure to solid returns with minimal downside risk.

  • If results stay in line with expectations, Royalty Pharma could surge again on multiple expansion.

Whether it's biotech stocks or regular pharmaceutical stocks, when investors buy a particular name in healthcare, they are making a wager on a single company's pipeline. However, there is one unique name within this space that enables investors to gain more diversified exposure to current and potential future blockbuster drugs: Royalty Pharma (NASDAQ: RPRX).

Operating like both a biopharma company and a venture capital firm, Royalty provides capital to both for-profit drugmakers and nonprofit researchers, such as universities, in exchange for percentage ownership in their developed or underdeveloped drug candidates.

Missed Nvidia in 2009? This Rare Signal Is Flashing Again. In 2009, a "Double Down" signal flashed for a little-known chipmaker called Nvidia. For the first time in years, that same "Total Conviction" signal is flashing for a company 1/100th the size of Nvidia. Continue »

With the stock trading at a relatively low valuation, despite owning royalty interests in 16 blockbuster drugs, not to mention a slew of promising drug candidates, much suggests this is a gem among healthcare stocks that's still getting discovered by the market.

Two biotech researchers discuss clinical trial results in a lab.

Image source: Getty Images.

Three reasons why Royalty Pharma is a drug stock standout

I know what you are thinking: Why buy Royalty Pharma when investors can simply buy multiple drug stocks?

For one, while you could go ahead and attempt to build a diversified portfolio of drug candidate stocks, why not let Royalty Pharma's management team do the heavy lifting for you? Operating with a lean overhead that accounts for only 5.5%-6.5% of portfolio receipts, Royalty Pharma offers a team of experienced pharmaceutical executives and capital allocators dedicated to investing in royalty deals that generate solid returns on invested capital.

This brings us to Royalty Pharma's second key strength: the advantageous way that it structures its royalty deals. A prime example of this is one of the company's latest unsuccessful investments. In September, Novartis and its biotech partner Ionis Pharmaceuticals unveiled disappointing clinical trial data for its experimental heart drug pelacarsen.

Royalty Pharma, through a prior funding agreement with Ionis, held a royalty interest in pelacarsen, but just because this candidate failed doesn't mean Royalty is out of its investment. As disclosed in a Sept. 4 press release, the funding deal coupled exposure to pelacarsen with ownership in "stable and predictable" royalties from another drug, Spinraza. In short, while pelacarsen's failure limits upside potential, the company still expects to generate a positive return from this investment.

Third, thanks to the favorable way Royalty Pharma structures deals and manages risk, it has built a long track record of double-digit annualized returns on invested capital. As noted in its latest quarterly earnings release, Royalty Pharma's average return on invested capital and equity was 14.9% and 21.5%, respectively, between 2019 and 2025. For Q2 2026, these figures stood at 14.2% and 20.1%, respectively. During the quarter, management also reported 14% growth in royalty receipts.

An overlooked gem still entering prime time

Since the start of the year, Royalty Pharma shares have surged over 50%. Price discovery is clearly taking shape as investors catch on to this company's unique strengths and impressive track record.

However, don't assume price discovery has completed just yet. Based on analyst estimates calling for adjusted earnings per share (EPS) of $5.34 during 2026 and $5.73 during 2027, Royalty Pharma seems like it's at the lower end of the valuation range among biopharma stocks. Yes, critics can counter this by pointing out that these strong adjusted earnings are relatively recent. For 2023, 2024, and 2025, Royalty Pharma reported EPS of $2.54, $1.93, and $1.80 per share, respectively.

However, with the company now scaled up and generating steady royalties and portfolio receipts from its blockbuster drugs, shares could be in for some serious multiple expansion if it meets or beats the aforementioned analyst forecasts. Established, profitable biotechs such as Amgen and Regeneron Pharmaceuticals trade at price-to-earnings (P/E) multiples in the high teens and low 20s.

Sure, contrary to this bull case, there are numerous long-term risks with Royalty Pharma. The company regularly issues new shares to finance expansion. In time, this dilution could weigh on long-term returns. Growing competition in the pharma royalty investment space could affect future returns.

Nevertheless, until Royalty Pharma's fiscal results and guidance more strongly reflect these risks, err on the side of optimism and consider this a long-term buy for investors seeking exposure to pharmaceutical stocks.

Should you buy stock in Royalty Pharma Plc right now?

Before you buy stock in Royalty Pharma Plc, consider this:

The Motley Fool Stock Advisor analyst team just identified what they believe are the 10 best stocks for investors to buy now… and Royalty Pharma Plc wasn’t one of them. The 10 stocks that made the cut could produce monster returns in the coming years.

Consider when Netflix made this list on December 17, 2004... if you invested $1,000 at the time of our recommendation, you’d have $375,240!* Or when Nvidia made this list on April 15, 2005... if you invested $1,000 at the time of our recommendation, you’d have $1,403,292!*

Now, it’s worth noting Stock Advisor’s total average return is 933% — a market-crushing outperformance compared to 211% for the S&P 500. Don't miss the latest top 10 list, available with Stock Advisor, and join an investing community built by individual investors for individual investors.

See the 10 stocks »

*Stock Advisor returns as of October 1, 2026.

Thomas Niel has no position in any of the stocks mentioned. The Motley Fool has positions in and recommends Amgen, Ionis Pharmaceuticals, and Regeneron Pharmaceuticals. The Motley Fool has a disclosure policy.

  •  

Why Synopsys Stock Soared on Thursday

Key Points

  • Synopsys gave revenue guidance as high as $11.2 billion in its just-concluded Investor Day.

  • Analysts expect the company to produce only $9.7 billion in 2026 revenue.

  • Free cash flow next year should be about $3.1 billion.

Synopsys (NASDAQ:SNPS) stock, which makes design and simulation software for pre-production work on semiconductors, jumped 12.5% through 10:20 a.m. Thursday, after telling investors at its Investor Day that it expects to grow revenue as much as 15%, to $11.2 billion, in 2027.

Analysts polled by S&P Global Market Intelligence forecast only $9.7 billion in 2026 revenue and $11 billion in 2027.

Missed Nvidia in 2009? This Rare Signal Is Flashing Again. In 2009, a "Double Down" signal flashed for a little-known chipmaker called Nvidia. For the first time in years, that same "Total Conviction" signal is flashing for a company 1/100th the size of Nvidia. Continue »

Rising financial chart over a green world map and stock market data

Image source: Getty Images.

What else Synopsys said about 2027

Synopsys targets a 20.7% operating profit margin in 2027. Non-GAAP margins, which have been much stronger for the company lately, will remain so; management claims its non-GAAP margin will average 44% next year.

These widely diverging accounting treatments will continue to produce widely diverging totals for Synopsys's profits. Under GAAP, the company expects to earn only $8.16 to $8.61 per share next year, but under non-GAAP, it says profits will range from $19.04 to $19.12 per share.

Which number should investors focus on?

That above is the $64,000 question. Do you value Synopsys based on its all-too-fudgeable non-GAAP earnings, or stick with tried and true generally accepted accounting principles (GAAP)? Pick the former, and Synopsys stock will look reasonably priced at a price-to-earnings ratio of about 25.4. Give Synopsys credit only for its GAAP earnings, however, and Synopsys stock is going to look awfully expensive at nearly 58 times forward earnings!

This would be a difficult decision except for one thing: A third valuation metric, price-to-free cash flow, happens to align almost exactly with P/E using non-GAAP earnings.

Valued on its free cash flow, which management estimates will be $3.1 billion in 2027, Synopsys costs just a little over 25 times FCF. With analysts forecasting that Synopsys will average 22% earnings growth over the next five years, that seems like a fair price to me.

Should you buy stock in Synopsys right now?

Before you buy stock in Synopsys, consider this:

The Motley Fool Stock Advisor analyst team just identified what they believe are the 10 best stocks for investors to buy now… and Synopsys wasn’t one of them. The 10 stocks that made the cut could produce monster returns in the coming years.

Consider when Netflix made this list on December 17, 2004... if you invested $1,000 at the time of our recommendation, you’d have $375,240!* Or when Nvidia made this list on April 15, 2005... if you invested $1,000 at the time of our recommendation, you’d have $1,403,292!*

Now, it’s worth noting Stock Advisor’s total average return is 933% — a market-crushing outperformance compared to 211% for the S&P 500. Don't miss the latest top 10 list, available with Stock Advisor, and join an investing community built by individual investors for individual investors.

See the 10 stocks »

*Stock Advisor returns as of October 1, 2026.

Rich Smith has no position in any of the stocks mentioned. The Motley Fool has positions in and recommends Synopsys. The Motley Fool has a disclosure policy.

  •  

Here's What a $10,000 Investment in SpaceX Stock Could Be Worth in 2035 (Hint: It's a Lot)

Key Points

  • SpaceX's growth over the next several years is likely to be driven by its AI infrastructure and Starlink broadband business.

  • While there are a wide number of possible outcomes for the stock, many analysts expect SpaceX to be trading significantly higher by 2035.

When Space Exploration Technologies (NASDAQ: SPCX) debuted this past June, it drew significant investor attention. While the stock traded like a roller coaster in the early days, it has settled into a fairly narrow trading range over the past month. This makes now a great time to evaluate what the future could hold for this visionary company. At its current price of around $151, a $10,000 initial investment would buy you around 66 shares.

Over the next several years, SpaceX's growth will likely be driven by its AI computing leasing business and its satellite internet business, Starlink. SpaceX has been investing aggressively in building out its AI infrastructure, and it's basically created its own neocloud unit that rents out its excess compute power. As a bridge provider of compute power in a world with an insatiable appetite for it, SpaceX has been getting incredible short-term rates.

Missed Nvidia in 2009? This Rare Signal Is Flashing Again. In 2009, a "Double Down" signal flashed for a little-known chipmaker called Nvidia. For the first time in years, that same "Total Conviction" signal is flashing for a company 1/100th the size of Nvidia. Continue »

This is leading to strong returns for the business, with SpaceX saying it is getting a payback on its AI infrastructure investments in about a year. It recently signed a $1.1 billion per month compute deal, and said that it could potentially double the number of graphics processing units (GPUs) installed in its Colossus 2 supercomputer by year's end. Analysts see big upsides from these investments: Evercore projects that this investment could push SpaceX's AI solutions and infrastructure revenue to $83 billion in 2027, versus the $47 billion consensus. TD Cowen, meanwhile, projected that SpaceX will lease out up to 49% of its AI computing capacity through 2031.

Starlink also remains a growth driver. This is a great recurring revenue business, and it's growing quickly. Last quarter, the segment's revenue surged 66% year over year to $4.3 billion, while its number of subscribers doubled to 12 million. It continues to have a large opportunity, including in the consumer, enterprise (airlines and mobile partnerships), and government sectors.

Beyond these two businesses, the picture gets both murkier and more exciting. The company just completed the 14th test flight of its Starship rocket, which could be the gateway for it to generate significant other revenue streams, including from data center satellites in Earth orbit. It's also working with Nvidia on AI infrastructure that can withstand the rigors of space. The optionality of these potential ventures should keep the stock's valuation multiples high.

SpaceX logo.

Image source: The Motley Fool.

What a $10,000 investment could be worth in 2035

By 2035, analysts anticipate that SpaceX will produce nearly $2.25 trillion in annual revenue and be highly profitable, generating adjusted earnings per share (EPS) of $41.24. Now, the further out you go, the more variables there are, and that is reflected in analysts' revenue estimates, which range from $1 trillion to slightly over $3 trillion.

When it comes to the question of how the market might be valuing SpaceX at that point, we can look to Musk's other public company, Tesla, for hints. In the first half of 2020, it traded at price-to-sales (P/S) ratios in the 3 to 8 range. Using the low and high ends of analyst revenue forecasts and Tesla's historical multiple range would value SpaceX at a market cap between $3 trillion and $24 trillion. Based on the $2.25 trillion consensus, meanwhile, it would be valued between $6.75 trillion and $18 trillion.

Given that SpaceX's future revenues will be highly dependent on it making considerable capital expenditures up front, we should assume there will be share dilution along the way. Let's assume the company's diluted share count will increase 1% a year (between capex and share compensation) to around 14.4 billion. That would value its stock at between $210 and $1,670 using the low and high ends of analyst estimates and Tesla's multiple. Using just the consensus revenue estimate, the stock would trade between $470 and $1,250.

That's a wide range, so if we want to just take the consensus and use a reasonable P/S multiple of 5, the stock would trade at around $780. That's over a fivefold increase from current prices, turning a $10,000 investment into around $51,500.

Now, SpaceX is going to have to execute, and there are a wide variety of outcomes, but it looks like this AI stock has plenty of long-term upside from here.

Should you buy stock in Space Exploration Technologies right now?

Before you buy stock in Space Exploration Technologies, consider this:

The Motley Fool Stock Advisor analyst team just identified what they believe are the 10 best stocks for investors to buy now… and Space Exploration Technologies wasn’t one of them. The 10 stocks that made the cut could produce monster returns in the coming years.

Consider when Netflix made this list on December 17, 2004... if you invested $1,000 at the time of our recommendation, you’d have $375,240!* Or when Nvidia made this list on April 15, 2005... if you invested $1,000 at the time of our recommendation, you’d have $1,403,292!*

Now, it’s worth noting Stock Advisor’s total average return is 933% — a market-crushing outperformance compared to 211% for the S&P 500. Don't miss the latest top 10 list, available with Stock Advisor, and join an investing community built by individual investors for individual investors.

See the 10 stocks »

*Stock Advisor returns as of October 1, 2026.

Geoffrey Seiler has no position in any of the stocks mentioned. The Motley Fool has positions in and recommends Evercore and Tesla. The Motley Fool has a disclosure policy.

  •  

Warren Buffett's Successor Has Billions Invested in These 2 Tech Stocks. Here's the Better Buy.

Key Points

Warren Buffett built Berkshire Hathaway (NYSE: BRKA) (NYSE: BRKB) into the empire that it is today. While he's starting to step away from the company completely, the mark he has left on the investing practices and portfolio of the businesses will last for generations.

Buffett made investments in countless stocks, but some of the biggest are Apple (NASDAQ: AAPL) and Alphabet (NASDAQ: GOOG) (NASDAQ: GOOGL). Right now, Apple is the conglomerate's biggest holding, accounting for about $66 billion in invested assets. Between both share classes of Alphabet stock, it's Berkshire's third-largest holding, making up about $37.8 billion in assets.

Missed Nvidia in 2009? This Rare Signal Is Flashing Again. In 2009, a "Double Down" signal flashed for a little-known chipmaker called Nvidia. For the first time in years, that same "Total Conviction" signal is flashing for a company 1/100th the size of Nvidia. Continue »

These are two high-conviction investments for Berkshire, but if it had to start from scratch, which one would it choose today? Let's find out.

Warren Buffett at a conference.

Image source: The Motley Fool.

How much is AI a factor?

The biggest question many investors must answer right now is: How much of an AI investor do you want to be? AI is shaping the stock market right now due to the sheer volume of money being invested in the technology. While there are countless people who are bullish on the prospects of AI and what it can do, there are still many who are skeptical. Depending on what side of the coin you fall on, Apple or Alphabet may be a better stock pick.

There are very few companies that can match the level of investment Alphabet has in AI. It has completely reshaped its company around AI, and nearly every new feature it rolls out is AI-focused. It transformed its Google Search platform to include AI overviews, is heavily investing in developing its Gemini family of large language models, and is spending hundreds of billions of dollars on data centers to increase capacity for internal use as well as for external use that can be rented out via Google Cloud.

Alphabet is absolutely an AI investment, and if AI blows up in a good way, it will be slated to deliver monster returns on its investment. On the flip side, if AI blows up in a bad way and doesn't live up to the hype, Alphabet's investment will be a waste of money and could plunge the stock significantly from its current levels.

Apple is not taking the same AI approach. Apple has had a very measured rollout of its AI products, and really hasn't done a ton to implement advanced AI technology. It just rolled out a new Siri upgrade, integrating new AI technology.

However, there are still countless AI features that can be accessed via various AI apps that Apple has chosen not to invest in, and it may have missed a major opportunity to create an AI subscription. Apple may not always be first to the party, but it tends to bring a very refined version of its product when it does. A major AI feature set may be coming, but investors are still waiting to see it now.

With Apple's current AI positioning, if AI goes bust soon, it won't really have lost out on much. If it takes off, Apple could be left in the dust.

Buffett is a value investor

The two companies' future with AI integration is up in the air, but one thing that's not up for debate is their price tags.

Buffett is a famed value investor and doesn't like to invest in stocks that are too expensive. However, he bends his own rules sometimes; Apple is one of the more expensive stocks in the market. This is likely because Apple has become somewhat of a haven for investors who want to avoid investing in AI-focused businesses, but it may have reached a level where it's priced too highly.

To value these two, I'm going to use operating income, as Alphabet's price-to-earnings ratio is likely skewed due to a huge gain on investment. From this standpoint, Apple is more expensive.

AAPL Operating PE Ratio Chart

AAPL Operating PE Ratio data by YCharts

So, Alphabet may be a better bargain right now, but is it the better buy? From my perspective, yes. I think Apple is in a precarious spot, with it missing out on the early phase of AI, and this could be a problem moving forward. Alphabet is well positioned to benefit from AI, and, with it priced cheaply, it's the better buy.

Should you buy stock in Alphabet right now?

Before you buy stock in Alphabet, consider this:

The Motley Fool Stock Advisor analyst team just identified what they believe are the 10 best stocks for investors to buy now… and Alphabet wasn’t one of them. The 10 stocks that made the cut could produce monster returns in the coming years.

Consider when Netflix made this list on December 17, 2004... if you invested $1,000 at the time of our recommendation, you’d have $375,240!* Or when Nvidia made this list on April 15, 2005... if you invested $1,000 at the time of our recommendation, you’d have $1,403,292!*

Now, it’s worth noting Stock Advisor’s total average return is 933% — a market-crushing outperformance compared to 211% for the S&P 500. Don't miss the latest top 10 list, available with Stock Advisor, and join an investing community built by individual investors for individual investors.

See the 10 stocks »

*Stock Advisor returns as of October 1, 2026.

Keithen Drury has positions in Alphabet. The Motley Fool has positions in and recommends Alphabet, Apple, and Berkshire Hathaway. The Motley Fool has a disclosure policy.

  •  

Sam Altman's OpenAI Paused AI Training for the Second Time in 3 Months After Agents Escaped a Secure Sandbox and Accessed U.S. Government Websites. Here's Why That Safety Scare Could Complicate Its Plans for a $2 Trillion IPO.

Key Points

  • If OpenAI goes public at a $2 trillion valuation, it will be the largest IPO in stock market history.

  • Another AI agent performing a training exercise escaped its OpenAI sandbox and reached outside servers.

  • Incidents of AI agents going rogue could make it much harder for OpenAI to attract the enterprise customers it will need to justify a megacap valuation.

ChatGPT developer OpenAI has been ramping up for what could be the largest initial public offering (IPO) in stock market history. The company is aiming for a $2 trillion valuation, which would make it one of the world's 10 most valuable public companies.

Unfortunately for OpenAI, this week it revealed yet another incident in which one of the AI agents it's training went rogue, and news of that incident is casting added light on the growing pains of developing modern AI. But what might it mean for OpenAI's IPO?

Missed Nvidia in 2009? This Rare Signal Is Flashing Again. In 2009, a "Double Down" signal flashed for a little-known chipmaker called Nvidia. For the first time in years, that same "Total Conviction" signal is flashing for a company 1/100th the size of Nvidia. Continue »

Digital floating icons with Agentic AI above an opened laptop.

Image source: Getty Images.

So, what exactly happened?

AI chatbots are good for things like creating recipes or workouts, but AI agents are autonomous tools designed to execute multistep tasks without human intervention. Most AI agent models (and other experimental software) are trained in digital sandboxes that are isolated from the broader internet to prevent them from accessing and potentially impacting systems in the "real world."

Sometimes, though, those AI agents go rogue, disregard instructions, and successfully find ways to escape from their sandboxes in pursuit of their goals. In July, about 1,200 OpenAI agents broke loose, and over 700 of them joined forces to hack the systems of AI platform Hugging Face. It was just one of a growing number of revealed cases of AI agents escaping their sandboxes and reaching outside servers, including some government systems.

In this most recent rogue AI incident, an agent found a way to make contact with external systems that it was not supposed to reach. An alert was sent to OpenAI teams within 15 minutes, but the automatic "kill switch" -- which was supposed to immediately terminate the connection -- didn't work, and it took engineers two and a half hours to fix it. The AI agent had no malicious intent, but anytime autonomous software can break containment, it's not ideal.

After that incident, OpenAI stopped training its newest models, and now the company says it's shelving the release of its latest AI model due to safety concerns identified during internal testing. Saachi Jain, head of safety systems at OpenAI, said it "didn't quite meet the bar."

What this means for OpenAI's potential IPO

You can make the case that OpenAI isn't a $2 trillion company in any shape. However, in order to justify that valuation to investors, the company would need to demonstrate traction with enterprise customers; consumer subscriptions alone won't suffice.

Large enterprise customers are typically risk averse, and with news about these "AI misalignment" issues fresh in people's minds, you'd expect many corporate leadership teams to have some reservations. This is especially true for healthcare, financial services, and government clients that handle sensitive customer data. If OpenAI can't guarantee its AI agents will stick to acting within the rules they're given, it could have a hard time convincing big-time decision-makers to spend big-time money on them.

Rogue AI incidents like OpenAI's most recently revealed one also bring more scrutiny from regulators, many of which are already pushing for governments to take a more active role in AI oversight. Whether legislation to make that happen eventually gets passed remains to be seen, but events like the recent sandbox escape give regulators more ammunition in their argument for implementing stricter protocols.

This singular event won't derail OpenAI's IPO plans, but it does shine a light on areas the company needs to tighten up before going public.

Where to invest $1,000 right now

When our analyst team has a stock tip, it can pay to listen. After all, Stock Advisor’s total average return is 933%* — a market-crushing outperformance compared to 211% for the S&P 500.

They just revealed what they believe are the 10 best stocks for investors to buy right now, available when you join Stock Advisor.

See the stocks »

*Stock Advisor returns as of October 1, 2026.

The Motley Fool has a disclosure policy.

  •  

3 High-Yield Financial Stocks to Buy in October

Key Points

  • Ares’ BDC business benefits from higher interest rates.

  • Brookfield Asset Management’s asset-light business will flourish in this market.

  • Strategy’s Strife shares are a safer way to profit from its Bitcoin buying spree.

With the 10-Year Treasury yield hovering near 5.3%, it might seem like a risky time to buy high-yielding dividend stocks in the financial sector. In this environment, many investors would rather buy a low-risk Treasury or CD instead of a dividend stock.

However, there are still plenty of high-yielding financial stocks that are well-insulated from higher interest rates and Treasury yields. Let's take a look at three of them -- Ares Capital (NASDAQ: ARCC), Brookfield Asset Management (NYSE: BAM), and Strategy's (NASDAQ: MSTR) STRF shares (NASDAQ: STRF) -- and see why they're still worth buying.

Missed Nvidia in 2009? This Rare Signal Is Flashing Again. In 2009, a "Double Down" signal flashed for a little-known chipmaker called Nvidia. For the first time in years, that same "Total Conviction" signal is flashing for a company 1/100th the size of Nvidia. Continue »

An investor checks stocks across multiple screens.

Image source: Getty Images.

Ares Capital

Ares Capital, the world's largest business development corporation (BDC), finances smaller "middle market" companies that struggle to secure loans from conventional banks. In exchange for taking on that higher risk, it charges higher interest rates.

To reduce its risk, it spreads its $29.3 billion investment portfolio across 619 companies. It also allocates 59% of its portfolio to first-lien secured loans and 4% to second-lien secured loans.

Like banks, BDCs generally benefit from higher interest rates, which boost their net interest income. But those rates can't jump too high, or they'll adversely impact their portfolio companies. BDCs also must pay out at least 90% of their taxable income as dividends to maintain a lower tax rate. That's why Ares pays a high forward yield of 10%.

Analysts expect Ares' EPS to rise only 1% to $1.93 next year, which will cover its forward dividend rate of $1.92. At $19, its stock looks like a bargain at 10 times next year's earnings. So if you're looking for a simple, rate-resistant income play, Ares checks the right boxes.

Brookfield Asset Management

Brookfield Asset Management, one of the world's largest asset managers, was spun off from the financial conglomerate Brookfield Corporation (NYSE: BN) in 2022.

As a stand-alone company, Brookfield Asset Management operates as a "pure play" asset manager that raises the capital for Brookfield Corporation's investments and manages them. It doesn't actually buy or own Brookfield's assets -- it merely holds the rights to manage those properties and all the capital pooled together by its parent company and other investors. That business model also makes it more resistant to higher interest rates than its parent company.

Brookfield Asset Management is valued by its fee-related earnings (FRE) per share, or the recurring fees that fund its dividends. Its FRE per share rose 22% in 2025, and analysts expect that figure to rise 14%-17% to $2.10-$2.15 per share in 2026.

That should easily cover its forward dividend rate of $2.01 per share, which translates to a forward yield of 4.5%. At $44, it looks reasonably valued at 21 times this year's FRE per share.

Strategy's STRF shares

Strategy, the world's largest corporate holder of Bitcoin (CRYPTO: BTC), issued four classes of preferred stock last year. All four of these stocks pay high dividends, but "Strife" (STRF) -- which was launched last March -- is arguably the safest.

Strife ranks first in seniority among Strategy's four classes of preferred shares, and it's junior only to its corporate debt. It pays a fixed 10% annual dividend every quarter, and it's cumulative -- which means that any missed payments will accrue and must be repaid with step-up penalties before Strategy can resume its other dividend payments.

Strategy initially issued these preferred shares to fund its Bitcoin purchases, but it also periodically sells its Bitcoin holdings to fund the dividends. So if you're bullish on Bitcoin but also want to earn some extra income from Strategy's Bitcoin hoarding strategy, Strategy's STRF stock -- which has risen 13% since its launch -- might be a hidden high-yield gem.


Should you buy stock in Ares Capital right now?

Before you buy stock in Ares Capital, consider this:

The Motley Fool Stock Advisor analyst team just identified what they believe are the 10 best stocks for investors to buy now… and Ares Capital wasn’t one of them. The 10 stocks that made the cut could produce monster returns in the coming years.

Consider when Netflix made this list on December 17, 2004... if you invested $1,000 at the time of our recommendation, you’d have $375,240!* Or when Nvidia made this list on April 15, 2005... if you invested $1,000 at the time of our recommendation, you’d have $1,403,292!*

Now, it’s worth noting Stock Advisor’s total average return is 933% — a market-crushing outperformance compared to 211% for the S&P 500. Don't miss the latest top 10 list, available with Stock Advisor, and join an investing community built by individual investors for individual investors.

See the 10 stocks »

*Stock Advisor returns as of October 1, 2026.

Leo Sun has no position in any of the stocks mentioned. The Motley Fool has positions in and recommends Ares Capital, Bitcoin, Brookfield Asset Management, and Brookfield Corporation. The Motley Fool has a disclosure policy.

  •  

Micron's Next Big AI Opportunity Could Have 2 Legs

Key Points

  • Micron's CEO noted, following the company's Sept. 30 earnings call, that robotics and physical AI could be a major driver of demand by the end of the decade.

  • That could potentially mean "server-level memory into millions of machines" outside of data centers, according to a Wall Street analyst.

  • Micron is one of the best-performing stocks in the S&P 500 this year, and it may just be getting started.

Micron Technology (NASDAQ:MU) has been one of the best-performing stocks in the S&P 500 this year, as it plays a critical role in the growth of artificial intelligence and the infrastructure that powers the technology. Micron is the only major U.S.-based manufacturer of high-bandwidth memory that is needed for AI, and that's pushed Micron stock up more than 265% this year.

But following the company's earnings report for its fiscal fourth quarter of 2026, CEO Sanjay Mehrotra identified another fascinating growth opportunity for Micron -- robotics. To be specific, humanoid robots that utilize AI.

Missed AI’s "Act 1"? Act 2 Could Be 15x Bigger. Most investors think they missed the AI boat because they didn't buy Nvidia in 2005. But according to our analysts, we’re only at the end of "Act 1"—the R&D phase. "Act 2" is the global rollout. Continue »

Speaking to analysts on the company's earnings call, Mehrotra cited the growth of physical AI through autonomous vehicles, which he says require more than 200 gigabytes of memory and multiple terabytes of storage.

"Humanoid robots are expected to have comparable memory and storage requirements to autonomous vehicles," Mehrotra said. "With the anticipated increase in both units and memory content, physical AI can become a significant driver of memory and storage demand by the end of this decade. Several physical AI customers are sampling our next-generation products, and we are increasing investments in our technology roadmap to ensure we are prepared to capitalize on this opportunity."

Rows of humanoid robots working on laptops in a modern office

Image source: Getty Images.

Micron is already seeing huge increases in revenue and profits from growing demand from data centers. If growth in physical AI, such as robotics and autonomous vehicles, continues to increase, Micron could be looking at the beginning of a very long growth cycle.

About Micron stock

There are two major types of memory -- NAND, which is for long-term storage; and DRAM (dynamic random-access memory), which holds information for the short term. Think of it like this: your laptop needs DRAM to hold data while an app or program is running, and NAND holds data after your device is turned off.

DRAM provides fast access to the data that processors need, and high-bandwidth memory, a specialized form of DRAM, delivers the extremely high data-transfer speeds required by AI processors. Whether AI is operating in a data center or helping to power a robot, DRAM plays a critical role.

Revenue in the fiscal fourth quarter (ending Sept. 3) was $54.23 billion, up 379% from a year ago and 31% on a sequential basis. Micron reported net income of $37.7 billion, an increase of 1,077% from the previous year. Diluted earnings per share came in at $32.87 versus $2.83 per share last year.

Full-year revenue was $133.19 billion, up from $37.38 billion a year ago. Diluted earnings exploded to $74.33 per share, up from $7.59 per share in fiscal 2025.

Micron saw strong growth in all of its business units.

Unit Q4 2026 Q4 2025 Percentage Gain
Cloud Memory $16.28 billion $4.54 billion 258%
Core Data Center $18.0 billion $1.58 billion 1,041%
Mobile and Client $13.11 billion $3.76 billion 248%
Automotive and Embedded $6.82 billion $1.43 billion 375%

Source: Micron

"Micron delivered record fiscal 2026 results, and we expect an even stronger fiscal 2027," Mehrotra said. Management issued guidance for revenue between $60 billion and $63 billion for the first quarter of fiscal 2027. The midpoint would represent a 339% increase from Q1 2026, when Micron recorded revenue of $13.64 billion.

What do AI robots potentially mean for Micron?

According to Futurum Equities analyst Shay Boloor, the potential is large. In a post on X, Boloor noted that adding 200 gigabytes of DRAM -- the amount used by autonomous vehicles -- to humanoid robots is "effectively putting server-level memory into millions of machines outside the data center."

And robotics is not far-fetched. Tesla has huge plans for its Optimus robots, which CEO Elon Musk plans to make commercially available and capable of household chores, caring for children, and caring for the elderly. Tesla has shut down its Model S and Model X electric vehicle lines to ramp up Optimus production.

Humanoid robotics represents a potentially lucrative market for Micron, which is already seeing incredible growth for its memory products. That could extend Micron's growth window well beyond the current AI infrastructure build-out.

Should you buy stock in Micron Technology right now?

Before you buy stock in Micron Technology, consider this:

The Motley Fool Stock Advisor analyst team just identified what they believe are the 10 best stocks for investors to buy now… and Micron Technology wasn’t one of them. The 10 stocks that made the cut could produce monster returns in the coming years.

Consider when Netflix made this list on December 17, 2004... if you invested $1,000 at the time of our recommendation, you’d have $375,240!* Or when Nvidia made this list on April 15, 2005... if you invested $1,000 at the time of our recommendation, you’d have $1,403,292!*

Now, it’s worth noting Stock Advisor’s total average return is 933% — a market-crushing outperformance compared to 211% for the S&P 500. Don't miss the latest top 10 list, available with Stock Advisor, and join an investing community built by individual investors for individual investors.

See the 10 stocks »

*Stock Advisor returns as of October 1, 2026.

Patrick Sanders has no position in any of the stocks mentioned. The Motley Fool has positions in and recommends Micron Technology and Tesla. The Motley Fool has a disclosure policy.

  •  

Can Shiba Inu Reach $1 In the Next 12 Months?

Key Points

  • Shiba Inu’s all-time high was established nearly five years ago, demonstrating just how much it has fallen out of favor.

  • The meme token lacks any real fundamental advantages compared to other feature-rich blockchain networks.

  • Tokens are being burned, but the current rate is virtually nothing compared to Shiba Inu's gargantuan circulating supply.

Shiba Inu (CRYPTO: SHIB) might have a small market capitalization of $3.3 billion (as of Sept. 28), but that hasn't kept it from being one of the most popular digital assets on Earth. It capitalized on the investment community's interest in Dogecoin, while aiming to be more functional by leveraging its presence on the Ethereum blockchain.

This meme token has been in a troubling down cycle, however. Maybe positive momentum is on the horizon. Can Shiba Inu's price increase by almost 18,000,000% and reach $1 in the next 12 months?

Missed Nvidia in 2009? This Rare Signal Is Flashing Again. In 2009, a "Double Down" signal flashed for a little-known chipmaker called Nvidia. For the first time in years, that same "Total Conviction" signal is flashing for a company 1/100th the size of Nvidia. Continue »

Shiba Inu dog sitting on a gray couch.

Image source: Getty Images.

Weak fundamentals support ongoing price pressure

Over the long term, the most important factor for any cryptocurrency to even have a chance at staying relevant is a fundamental edge that supports real-world utility. It's accurate to assume that Shiba Inu falls flat in this area. Its developers built a metaverse, a decentralized exchange, and a layer-2 scaling solution, all innovative features within the cryptocurrency industry.

However, these strategic actions have done nothing to drive Shiba Inu's price, a clear indication that they're not catching on with users. What's more, there are numerous other cryptocurrencies that have more promising feature sets.

Shiba Inu followers know that fundamentals have minimal impact on the token's price movement. What has mattered most historically has been how excited (or disappointed) the Shib Army, the cryptocurrency's community of supporters, was at any given time. Even these advocates appear to be losing interest. This is clear when you realize that Shiba Inu currently trades 94% off its peak from almost five years ago.

Forget about burning tokens

Shiba Inu is in the process of burning its token supply. This entails sending tokens to a dead wallet, resulting in a removal from the circulating supply. Investors can think about it as if it were a company conducting share repurchases. From a fundamental perspective, nothing changes.

This doesn't guarantee that the desired outcome will happen. Existing token holders aren't certain to see the value of their positions increase simply because the community is undergoing a coin-burning scheme.

Additionally, Shiba Inu isn't burning enough tokens. It's not even close. In the past 30 days, 375.6 million tokens were burned, translating to roughly 4.5 billion on an annualized basis. Of the gargantuan supply of 589.2 trillion tokens, this represents next to nothing.

After Shiba Inu's mind-boggling 2021 run, it has fallen out of favor. There are probably still strong supporters out there who think that good times are coming. It's smart to drastically temper those expectations, however. This meme coin will not hit $1 in the next 12 months or ever.

Should you buy stock in Shiba Inu right now?

Before you buy stock in Shiba Inu, consider this:

The Motley Fool Stock Advisor analyst team just identified what they believe are the 10 best stocks for investors to buy now… and Shiba Inu wasn’t one of them. The 10 stocks that made the cut could produce monster returns in the coming years.

Consider when Netflix made this list on December 17, 2004... if you invested $1,000 at the time of our recommendation, you’d have $375,240!* Or when Nvidia made this list on April 15, 2005... if you invested $1,000 at the time of our recommendation, you’d have $1,403,292!*

Now, it’s worth noting Stock Advisor’s total average return is 933% — a market-crushing outperformance compared to 211% for the S&P 500. Don't miss the latest top 10 list, available with Stock Advisor, and join an investing community built by individual investors for individual investors.

See the 10 stocks »

*Stock Advisor returns as of October 1, 2026.

Neil Patel has no position in any of the stocks mentioned. The Motley Fool has positions in and recommends Ethereum. The Motley Fool has a disclosure policy.

  •  

Better Foreign Markets ETF: Vanguard's VT vs. State Street's SPDW

Key Points

  • The Vanguard Total World Stock ETF provides broad global coverage including U.S. and emerging markets, while the State Street SPDR Portfolio Developed World ex-US ETF focuses exclusively on foreign developed markets.

  • The State Street SPDR Portfolio Developed World ex-US ETF features a lower expense ratio and a significantly higher dividend yield than the Vanguard fund.

  • The Vanguard Total World Stock ETF has demonstrated higher five-year growth and lower maximum drawdowns despite its lower recent 1-year total return.

The primary distinction between the Vanguard Total World Stock ETF (NYSEMKT:VT) and State Street SPDR Portfolio Developed World ex-US ETF (NYSEMKT:SPDW) is their geographic scope and inclusion of domestic equities.

These funds serve different roles in a portfolio. While one aims to capture the entire global stock market in a single fund, the other acts as a specialized tool for investors who already have U.S. exposure and want to add developed foreign markets efficiently.

Snapshot (cost & size)

MetricSPDWVT
IssuerState StreetVanguard
Share price$50.69 (as of 2026-09-28)$158.81 (as of 2026-09-28)
Expense ratio0.03%0.06%
1-yr return (as of Sept. 28, 2026)23.3%18.0%
Dividend yield3.0%1.5%
Beta0.840.92
AUM$41.5 billion$101.7 billion

Beta measures price volatility relative to the S&P 500; beta is calculated from monthly returns over the available fund history (up to five years). The 1-year return represents total return over the trailing 12 months. Dividend yield is the trailing-12-month distribution yield.

The State Street fund is the more affordable option with its 0.03% expense ratio. It also offers a higher payout, with a 3% yield that is double the 1.5% yield offered by the Vanguard fund.

Performance & risk comparison

MetricSPDWVT
Max drawdown (5 yr)-29.8%-26.4%
Growth of $1,000 over 5 years (total return)$1,632$1,710

What's inside

The Vanguard Total World Stock ETF provides massive diversification with 9,773 holdings. Its sector exposure is led by technology at 30%, financial services at 16%, and industrials at 11%. Its largest positions include Nvidia at 4.32%, Apple at 3.84%, and Microsoft at 3.16%. The fund was launched in 2008, and has paid $2.41 per share over the trailing 12 months, which on its recent ~$158.81 share price works out to a 1.5% yield.

The State Street SPDR Portfolio Developed World ex-US ETF holds 2,436 stocks, focusing on financial services at 24%, industrials at 18%, and technology at 15%. Its largest positions include Samsung Electronics at 2.64%, SK Hynix at 2.23%, and ASML Holding at 2.02%. The fund was launched in 2007, and has paid $1.52 per share over the trailing 12 months, which on its recent ~$50.69 share price works out to a 3% yield.

For more guidance on ETF investing, check out the full guide at this link.

Which looks like the better buy

For an investor with a U.S.-centric investment portfolio, gaining exposure to foreign markets is a key means of diversification. The Vanguard Total World Stock ETF (VT) and State Street SPDR Portfolio Developed World ex-US ETF (SPDW) provide this. Choosing between them comes down to how they complement your existing equity ownership.

Vanguard's VT delivers what its name indicates, a fund containing stocks from around the world, including the U.S. This is a great ETF for those new to investing, as it captures key global companies in one spot. It can also be good for more seasoned investors as it provides exposure to prominent businesses driving the artificial intelligence boom.

However, if you already own many U.S. stocks, you may have too much overlap with VT. The fund's holdings are heavily focused in North America, which represents a hefty 65% of the ETF. So if you possess shares in Nvidia and other top VT holdings, SPDW may be the better fit.

SPDW provides robust international stock exposure, while also offering a superior dividend yield and lower expense ratio. Its top holdings include AI giants such as ASML and SK Hynix, so you benefit from the AI sector's rapid growth as well. Its one downside is that it does not cover emerging markets, which VT does include.

Should you buy stock in Vanguard International Equity Index Funds - Vanguard Total World Stock ETF right now?

Before you buy stock in Vanguard International Equity Index Funds - Vanguard Total World Stock ETF, consider this:

The Motley Fool Stock Advisor analyst team just identified what they believe are the 10 best stocks for investors to buy now… and Vanguard International Equity Index Funds - Vanguard Total World Stock ETF wasn’t one of them. The 10 stocks that made the cut could produce monster returns in the coming years.

Consider when Netflix made this list on December 17, 2004... if you invested $1,000 at the time of our recommendation, you’d have $375,240!* Or when Nvidia made this list on April 15, 2005... if you invested $1,000 at the time of our recommendation, you’d have $1,403,292!*

Now, it’s worth noting Stock Advisor’s total average return is 933% — a market-crushing outperformance compared to 211% for the S&P 500. Don't miss the latest top 10 list, available with Stock Advisor, and join an investing community built by individual investors for individual investors.

See the 10 stocks »

*Stock Advisor returns as of October 1, 2026.

Robert Izquierdo has positions in ASML, Apple, Microsoft, and Nvidia. The Motley Fool has positions in and recommends ASML, Apple, Microsoft, and Nvidia. The Motley Fool has a disclosure policy.

  •  

Stock Market Midday, Oct. 1: Stocks Edge Lower as Treasury Yields Surge to 24-Year High

As of 11:31 a.m. ET, the Nasdaq Composite (NASDAQINDEX:^IXIC) was down 0.22% to 26,801, the S&P 500 (SNPINDEX:^GSPC) was trading lower by 0.26% to 7,632, and the Dow Jones Industrial Average (DJINDICES:^DJI) dropped 0.56% to 50,623 as surging bond yields pressure blue chip components.

Gold was up 0.17% to $4,193.70, while the 10-Year Treasury yield rose 0.03% to 5.29% during a session where industrials are leading the market. Basic materials stocks are the primary laggard, with consumer defensive names also showing resilience.

Today's biggest moves

Accenture (NYSE:ACN) shares jumped after the company reported quarterly results that beat expectations alongside an upbeat fiscal 2027 outlook, while McKesson (NYSE:MCK) is rallying despite broader volatility. On the downside, Corteva (NYSE:CTVA) is among the session's notable decliners and General Mills (NYSE:GIS) hit a 52-week low as rising interest rates weigh on the consumer sector.

What this means for investors

In a sign that investor expectations are higher than ever for tech firms, Micron Technology's (NASDAQ:MU) stock sank even after the company reported sales nearly quadrupled year over year and beat the analyst earnings consensus. It also issued strong guidance, but much of that news was already seemingly priced in.

The market was also under pressure as Treasury yields reached their highest level in over 20 years. Those rising rates will hit growth companies harder as they continue to borrow to invest in artificial intelligence (AI) equipment.

High Treasury yields also compete with dividend-paying stocks, helping to drive that segment of the market lower. The market may also be looking ahead to Friday's monthly jobs report, which could help determine the future direction of interest rates.

Should you buy stock in Invesco QQQ Trust right now?

Before you buy stock in Invesco QQQ Trust, consider this:

The Motley Fool Stock Advisor analyst team just identified what they believe are the 10 best stocks for investors to buy now… and Invesco QQQ Trust wasn’t one of them. The 10 stocks that made the cut could produce monster returns in the coming years.

Consider when Netflix made this list on December 17, 2004... if you invested $1,000 at the time of our recommendation, you’d have $375,240!* Or when Nvidia made this list on April 15, 2005... if you invested $1,000 at the time of our recommendation, you’d have $1,403,292!*

Now, it’s worth noting Stock Advisor’s total average return is 933% — a market-crushing outperformance compared to 211% for the S&P 500. Don't miss the latest top 10 list, available with Stock Advisor, and join an investing community built by individual investors for individual investors.

See the 10 stocks »

*Stock Advisor returns as of October 1, 2026.

Howard Smith has positions in Alphabet. The Motley Fool has positions in and recommends Accenture Plc, Alphabet, Chevron, and Micron Technology. The Motley Fool recommends McKesson and recommends the following options: long January 2028 $260 calls on Accenture Plc and short January 2028 $280 calls on Accenture Plc. The Motley Fool has a disclosure policy.

  •  

I Think Dividend Investing Is the Single Best Strategy for New Investors

Key Points

  • Dividend investors should seek stocks with quality balance sheets and a history of rewarding shareholders.

  • Historically, dividends have provided a significant percentage of a stock's total returns.

  • Here's the case for why dividend investing is a great foundational portfolio strategy for beginners.

If someone came to you and said they had $1,000 to invest and wanted your help in deciding where to put it, what would you tell them?

Based on recent market returns, your inclination might be to say a tech exchange-traded fund (ETF), such as the Vanguard Information Technology ETF (NYSEMKT: VGT). Since they're just starting out, you might suggest more of a foundational piece, such as the Vanguard S&P 500 ETF (NYSEMKT: VOO).

Missed Nvidia in 2009? This Rare Signal Is Flashing Again. In 2009, a "Double Down" signal flashed for a little-known chipmaker called Nvidia. For the first time in years, that same "Total Conviction" signal is flashing for a company 1/100th the size of Nvidia. Continue »

I think the latter choice is certainly defensible. You want to start your portfolio with something that's broadly diversified, ultra-low cost, and can be held for decades or more. The tech ETF probably isn't a good choice for a starter portfolio (at least as the first fund to own). It's far too focused on a riskier single sector to be the point you want to build from.

But for someone investing for the first time, I think dividend stocks are the best place to start. This might seem like an overly conservative choice in a market that has been rewarding just the opposite. But for someone who might just be learning about how long-term wealth is created, dividend stocks and ETFs will do a better job of teaching them how to invest the right way.

Rolled up dollar bills and a sticky note that says "dividends."

Image source: Getty Images.

What is a dividend?

A dividend is simply a portion of a company's earnings that is paid out to shareholders. Most companies pay them out on a quarterly basis, but a small percentage pay them monthly or even annually.

Companies that issue dividends are generally considered to be higher quality, more mature, and more durable. This is because they often don't start paying dividends until they're well established and generate sufficient cash flows and profits to support them.

Some of the best dividend stocks are those from companies that continue to raise their payouts annually, often called dividend growth stocks. This commitment to rewarding shareholders regularly makes the stock attractive to income seekers and helps reinforce the idea that their business is on firm financial footing.

But none of this is guaranteed. Companies can raise or cut their dividends based on their financial condition and economic environment. But most companies that begin issuing dividends prefer to keep those payments steady or growing if at all possible.

One of the advantages of dividend stocks is that they give you two potential sources of return: share price growth and dividend income. Many of the big tech and artificial intelligence (AI) companies don't pay dividends because they're using all of their cash to grow their businesses. Their total return will be based solely on share price changes. Dividend income can help support total returns during times when the share price is falling.

History makes a strong case for dividend investing

You may not guess it based on recent returns, but dividend stocks have an established history of outperforming other types of stocks over the long term. And this is where I think the risk/reward trade-off becomes such an important part of building your portfolio. A Ned Davis Research study looking at stock performance since 1973 shows that stronger dividend payment and growth policies have historically resulted in better total returns with lower risk.

Group Annual Return Beta Standard Deviation
Dividend growers and initiators 10.22% 0.89 15.97%
No change in dividend policy 6.87% 1.02 18.45%
Non-dividend payers 4.21% 1.18 21.91%
Dividend cutters and eliminators (0.96%) 1.22 24.80%

Data source: Ned Davis Research.

The logic is pretty straightforward. Dividend growers should, in theory, be generating more cash flow and more profits in order to support higher dividend payments. Companies with steady dividends may demonstrate consistent corporate health, but perhaps without the stronger growth. Dividend cutters are likely in some financial distress and need to hang on to whatever cash they can to support the business.

Another Hartford Funds study showed that over the past 85 years, dividend income contributes roughly 1/3 of a stock's total return. Combine these factors together -- better historical returns, lower risk, high-quality balance sheets -- and I think you've got one of the best long-term investing strategies for those folks starting out for the first time. Or anybody, really.

Growth and tech stocks can provide spectacular short-term returns, as we've seen in recent years. But they can also experience greater downside risk and spectacular busts. Just look at what happened when the tech bubble burst in the early 2000s, and the Nasdaq-100 lost over 80% of its value. Dividend stock investing offers more stability and helps limit some of the more excessive risks.

Here's how I'd start dividend investing today

Researching individual dividend stocks can be time-consuming and complex. So I'd start with a broadly diversified dividend ETF that offers a basket of high-quality dividend stocks in one place.

The WisdomTree U.S. Total Dividend ETF (NYSEMKT: DTD) gives you access to essentially the entire dividend stock universe. The Vanguard Dividend Appreciation ETF (NYSEMKT: VIG) and the ProShares S&P 500 Dividend Aristocrats ETF (NYSEMKT: NOBL) invest in long-term dividend growth stocks. The Schwab U.S. Dividend Equity ETF (NYSEMKT: SCHD) considers dividend growth history, balance sheet quality, and yield in its selection process.

Dividend investing doesn't necessarily need to account for your entire portfolio. Eventually, diversifying into tech or international stocks can provide balance. But as a foundation for a beginner investment portfolio, I think dividend stocks are a great start.

Should you buy stock in Vanguard Dividend Appreciation ETF right now?

Before you buy stock in Vanguard Dividend Appreciation ETF, consider this:

The Motley Fool Stock Advisor analyst team just identified what they believe are the 10 best stocks for investors to buy now… and Vanguard Dividend Appreciation ETF wasn’t one of them. The 10 stocks that made the cut could produce monster returns in the coming years.

Consider when Netflix made this list on December 17, 2004... if you invested $1,000 at the time of our recommendation, you’d have $375,240!* Or when Nvidia made this list on April 15, 2005... if you invested $1,000 at the time of our recommendation, you’d have $1,403,292!*

Now, it’s worth noting Stock Advisor’s total average return is 933% — a market-crushing outperformance compared to 211% for the S&P 500. Don't miss the latest top 10 list, available with Stock Advisor, and join an investing community built by individual investors for individual investors.

See the 10 stocks »

*Stock Advisor returns as of October 1, 2026.

David Dierking has positions in Schwab U.S. Dividend Equity ETF, Vanguard Dividend Appreciation ETF, and Vanguard Information Technology ETF. The Motley Fool has positions in and recommends ProShares S&P 500 Dividend Aristocrats ETF, Vanguard Dividend Appreciation ETF, and Vanguard S&P 500 ETF. The Motley Fool has a disclosure policy.

  •  

Which Energy ETF Fits Your Portfolio? State Street Energy Select Sector SPDR ETF (XLE) or the Alerian MLP ETF (AMLP)?

Key Points

  • State Street Energy Select Sector SPDR ETF provides broad energy exposure with a significantly lower expense ratio than Alerian MLP ETF.

  • Alerian MLP ETF offers a substantially higher trailing-12-month distribution yield by focusing on master limited partnerships in the midstream sector.

  • State Street Energy Select Sector SPDR ETF has demonstrated higher total returns and growth over the past five years compared to the Alerian fund.

While the State Street Energy Select Sector SPDR ETF (NYSEMKT:XLE) offers broad energy exposure with a significantly lower expense ratio, the Alerian MLP ETF (NYSEMKT:AMLP) provides targeted midstream exposure and a higher distribution yield.

Investors looking for energy exposure must choose between broad-based equity funds and specialized infrastructure vehicles. This comparison evaluates the State Street Energy Select Sector SPDR ETF, which tracks the S&P 500 energy sector, against the Alerian MLP ETF, which focuses on energy infrastructure and transportation companies.

Snapshot (cost & size)

MetricAMLPXLE
IssuerALPS FundsSPDR
Share price$52.93 (as of 2026-09-28)$62.10 (as of 2026-09-28)
Expense ratio1.01%0.08%
1-yr return (as of 2026-09-28)20.5%38.8%
Dividend yield7.8%2.5%
Beta0.540.49
AUM$12.9 billion$40.2 billion

Beta measures price volatility relative to the S&P 500; beta is calculated from monthly returns over the available fund history (up to five years). The 1-yr return represents total return over the trailing 12 months. Dividend yield is the trailing-12-month distribution yield.

The State Street Energy Select Sector SPDR ETF is notably more affordable for investors, with an expense ratio that is 0.93 percentage points lower than the Alerian MLP ETF. However, the Alerian fund provides a significantly higher payout for those focused on current income.

Performance & risk comparison

MetricAMLPXLE
Max drawdown (5 yr)(20.9%)(26.1%)
Growth of $1,000 over 5 years (total return)~$2.3k~$2.8k

What's inside

The State Street Energy Select Sector SPDR ETF is designed to mirror the return of the Energy Select Sector Index, providing exposure to oil, natural gas, and consumable fuels. Its portfolio comprises 21 holdings, representing the energy constituents of the S&P 500. Its largest positions include ExxonMobil Holdings Corp (NYSE:XOM) at 23.80%, Chevron Corp (NYSE:CVX) at 18.09%, and ConocoPhillips (NYSE:COP) at 6.72%. The fund was launched in 1998. State Street Energy Select Sector SPDR ETF has paid $1.52 per share over the trailing 12 months, which, on its recent ~$62.10 share price, works out to a 2.5% yield.

The Alerian MLP ETF tracks an index of energy infrastructure master limited partnerships that derive most of their cash flow from transporting and processing energy commodities. This fund holds 14 securities and is considered non-diversified due to its narrow focus on midstream assets. Its top holdings include Sunoco LP (NYSE:SUN) at 12.46%, Mplx Lp (NYSE:MPLX) at 12.12%, and Plains All American Pipeline LP (NASDAQ:PAA) at 12.08%. The fund was launched in 2010. Alerian MLP ETF has paid $4.07 per share over the trailing 12 months, which, on its recent ~$52.93 share price, works out to a 7.8% yield.

For more guidance on ETF investing, check out the full guide at this link.

Which looks like the better buy

To compare the State Street Energy Select Sector SPDR ETF (XLE) and the Alerian MLP ETF (AMLP), investors should consider several key details. Let's see what they tell us about each fund.

To begin, we should discuss the greatest contrast between these two funds: strategy. XLE focuses on traditional energy stocks. Its largest holdings are oil and gas majors like ExxonMobil, Chevron, and ConocoPhillips. AMLP, on the other hand, focuses on master limited partnership stocks. These are partnerships that tend to be midstream oil and gas companies. MLPs have a special tax status and treatment that differ from traditional stocks.

Two other important factors are historical performance and income potential. As for performance, XLE has an edge. Since 2016, the fund has generated a total return of 162%, with a compound annual growth rate (CAGR) of 10.1%. AMLP, meanwhile, has delivered an 88% total return, with a 6.5% CAGR. Both funds have underperformed the S&P 500 over this period. Turning to income potential, AMLP has a significant advantage. AMLP boasts a stout dividend yield of 7.85%, while XLE's dividend yield is 2.48%.

One final factor to weigh is cost. On this measure, XLE is the clear winner. XLE's expense ratio is only 0.08%. AMLP, by contrast, has an expense ratio of 1.01%. That means an investor who puts $10,000 into each fund will pay $8 per year in fees for their XLE shares but $101 per year in fees for their AMLP shares. Over time, those fees can really add up.

To conclude, although XLE and AMLP are both energy ETFs, they differ in many ways. XLE is the clear choice for investors seeking simple energy exposure, thanks to its low fees, exposure to major oil and gas stocks, and its moderate dividend yield. AMLP is for investors seeking exposure to a basket of MLPs. It offers exception income potential through its 7.85% dividend yield, but its high fees make it a poor choice for cost-conscious investors.

Should you buy stock in Select Sector SPDR Trust - State Street Energy Select Sector SPDR ETF right now?

Before you buy stock in Select Sector SPDR Trust - State Street Energy Select Sector SPDR ETF, consider this:

The Motley Fool Stock Advisor analyst team just identified what they believe are the 10 best stocks for investors to buy now… and Select Sector SPDR Trust - State Street Energy Select Sector SPDR ETF wasn’t one of them. The 10 stocks that made the cut could produce monster returns in the coming years.

Consider when Netflix made this list on December 17, 2004... if you invested $1,000 at the time of our recommendation, you’d have $375,240!* Or when Nvidia made this list on April 15, 2005... if you invested $1,000 at the time of our recommendation, you’d have $1,403,292!*

Now, it’s worth noting Stock Advisor’s total average return is 933% — a market-crushing outperformance compared to 211% for the S&P 500. Don't miss the latest top 10 list, available with Stock Advisor, and join an investing community built by individual investors for individual investors.

See the 10 stocks »

*Stock Advisor returns as of October 1, 2026.

Jake Lerch has positions in ExxonMobil. The Motley Fool has positions in and recommends Chevron. The Motley Fool recommends ConocoPhillips. The Motley Fool has a disclosure policy.

  •  

UPS Dips Below $94 and Has a 7% Dividend Yield: Time to Buy?

Key Points

The dip in the United Parcel Service (NYSE: UPS) share price takes its dividend yield to almost 7%. That could prove to be a highly attractive entry point for passive-income-seeking investors. Still, will it prove to be a good buy, or is it a value trap?

What Wall Street analysts expect

Wall Street is divided over UPS, with Goldman Sachs recently adding the stock to its "conviction list" with a buy rating and a $132 price target. In comparison, Bank of America recently lowered its price target to $108 from $115 and kept a neutral rating on the stock, citing delivery volume concerns.

Missed AI’s "Act 1"? Act 2 Could Be 15x Bigger. Most investors think they missed the AI boat because they didn't buy Nvidia in 2005. But according to our analysts, we’re only at the end of "Act 1"—the R&D phase. "Act 2" is the global rollout. Continue »

The volume situation is somewhat nuanced. UPS has now completed its so-called "glide down," whereby it voluntarily reduced its delivery volume for Amazon by 50% from the start of 2025 to mid-2026. As such, the 5.7% decline in the U.S. domestic package segment shouldn't come as a surprise. On the second-quarter earnings call, CFO Brian Dykes called for "average daily volume to decline mid-single digits" in the U.S. segment, "reflecting a seasonal decline as well as the impact of this year's Amazon glide down, which completed in June."

UPS expectations

Delivery volume is a key number to watch; however, volume is one thing, pricing is another, and the relationship among pricing, volume, and margin is yet another. I'll return to pricing in a moment, but first note that management's guidance calls for U.S. domestic package segment operating margin to be 7% in the third quarter, and then 10.6% for the fourth quarter, based on management's estimate for 8.8% in the back half of the year.

As management notes, these figures imply year-over-year margin growth, which is good and consistent with management's strategy of eschewing low- or negative-margin deliveries from Amazon and others and investing in technology (smart facilities, automation, etc.) to improve productivity.

Packages being scanned for delivery.

Image source: Getty Images.

But here's the problem: UPS faces margin pressure, and its massive dividend restricts its ability to react to any significant downward adjustment to its earnings and cash-flow expectations.

Pricing, volume, and margin

It's no secret that diesel costs (UPS ground operations) and jet fuel costs (UPS air operations) have both soared this year and stayed stubbornly high as the Strait of Hormuz remains largely closed for commercial traffic. Management offsets these rising costs by imposing fuel surcharges, and CEO Carol Tomé says they "functioned as designed" in the second quarter. Dykes says that while "higher fuel prices were a positive to revenue, the corresponding increase in expense meant that the net impact to consolidated operating profit dollars was modest."

While management didn't quantify the net impact, we know the following from its financial filings:

  • U.S. domestic package fuel surcharge revenue grew by $721 million in the first half, while international package fuel surcharge revenue grew by $452 million, for a total increase of $1.173 billion.
  • Total company fuel costs rose by $664 million in the first half, and its third-party fuel surcharge expense rose by $80 million.

Some simple math indicates a difference of $429 million. To be fair, this is not an exact estimate, as management noted there are other increased operating costs associated with fuel-related disruptions.

A collage of oil barrels, prices, arrows, and a $100 bill.

Image source: Getty Images.

That said, it's still a large number, and the question is whether UPS can continue to offset increased fuel costs with a fuel surcharge without suffering a loss of volume. It's a particular concern given how much it's gone up in 2026, and Amazon is likely to be competing with UPS, notably in the small and medium-sized business (SMB) market that UPS covets, through its new Amazon Supply Chain Services business launched in the spring.

Is UPS stock a buy?

The company's current dividend will cost $5.4 billion in 2026, and management is estimating $5.5 billion in free cash flow. Frankly, this is a slim cover, and there's little room for flexibility if its earnings outlook deteriorates amid higher costs and margin pressure stemming from difficulty meeting volume expectations due to higher prices and Amazon competition. All of which suggests now is not the best time to buy into the stock.

Should you buy stock in United Parcel Service right now?

Before you buy stock in United Parcel Service, consider this:

The Motley Fool Stock Advisor analyst team just identified what they believe are the 10 best stocks for investors to buy now… and United Parcel Service wasn’t one of them. The 10 stocks that made the cut could produce monster returns in the coming years.

Consider when Netflix made this list on December 17, 2004... if you invested $1,000 at the time of our recommendation, you’d have $375,240!* Or when Nvidia made this list on April 15, 2005... if you invested $1,000 at the time of our recommendation, you’d have $1,403,292!*

Now, it’s worth noting Stock Advisor’s total average return is 933% — a market-crushing outperformance compared to 211% for the S&P 500. Don't miss the latest top 10 list, available with Stock Advisor, and join an investing community built by individual investors for individual investors.

See the 10 stocks »

*Stock Advisor returns as of October 1, 2026.

Bank of America is an advertising partner of Motley Fool Money. Lee Samaha has no position in any of the stocks mentioned. The Motley Fool has positions in and recommends Amazon, Goldman Sachs Group, and United Parcel Service. The Motley Fool has a disclosure policy.

  •  

4 Reasons to Buy Meta Platforms Stock

Key Points

  • Meta's personalized AI agent is proving highly popular.

  • The company is launching an AI business that could be lucrative.

  • Meta has reduced its legal risk by settling many of the lawsuits against it.

  • The stock still appears to be trading at reasonable levels.

After months of poor performance, Meta Platforms (NASDAQ:META) is finally bouncing back. Over the past four weeks, the company's shares have climbed 27%. The S&P 500 is slightly in the red over the same period. Still, Meta's shares remain down by about 1% over the past 12 months, and there may be more upside ahead for the tech giant. Let's consider four reasons why it's not too late to invest in Meta Platforms.

White infinity-style Meta logo on a blue background with a modern glass office building

Image source: The Motley Fool.

Missed Nvidia in 2009? This Rare Signal Is Flashing Again. In 2009, a "Double Down" signal flashed for a little-known chipmaker called Nvidia. For the first time in years, that same "Total Conviction" signal is flashing for a company 1/100th the size of Nvidia. Continue »

1. Muse appears to be a hit

One reason why Meta's stock has lagged broader equities in recent months is that the company has failed to convince many investors that its artificial intelligence (AI) strategy is sound. True, AI-related initiatives have helped the company improve its advertising business, but it continued to spend large sums on AI infrastructure, which is partly why its earnings and free cash flow declined in the second quarter.

But that spending may be about to pay off. On Sept. 8, Meta released Muse, a personalized AI agent. Muse was an instant hit and quickly rose to the top of the list of the most downloaded iOS apps in the U.S. Muse is free to use up to a certain limit, though there is a paid tier for those who want more features. Meta could make some money from those subscriptions.

However, there is an even larger opportunity. Meta has indicated that it would make money from Muse by charging merchants a fee when the personalized AI agent helps its users make purchases. Provided Meta can attract a large number of users to Muse (it already had about 730,000 downloads after roughly five days on the app store), this could be a highly lucrative business.

And in all likelihood, Meta will continue to improve Muse over time, something its significant AI spending will enable.

2. Meta's new AI business

On Sept. 28, Meta announced that it was launching Meta Enterprise Platform, a new venture through which it will sell AI tools and software to other businesses. This is, yet again, a result of Meta's significant AI investments. The company's infrastructure spending enabled it to train advanced models and to build AI agents and tools on top of them, some of which it has used internally.

Now, Meta plans to make those tools available to other businesses. And although other companies are doing the same, Meta has an advantage. The tech leader already has a vast ecosystem of users, as well as many businesses with which it has worked for years to help them reach its users.

These long-standing relationships could help Meta hit the ground running and quickly access a large clientele with its new AI business. This could help boost the company's revenue over the medium term, while diversifying away from its core advertising operations, which still account for the lion's share of its sales.

3. Addressing its legal issues

Here's another reason Meta has lagged broader equities over the past year: The company has faced legal problems. Specifically, Meta is dealing with lawsuits alleging that its social media apps have harmed young users. And according to the lawsuits, Meta knew about these risks. However, Meta has settled many of the lawsuits brought by a bipartisan group of attorneys general from dozens of U.S. states and territories.

Meta agreed to pay up to approximately $18 billion in annual installments over a decade (with $5.3 billion of that total contingent on certain actions by YouTube and TikTok). The company will also establish stronger guardrails to protect teens on its social media apps. This isn't a catastrophic outcome for Meta Platforms. It generates well over $18 billion in profits annually.

And although there are more lawsuits against the company, resolving this major group of state claims was an important achievement.

4. The price is still right

Meta has, to a large extent, addressed two of its biggest challenges. It is showing that its AI spending wasn't just for fun, and it has settled many lawsuits against it. The company's medium-term prospects appear attractive, and even after its recent run of form, the stock doesn't seem prohibitively expensive. Meta is trading at 22.1x forward earnings, versus an average of 20.9x for information technology stocks. Meta is arguably worth a premium, considering the strength of its core advertising business and the several new opportunities at its disposal. At current levels, there may still be plenty of upside left.

Should you buy stock in Meta Platforms right now?

Before you buy stock in Meta Platforms, consider this:

The Motley Fool Stock Advisor analyst team just identified what they believe are the 10 best stocks for investors to buy now… and Meta Platforms wasn’t one of them. The 10 stocks that made the cut could produce monster returns in the coming years.

Consider when Netflix made this list on December 17, 2004... if you invested $1,000 at the time of our recommendation, you’d have $375,240!* Or when Nvidia made this list on April 15, 2005... if you invested $1,000 at the time of our recommendation, you’d have $1,403,292!*

Now, it’s worth noting Stock Advisor’s total average return is 933% — a market-crushing outperformance compared to 211% for the S&P 500. Don't miss the latest top 10 list, available with Stock Advisor, and join an investing community built by individual investors for individual investors.

See the 10 stocks »

*Stock Advisor returns as of October 1, 2026.

Prosper Junior Bakiny has positions in Meta Platforms. The Motley Fool has positions in and recommends Meta Platforms. The Motley Fool has a disclosure policy.

  •  

Data Centers Need Copper, Concrete, and Cooling. Here Are 3 Boring Industrials Set to Cash In.

Key Points

  • AI data center growth is driving demand for copper, concrete, and cooling.

  • Freeport-McMoRan, Vulcan Materials, and Vertiv are well positioned to benefit.

  • Forecasts suggest ongoing, multiyear growth opportunities for these companies.

It's no secret that spending on AI data centers is booming, and projections for hyperscaler spending suggest the boom will continue. This will create opportunities for ongoing marginal growth for companies that provide the raw materials used in construction, such as copper miner Freeport-McMoRan (NYSE: FCX), construction materials company Vulcan Materials (NYSE: VMC), and data center infrastructure company Vertiv (NYSE: VRT).

Copper and Freeport-McMoRan

The chart below shows the scale of the spending increase, and although not all of it is allocated to physical data centers, it indicates a considerable marginal increase in end demand for these three companies.

Missed Nvidia in 2009? This Rare Signal Is Flashing Again. In 2009, a "Double Down" signal flashed for a little-known chipmaker called Nvidia. For the first time in years, that same "Total Conviction" signal is flashing for a company 1/100th the size of Nvidia. Continue »

Hyperscaler spending plans.

Data source: Visible Alpha. Chart by author.

You can't build a data center without the copper to create and transmit power to it, and also within it. According to S&P Global's "Copper in the age of AI" report, AI and data centers are set to contribute 13.7% of total copper demand growth from 2025 to 2030, with the energy transition (EVs, renewable energy, transmission, and distribution) contributing 59%. Much of the demand for transmission and distribution also comes from data center build-outs.

The forecast 18% increase in copper demand from 2025 to 2030 may not sound like much, but it implies a gradually widening gap between demand and baseline copper supply, which will continue to grow until, by 2040, copper demand of 42.3 million tons is forecast to exceed supply by 10.1 million tons.

These forecasts imply a bullish outlook for copper prices, which is great news for Freeport-McMoRan, a copper company with ample reserves, opportunities to expand existing sites, and a nascent low-cost leaching technology to recover copper from existing stockpiles.

A data center.

Image source: Getty Images.

Vulcan Materials

The aggregates company Vulcan Materials also explicitly linked electricity infrastructure demand to data centers. Speaking on the company's second-quarter earnings call, CEO Ronnie Pruitt said, "Large project opportunities continue to drive nonresidential activity, particularly data centers." In addition to the direct demand coming from data centers, he noted, "We've also seen a pickup in LNG projects along with energy generation and power infrastructure expansion, which is really being driven by the data centers."

The marginal increase in demand from non-residential construction, driven by power/data centers, is supporting the kind of "slow and steady" demand Pruitt covets, and it will also underpin demand while Vulcan waits for the more cyclical residential sector to return.

US Residential Construction Spending Chart

US Residential Construction Spending data by YCharts

Vertiv, an AI infrastructure company

Vertiv's power, cooling, and IT infrastructure solutions have made it the darling of investors looking to buy stocks with exposure to AI build-out spending. As such, investors closely watch its order patterns as early indicators of data center spending.

The company's latest update indicates an end market that continues to strengthen. Discussing its order pipeline at a recent Goldman Sachs conference in September, Vertiv CEO Giordano Albertazzi said: "We see no sign of weakening. If anything, we're seeing strength that the pipeline is getting stronger and stronger, and our customers' resolve and building plan continue to evolve in the right direction."

The full-year guidance on the second-quarter earnings call was for a 37% increase in revenue and a 60% increase in earnings per share (EPS) over 2025, but if Albertazzi's commentary leads to stronger order growth, then investors can pencil in more revenue and earnings growth in the future.

That growth is likely to be enhanced by Vertiv's exposure to a new class of high-voltage and higher-productivity data centers for which Nvidia is developing architecture. Vertiv believes commercial adoption of the solutions it's developed for the new 800 volt direct current (VDC) will begin in the second half of 2027, with "volumes in 2028." That should kick off a new growth phase for the company.

Should you buy stock in Freeport-McMoRan right now?

Before you buy stock in Freeport-McMoRan, consider this:

The Motley Fool Stock Advisor analyst team just identified what they believe are the 10 best stocks for investors to buy now… and Freeport-McMoRan wasn’t one of them. The 10 stocks that made the cut could produce monster returns in the coming years.

Consider when Netflix made this list on December 17, 2004... if you invested $1,000 at the time of our recommendation, you’d have $375,240!* Or when Nvidia made this list on April 15, 2005... if you invested $1,000 at the time of our recommendation, you’d have $1,403,292!*

Now, it’s worth noting Stock Advisor’s total average return is 933% — a market-crushing outperformance compared to 211% for the S&P 500. Don't miss the latest top 10 list, available with Stock Advisor, and join an investing community built by individual investors for individual investors.

See the 10 stocks »

*Stock Advisor returns as of October 1, 2026.

Lee Samaha has no position in any of the stocks mentioned. The Motley Fool has positions in and recommends Goldman Sachs Group, Nvidia, Oracle, and Vertiv. The Motley Fool has a disclosure policy.

  •  

Should You Forget NextEra Energy and Buy This Nuclear Stock Instead?

Key Points

Admittedly, I am quite bullish on NextEra Energy (NYSE: NEE), and for dividend investors, it has long been a favorite. Yet today I'll make the case for Constellation Energy (NASDAQ: CEG) as potentially the better long-term buy. Here's why.

Constellation operates the most nuclear-energy-producing facilities in the U.S. Data centers require power nonstop, and Constellation can meet those needs with its carbon-free, around-the-clock nuclear capabilities. While NextEra is moving into nuclear as well, the process to get up and running takes time, and Constellation is already there.

Missed Nvidia in 2009? This Rare Signal Is Flashing Again. In 2009, a "Double Down" signal flashed for a little-known chipmaker called Nvidia. For the first time in years, that same "Total Conviction" signal is flashing for a company 1/100th the size of Nvidia. Continue »

Constellation Energy and NextEra Energy logos on blue backdrops.

Image source: The Motley Fool.

Constellation's financials are strong, and its second-quarter revenue reached $7.5 billion, a 23% increase from the year prior. Management also raised its full-year guidance for adjusted operating earnings to a range of $11.50 to $12.50 per share.

Constellation's footprint is also expanding. This September, the company agreed to purchase a gas plant in Rhode Island that will add 609 megawatts of capacity. The plant also comes complete with a 15-year purchase agreement with Toyota.

Constellation's stock has stumbled despite the positive news, falling more than 25% in 2026 as of this writing. With shares trading around $260, Wall Street's consensus average price target of $347 implies significant growth potential ahead.

In my mind, NextEra is more of an income investment, and Constellation is more growth-oriented. While Constellation does have a dividend, the yield is less than 1%. NextEra is a solid choice for most portfolios, but I really see a strong upward trajectory ahead for Constellation.

The stock's decline this year creates an attractive entry point for long-term investors.

Should you buy stock in Constellation Energy right now?

Before you buy stock in Constellation Energy, consider this:

The Motley Fool Stock Advisor analyst team just identified what they believe are the 10 best stocks for investors to buy now… and Constellation Energy wasn’t one of them. The 10 stocks that made the cut could produce monster returns in the coming years.

Consider when Netflix made this list on December 17, 2004... if you invested $1,000 at the time of our recommendation, you’d have $375,240!* Or when Nvidia made this list on April 15, 2005... if you invested $1,000 at the time of our recommendation, you’d have $1,403,292!*

Now, it’s worth noting Stock Advisor’s total average return is 933% — a market-crushing outperformance compared to 211% for the S&P 500. Don't miss the latest top 10 list, available with Stock Advisor, and join an investing community built by individual investors for individual investors.

See the 10 stocks »

*Stock Advisor returns as of October 1, 2026.

Catie Hogan has positions in NextEra Energy. The Motley Fool has positions in and recommends Constellation Energy and NextEra Energy. The Motley Fool has a disclosure policy.

  •  

October Could Be a Huge Month for the Stock Market. Here's Why.

Key Points

  • If the AI hyperscalers offer up capital expenditure projections for next year, those forecasts could move a lot of big tech stocks.

  • The second half of the month is when investors can expect bigger stock price moves.

Investors have survived September, the historically worst month of the year for stock market returns. Outside of February (which has an average return that's just barely negative), September is the only month to average a negative return for the S&P 500 (SNPINDEX: ^GSPC). The S&P 500 was actually positive for September this year, although it wasn't a very large positive gain -- less than 1%. However, that primes the market for October.

The S&P 500 has averaged about a 0.9% positive return in October, making it one of the better months (although not as good as November or December). I think there's a huge opportunity coming in October, and it could send the market skyrocketing.

Missed Nvidia in 2009? This Rare Signal Is Flashing Again. In 2009, a "Double Down" signal flashed for a little-known chipmaker called Nvidia. For the first time in years, that same "Total Conviction" signal is flashing for a company 1/100th the size of Nvidia. Continue »

A rising stock chart seen in the reflection of an investor's glasses.

Image source: Getty Images.

October has some major catalysts coming

October is the start of the fourth quarter, which means companies will start to report their third-quarter results. There are some highly anticipated Q3 earnings reports coming out soon, including many of the AI hyperscalers. We'll get updated on how businesses like Alphabet (NASDAQ: GOOG) (NASDAQ: GOOGL), Amazon (NASDAQ: AMZN), and Microsoft (NASDAQ: MSFT) are doing in the second half of the month, and what they say could shape how the market performs through the end of 2026.

These three tech megacaps are spending hundreds of billions of dollars to build new AI computing capacity in data centers. So far, the growth rates their respective cloud computing businesses have put up have made these investments worth it. This trio may decide to use their next earnings reports to reveal 2027 capital expenditure guidance, which could cause the markets to decline or soar based on the extent to which these three are planning on spending.

It's already widely assumed that these three will increase their capital expenditures in 2027, but the question remains as to how much. I think they will make hefty hikes to their capex budgets, but that they will justify that spending by reporting further massive revenue growth from their cloud computing divisions.

Take Alphabet's Google Cloud, for example. In Q2, its revenue rose 82% year over year, and it delivered a 36% operating margin. That's an incredible business, and if Alphabet has customer demand for more capacity (which it does), it should be commended for heavily investing in this business unit. I expect Amazon and Microsoft to say the same thing, which could send their shares skyrocketing. This would also have positive implications for chip providers like Nvidia, Taiwan Semiconductor Manufacturing, and Broadcom, which also make up a hefty portion of the value of the stock market.

If the giant tech companies that account for more than a third of the value of the S&P 500 perform well, they should pull the rest of the market up with them and make October 2026 a fantastic month on Wall Street.

Should you buy stock in Alphabet right now?

Before you buy stock in Alphabet, consider this:

The Motley Fool Stock Advisor analyst team just identified what they believe are the 10 best stocks for investors to buy now… and Alphabet wasn’t one of them. The 10 stocks that made the cut could produce monster returns in the coming years.

Consider when Netflix made this list on December 17, 2004... if you invested $1,000 at the time of our recommendation, you’d have $375,240!* Or when Nvidia made this list on April 15, 2005... if you invested $1,000 at the time of our recommendation, you’d have $1,403,292!*

Now, it’s worth noting Stock Advisor’s total average return is 933% — a market-crushing outperformance compared to 211% for the S&P 500. Don't miss the latest top 10 list, available with Stock Advisor, and join an investing community built by individual investors for individual investors.

See the 10 stocks »

*Stock Advisor returns as of October 1, 2026.

Keithen Drury has positions in Alphabet, Amazon, Broadcom, Microsoft, Nvidia, and Taiwan Semiconductor Manufacturing. The Motley Fool has positions in and recommends Alphabet, Amazon, Broadcom, Microsoft, Nvidia, and Taiwan Semiconductor Manufacturing. The Motley Fool has a disclosure policy.

  •  
❌